By Scott Rubner
Bottom Line: There is no change to my working equity market framework. I remain on watch for daily all-time highs, but more importantly I am on alert for a “blow-off” top led by the laggards. The pain trade remains higher.
It is time for a thread.

1. July option expiration was an important market technical as a few trillion option notional expired. Citadel Securities’ Institutional Index trading team estimates >50% of the long gamma in the market expired on Friday (7/18). Reducing the long gamma position means that the stock market can move more freely and is no longer pinned around the current spot (6300). S&P 500 has not moved more than 1% higher or lower in the last 19 trading sessions, which is the longest streak of 2025.
Corporate Earnings Expectations and Positioning
2. 88% of the S&P 500 market capitalization will have reported Q2 earnings by August 29th. 18% of the S&P 500 market cap reports earnings this week, led by the Communications sector. Alphabet (3.62% SPX weight) and Tesla (1.8% SPX weight) report quarterly earnings after market hours tonight. These are the first two companies of the “Magnificent 7” to report quarterly earnings. Nvidia is the last M7 to report earnings on August 27th.
SPX Q2 Earnings by Week
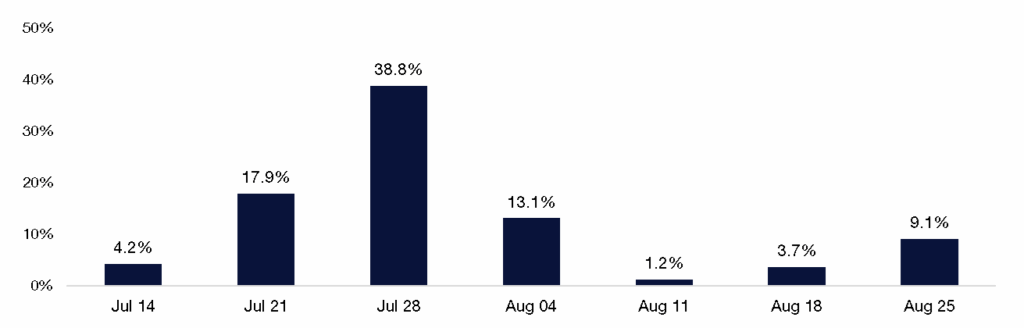
Source: Citadel Securities, S&P Global, as of 7/23/25. Figures are for illustrative purposes only. Past performance figures do not guarantee future results.
3. US corporates will return from the blackout window following quarterly earnings and I think they have some capacity to increase share repurchase activity.
4. The “Superbowl” of earnings is next week (July 28th) where 39% of the S&P 500 market capitalization report quarterly earnings. Microsoft and Meta report earnings on 7/30 and Apple and Amazon report earnings on 7/31.
SPX GICS Sector Quarterly Earnings by Marketcap
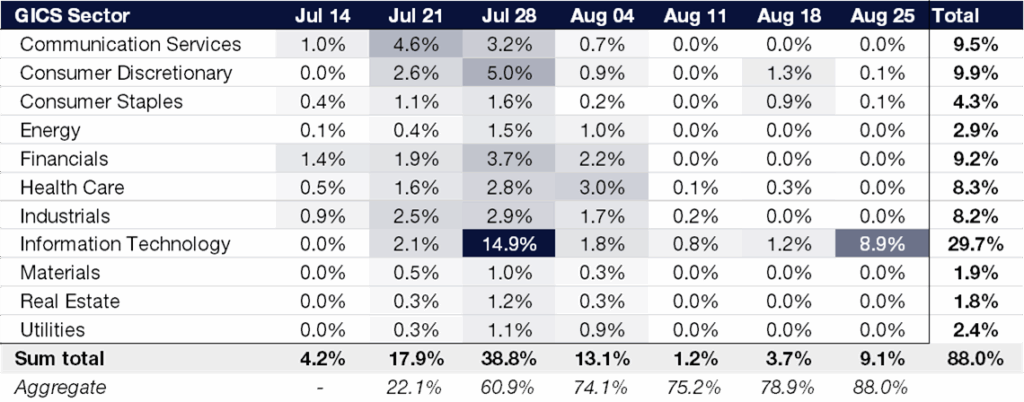
Source:Citadel Securities, S&P Global, as of 7/24/25. Figures are for illustrative purposes only. Past performance figures do not guarantee future results.
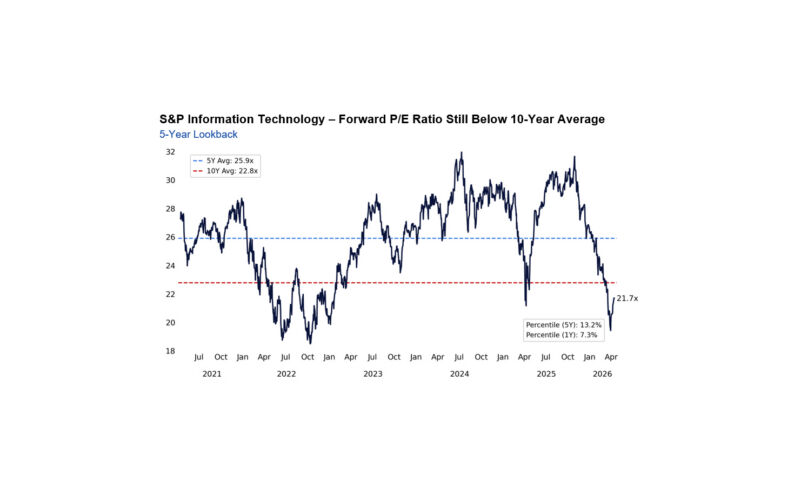
5. Information Technology is the largest sector reporting earnings next week, with 14.9% of the S&P 500 market capitalization. S&P 500 index concentration is an important passive technical indicator, and a primary driver of target-date and 401k/retirement fund flows.
If you allocate $1 into the SPX Index, 33 cents are allocated into the “Magnificent 7” stocks.
If you allocate $1 into the NDX Index, 43 cents are allocated into the “Magnificent 7” stocks.
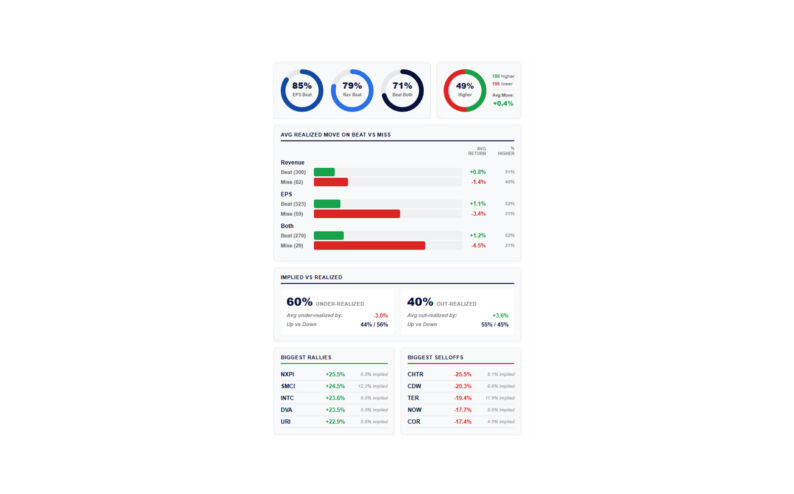
6. US corporate earnings expectations remain low. 169 of 193 companies (87%) who have reported beat earnings estimates. Confidence and clarity have become key themes of US corporate earnings thus far.
2025 Q3 S&P 500 Earnings
As of July 23, 2025
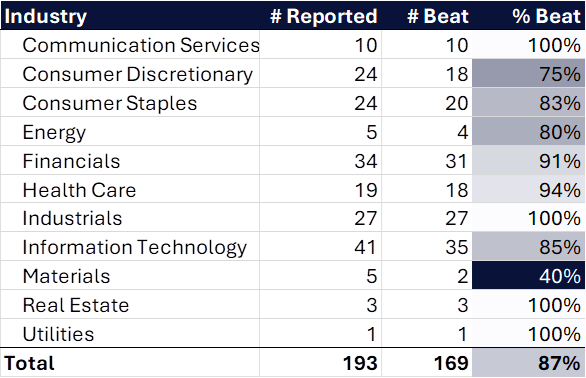
Source: Source: Citadel Securities, Bloomberg, as of 7/23/25. Figures are for illustrative purposes only. Past performance figures do not guarantee future results.
7. Despite a relatively calm S&P index spot level this week, there was a lot of single name dispersion movement under the hood.
8. This week, Citadel Securities’ equity and volatility trading flows saw clear retail demand in anti-momentum, high realized volatility, high market beta, and market consensus shorted equities. I must admit, some of these highflyers were not on my BINGO card.
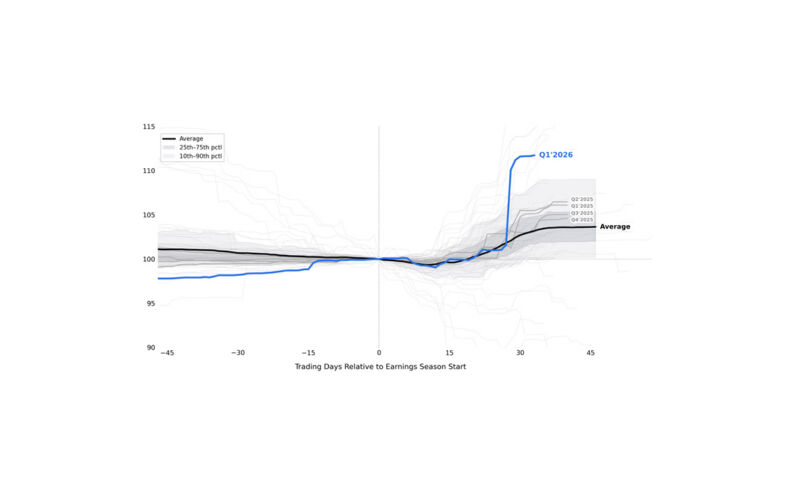
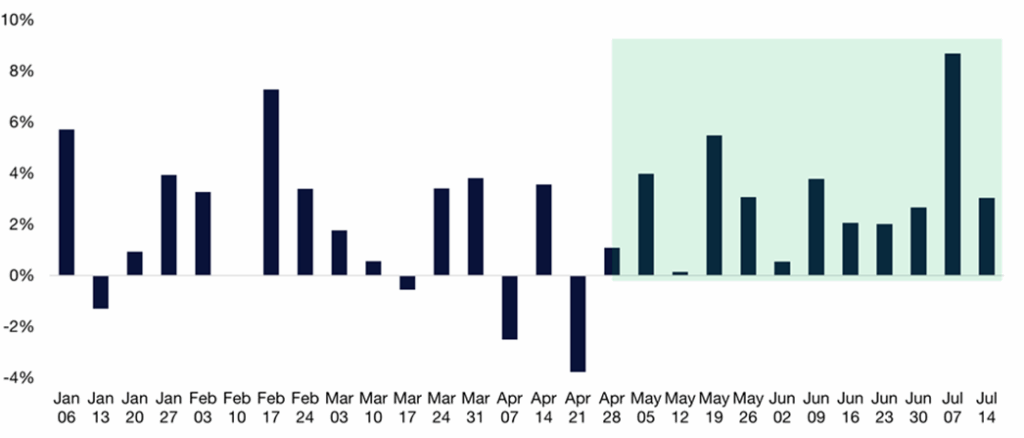
9. July seasonals are an important feature of this equity market rally. Looking at the past 100 years, S&P tends to base around this week before heading higher into month-end. This behavior is consistent with number of vacation schedules, pool parties, and a general unwillingness to put on a new short during August.
S&P 500 July Daily Performance
Since 1928
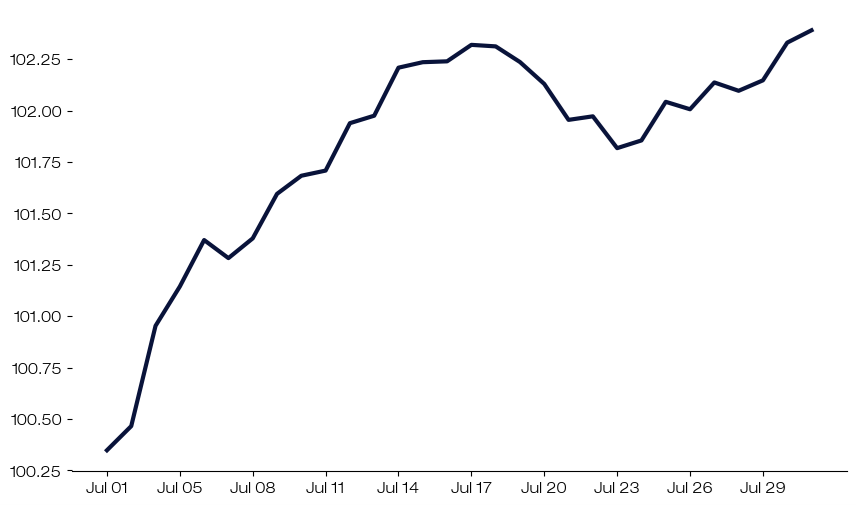
Source: Citadel Securities, Bloomberg, as of 7/23/25. Figures are for illustrative purposes only. Past performance figures do not guarantee future results.
10. Volatility may continue to move lower in July. VIX spot is 16 this morning.
Since 1990, July typically represents an inflection point for the VIX, marking the lowest point of the year.
Lower volatility readings continue to be a major input as the decline in realized volatility may signal continued non-fundamental rules-based equity demand.
VIX Monthly Performance
Since 1990
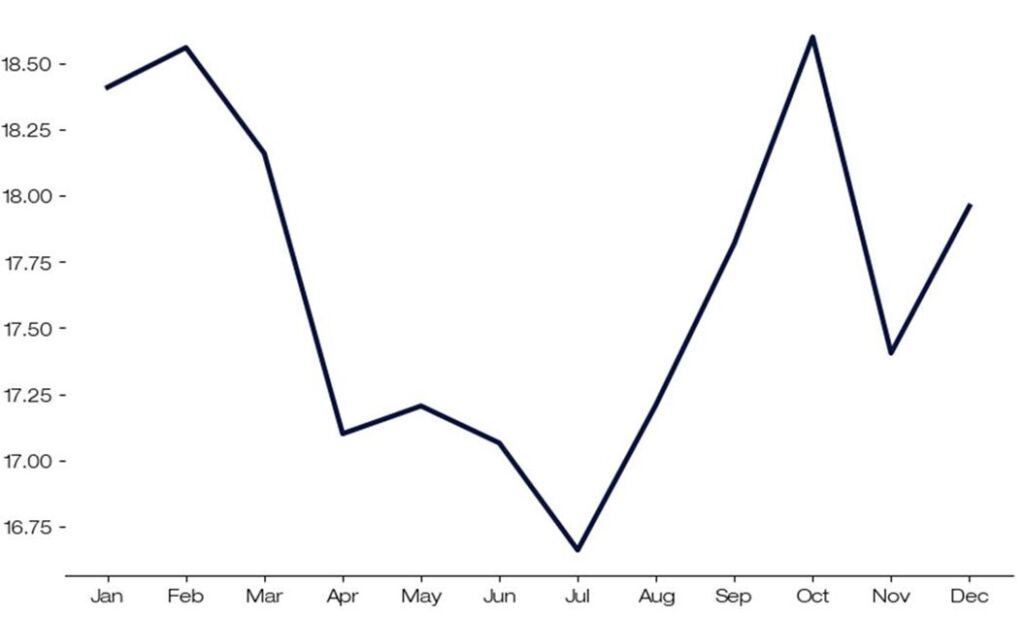
Source: Citadel Securities, Bloomberg, as of 7/23/25. Figures are for illustrative purposes only. Past performance figures do not guarantee future results.
Retail Positioning
12. Citadel Securities’ retail activity has been a buyer of cash equities for the past 19 straight trading sessions. This is the longest daily buying streak in the past 4 years (since March 2021) and 5th longest streak on record.
The last retail net notional sell day across our platform was on June 24th or a month ago.
Longest Retail Cash Buying Streaks on Record
# of days
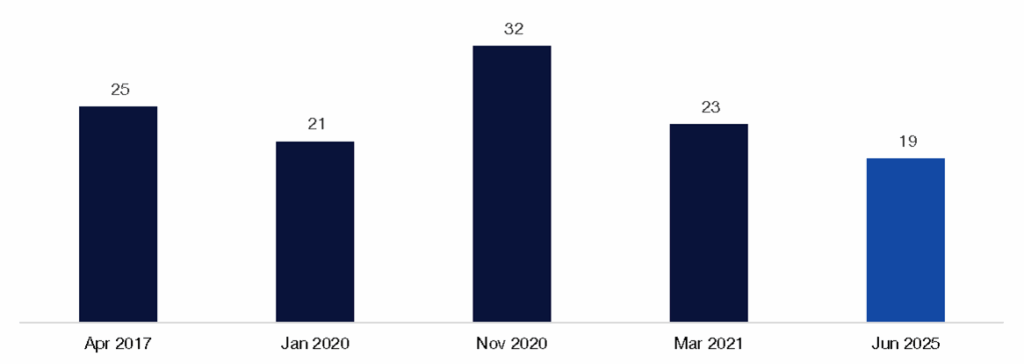
Source: Citadel Securities, as of 7/23/25. Figures are for illustrative purposes only. Past performance figures do not guarantee future results.
13. Citadel Securities’ retail activity has been a buyer of cash equities in 12 out of the past 14 weeks and many weeks following liberation day.
Retail Cash Equities – Net Notional by Week
Std dev January – July 2025
Source: Citadel Securities, as of 7/23/25. Figures are for illustrative purposes only. Past performance figures do not guarantee future results.
Volatility Positioning
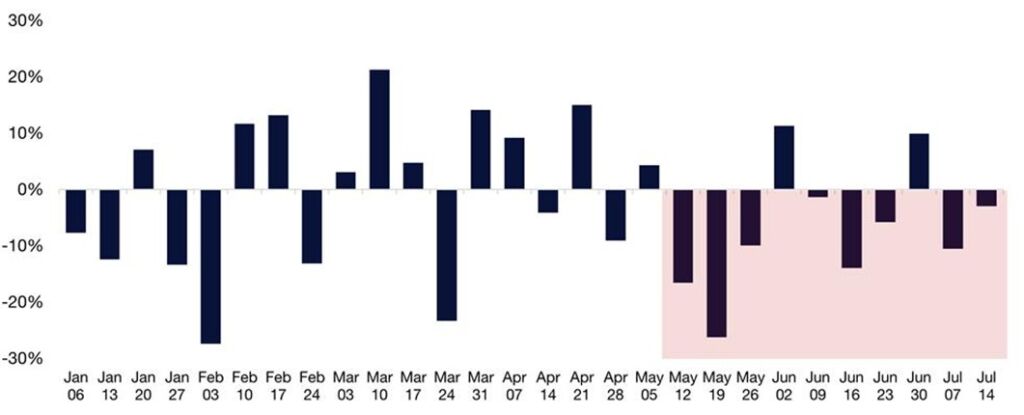
14. Citadel Securities’ retail activity has been bullish in options for the past 13 straight trading sessions.
15. Citadel Securities’ retail activity has been bullish in options for the past 12 straight weeks.
Retail Options – Put / Call Direction Ratio by Week
January – July 2025
Source: Citadel Securities, as of 7/23/25. Figures are for illustrative purposes only. Past performance figures do not guarantee future results.
16. For only the 7th time in our dataset, which started in January 2020, retail has been a buyer of options for 12 straight weeks. The average duration of the other 6 instances is 18 weeks, or another 6 weeks on average (~the first week of September ).
Longest Retail Weekly Option Buying Streaks on Record
# of weeks
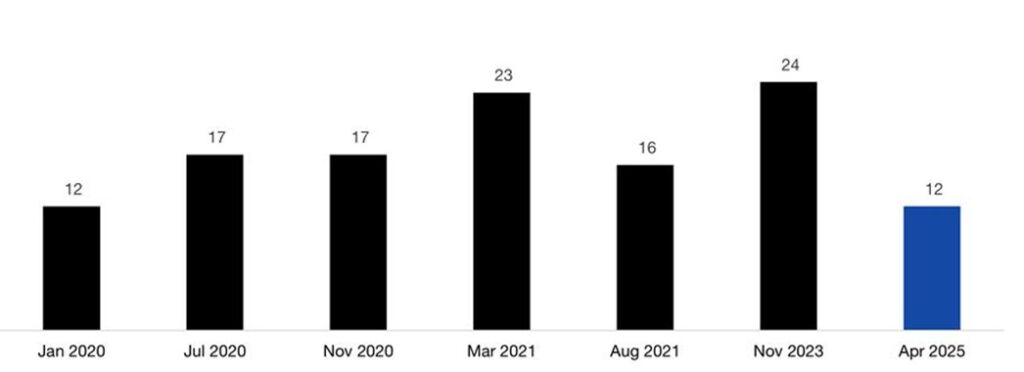
Source: Citadel Securities, as of 7/23/25. Figures are for illustrative purposes only. Past performance figures do not guarantee future results.
Institutional Positioning
17. Citadel Securities’ institutional clients have been bearish in the past 8 of the past 10 weeks. Our institutional flow is consistent with general cautiousness in the market from professional investors.
Institutional Options – Put / Call Direction Ratio by Week
January – July 2025
Source: Citadel Securities, as of 7/23/25. Figures are for illustrative purposes only. Past performance figures do not guarantee future results.
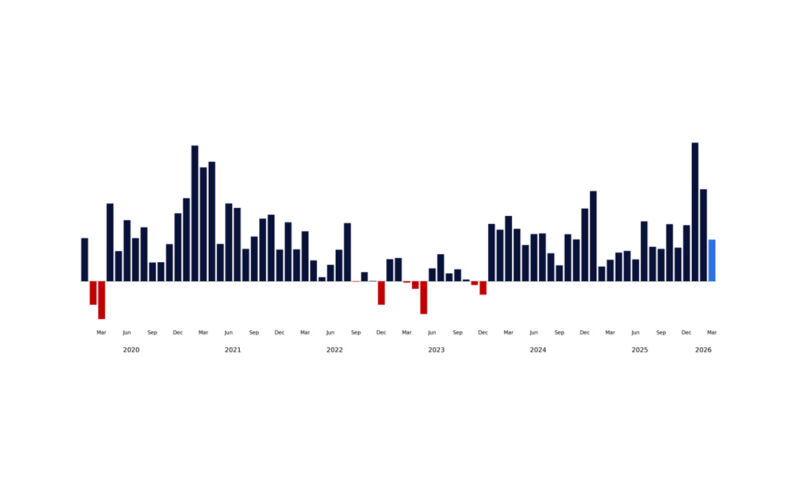
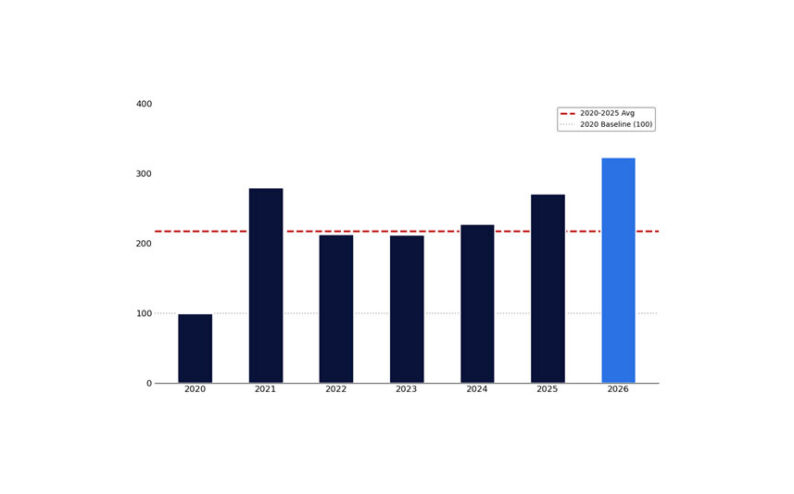
18. Money market assets under management currently sit at a record $7 trillion.
Money Markets Asset Under Management (trillions)
January 2020 – July 2025: Source ICI.
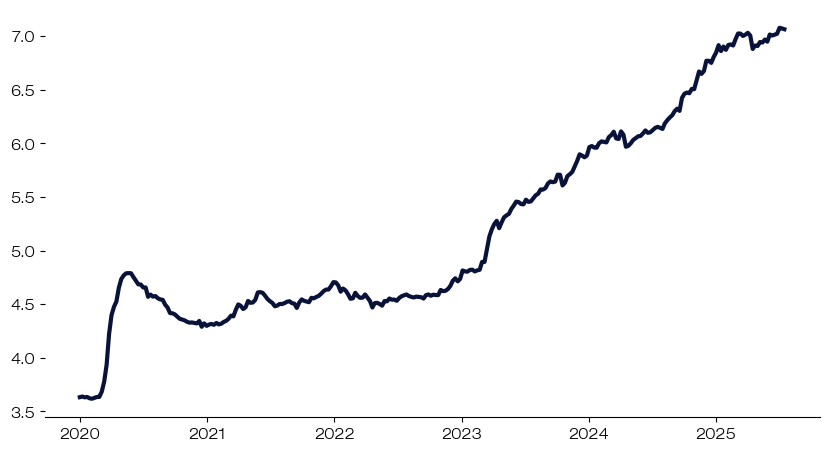
Source: Citadel Securities, ICI, as of 7/23/25. Figures are for illustrative purposes only. Past performance figures do not guarantee future results.
Investors were quick to redeem this cash pile during the two weeks in April. Between April 2nd and April 16th, $151 billion worth of money markets were redeemed. My larger view is that dips will remain shallow given this structural bid to “cash on the sidelines” and positive US employment outlook.
Money Market Assets Under Management (trillions)
January – July 2025: Source ICI.
Source: Citadel Securities, ICI, as of 7/23/25. Figures are for illustrative purposes only. Past performance figures do not guarantee future results.
Systematic Re-Leveraging:
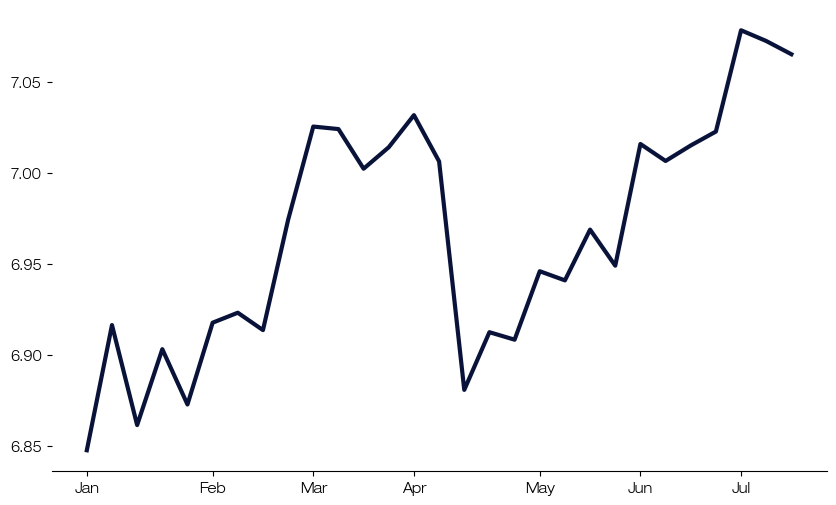
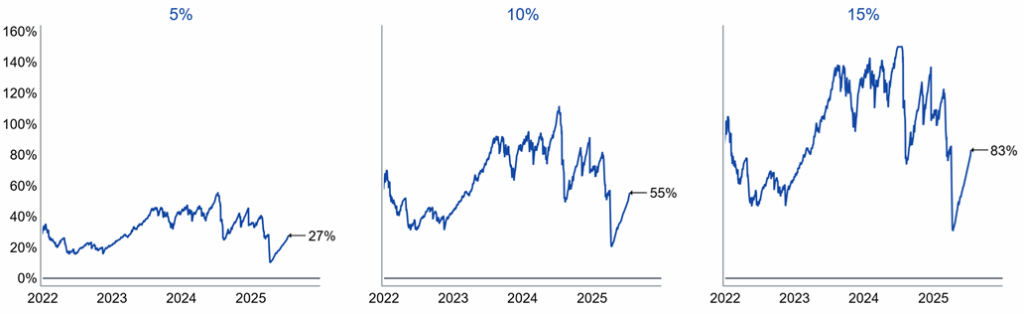
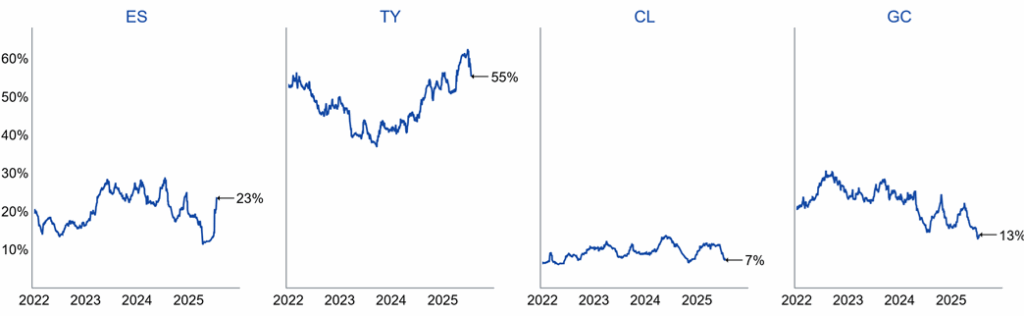
19. According to Citadel Securities’ macro strategy team, Commodity Trading Advisors (CTA) strategies, which are momentum and trend followers, have plenty of room to add equity exposure. Positioning from this cohort is not stretched and has capacity to add exposure over the next month.
US Equity Aggregate CTA Positioning
Source: Citadel Securities, as of 7/23/25. Figures are for illustrative purposes only. Past performance figures do not guarantee future results.
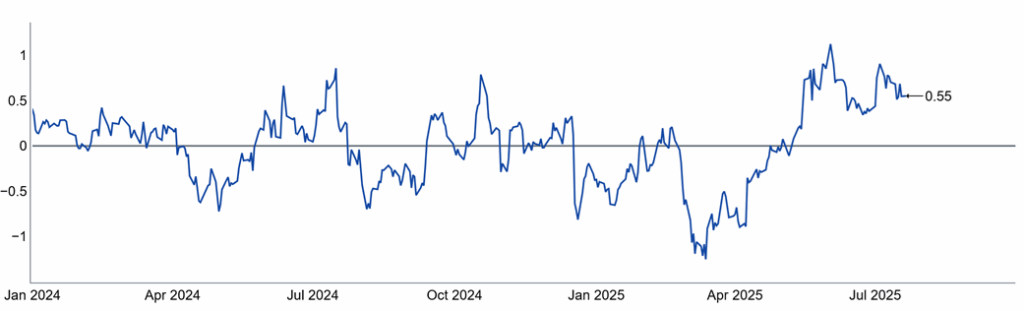
Global Equity Aggregate CTA Positioning
Source: Citadel Securities, as of 7/23/25. Figures are for illustrative purposes only. Past performance figures do not guarantee future results.
20. CTA medium-term “flip” thresholds are materially below current spot and give equity futures a large buffer before hitting a trigger level. Citadel Securities’ global macro strategy team estimates the ES1 (SPX) flip level at 6106 vs. current levels of 6370.
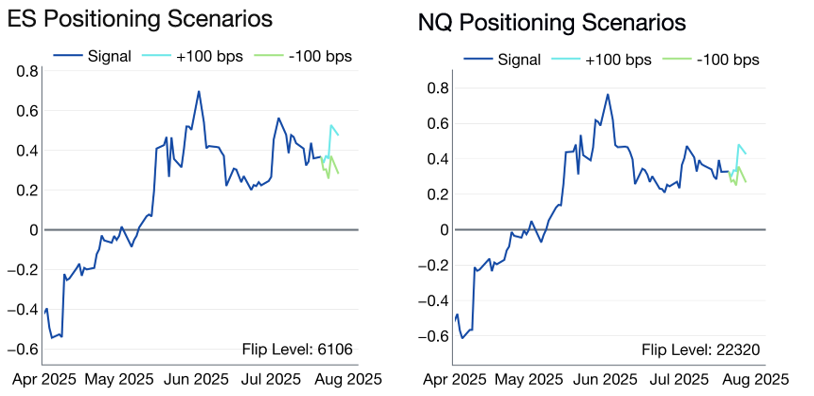
Source: Citadel Securities, as of 7/23/25. Figures are for illustrative purposes only. Past performance figures do not guarantee future results.
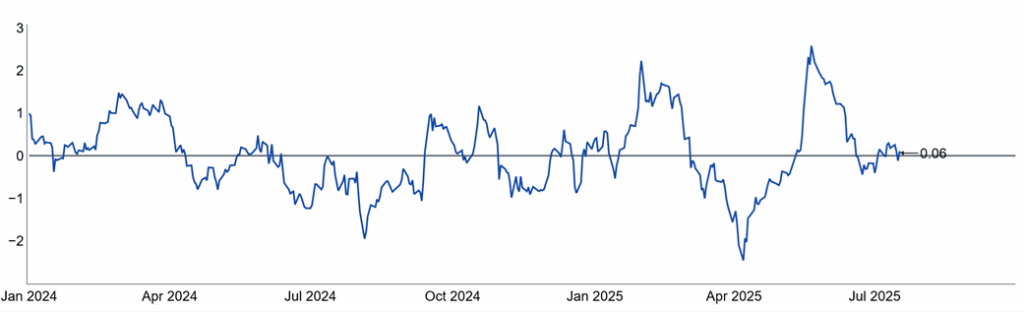
21. Vol-Control strategies, which take cues from the realized volatility market, may continue to ramp equity exposure as volatility moves lower. 3-month realized S&P vol is 26.5 compared to 10-day realized vol (4.8) and 30-day realized (8.9).
Vol Control Exposure Levels
Source: Citadel Securities, as of 7/23/25. Figures are for illustrative purposes only. Past performance figures do not guarantee future results.
22. Risk Parity strategies, which also take cues from cross asset volatility measures, also have capacity to add equity exposure. This is especially relevant in the context of the MOVE index (rate volatility), which is near its lowest level since 2022.
Risk Parity Positions
Source: Citadel Securities, as of 7/23/25. Figures are for illustrative purposes only. Past performance figures do not guarantee future results.
Market Direction / Feedback from first note:
a. September 2nd is the first trading session following Labor Day. I do not get the impression that investors will want to wait that long to start adding downside hedges.
b. Multiple incoming client pings / IBs / emails this week from Long / Short HF’s, CRO’s, and TMT multi-managers with sentiment that Citadel Securities is producing some of the best real time color during these factor moves in the market.
c. There has been a lot of focus around the timing of a potential correction. These conversations will heat up during late August, especially fading some of these factor moves.
d. I just wanted to say thank you to our clients for making my launch successful. Feedback and sentiment from my first was euphoric. There is a buzz in my inbox, and it is an electric feeling.
S&P 500 September Daily Performance
Since 1928
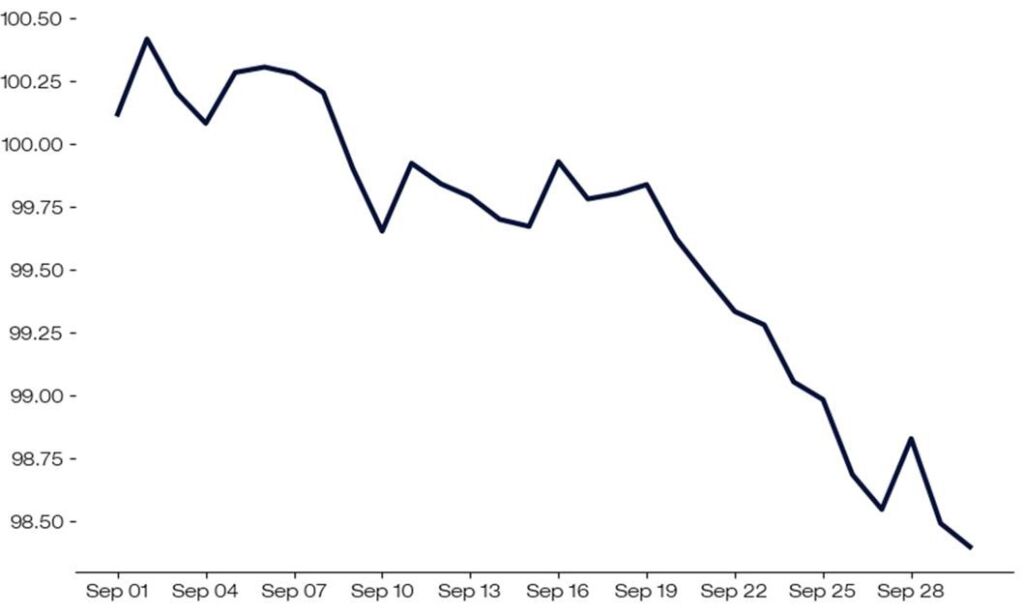
Source: Citadel Securities, Bloomberg, as of 7/23/25. Figures are for illustrative purposes only. Past performance figures do not guarantee future results.
NDX September Daily Performance
Since 1985
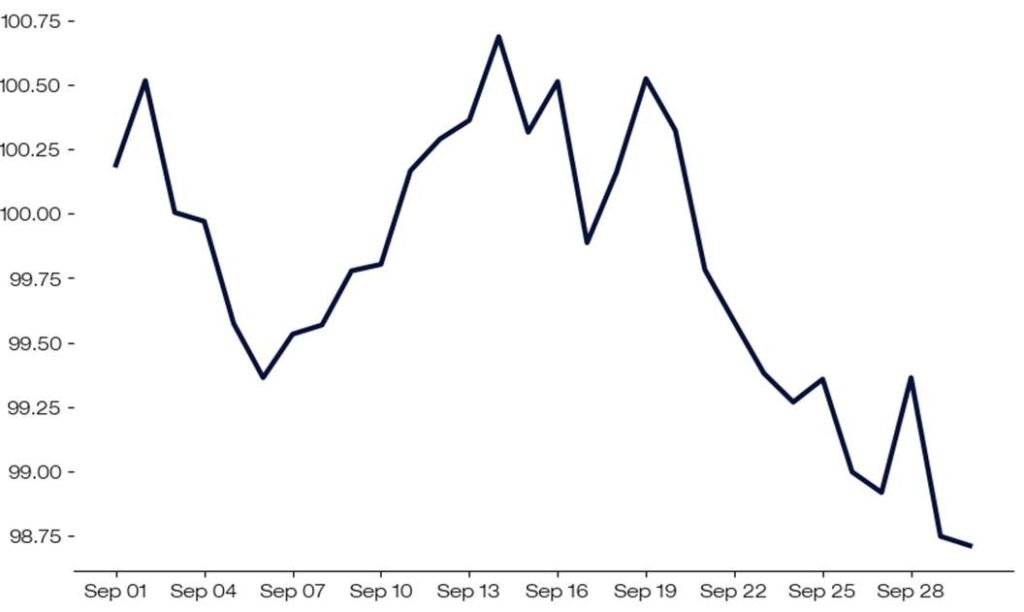
Source: Citadel Securities, Bloomberg, as of 7/23/25. Figures are for illustrative purposes only. Past performance figures do not guarantee future results.
Copyright © Citadel Enterprise Americas LLC or one of its affiliates. All rights reserved.
Legal Entities Disseminating this Material: This material is disseminated in the United Kingdom by Citadel Securities (Europe) Limited (“CDGE”) authorized and regulated by the Financial Conduct Authority (“FCA”) (Registered company number: 05462867); in the European Union by Citadel Securities GCS (Ireland) Limited (“CSGI”) and its Paris Branch authorized and regulated by the Central Bank of Ireland (“CBI”) (Registration Number: C173437); in Hong Kong by Citadel Securities (Hong Kong) Limited (“CDHK”) licensed by the Securities and Futures Commission of Hong Kong (“SFC”), in Japan by Citadel Securities Japan Co., Ltd (“CSJC”) registered as a Type 1 financial instruments business operator with the Japan Financial Services Agency (“JFSA”); and in the United States of America by Citadel Securities LLC (“CDRG”) registered with the Securities Exchange Commission (“SEC”), Financial Industry Regulatory Authority (“FINRA”), and Securities Investor Protection Corporation (“SIPC”), Citadel Securities Institutional LLC (“CSIN”) registered with the SEC, FINRA, and SIPC, or Citadel Securities Swap Dealer LLC (“CSSD”) registered with the SEC, Commodities Futures Trading Commission (“CFTC”), and National Futures Association (“NFA”). Unless governing law permits otherwise, you must contact a Citadel Securities entity in your home jurisdiction if you want to use our services in effecting a transaction in any financial instruments or securities, including derivatives.
FOR INSTITUTIONAL USE ONLY; FOR PROFESSIONAL CLIENTS AND ELIGIBLE COUNTERPARTIES ONLY. This material is not intended as and does not constitute investment research. Contents of this material will be strictly limited to non-specific, generic information (i.e. macro events/topics) and are not subject to the Markets in Financial Instruments directive (MiFID II) or FINRA research rules. This material does not constitute an offer, solicitation, invitation, or inducement to purchase, acquire, subscribe to, provide, or sell any financial instrument or otherwise engage in investment activity. Please see additional important disclosures, including disclosures that may be relevant to your country of residence or business at www.citadelsecurities.com/GlobalSalesTrading.