-
Who We Are
- What We Do
Series: Global Market IntelligenceEquity Supply and Demand
By Scott Rubner
Bottom Line: The US stock market does not always reflect the broader economy. On Friday, we received macroeconomic data which increased investor bearishness, yet our client franchise was quick to buy the dip.
The competition for ‘dip alpha’ is intensifying. In August, Citadel Securities is seeing an equity supply-and-demand mismatch. This positive flow dynamic is expected to shift in early September, potentially leaving markets more exposed to macroeconomic headlines.
What did Citadel Securities see across its platform on Friday when S&P was down (-1.60)%?
- Citadel Securities’ retail option flow average put-call direction ratio was 12% better to buy on Friday. Citadel Securities’ retail option volume was in the 100th percentile on a 1-year lookback and was 48% higher than our 1-year daily average.
- Citadel Securities’ institutional option volume ranked in the 98th percentile over a 1-year lookback and 2.6 times higher than the 1-year daily average.
- Citadel Securities’ retail flow has been net positive (buy-side) in 27 of the past 28 trading sessions. Citadel Securities’ retail activity was better to buy on Friday with a +0.58 z-score net notional ranking and +2.18 gross z-score net notional ranking (using z-score to help standardize data).
- Several technical factors may have amplified Friday’s move, including month-end pension rebalancing, target-date retirement adjustments, ETF rebalances, and profit-taking ahead of summer vacations. Equity markets rebounded quickly on Monday and futures are higher out of the gates this morning.
It is time for a thread.

I. Retail Positioning
1. Citadel Securities’ retail flow has been a net buyer of cash equities in 27 of the last 28 trading sessions.
2. Citadel Securities’ retail activity has been a buyer of cash equities in 14 of the last 16 weeks following Liberation Day.
3. Citadel Securities’ retail clients have consistently been net buyers, both in shares and notional value, for 19 consecutive months. Insights provided by Tom Sozzi.
Retail Cash Equities – Net Notional by Week
Std Dev January – July 2025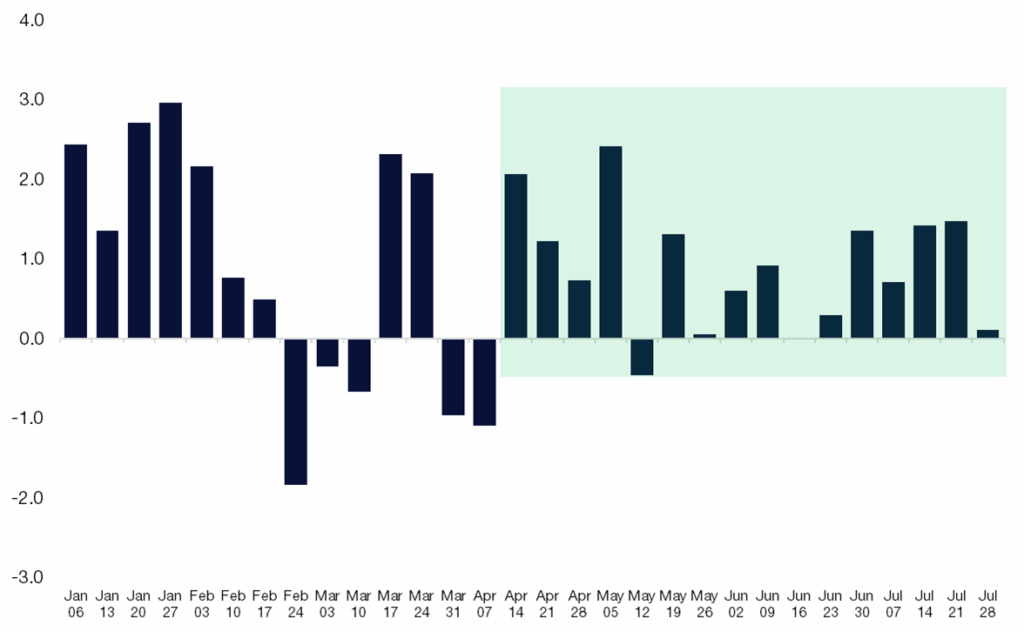
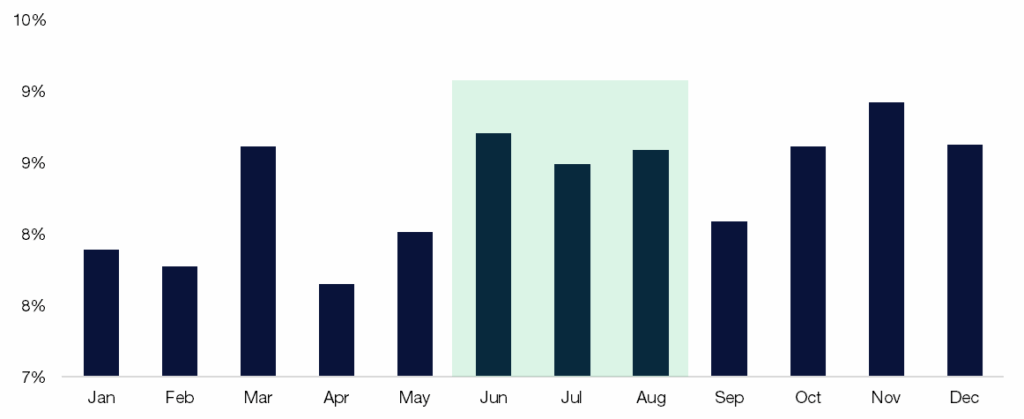
Source: Citadel Securities, as of 8/5/25. Figures are for illustrative purposes only. Past performance figures do not guarantee future results.4. CitadelSecurities’ retail activity has historically shown a stronger footprint in June and July (based on data since 2017). However, retail activity typically decelerates in August as we head into September.
Retail investors are the least active during the month of September of the entire year.
Retail Cash – Proportion of Net Notional By Month
July 1, 2017 – June 30, 2025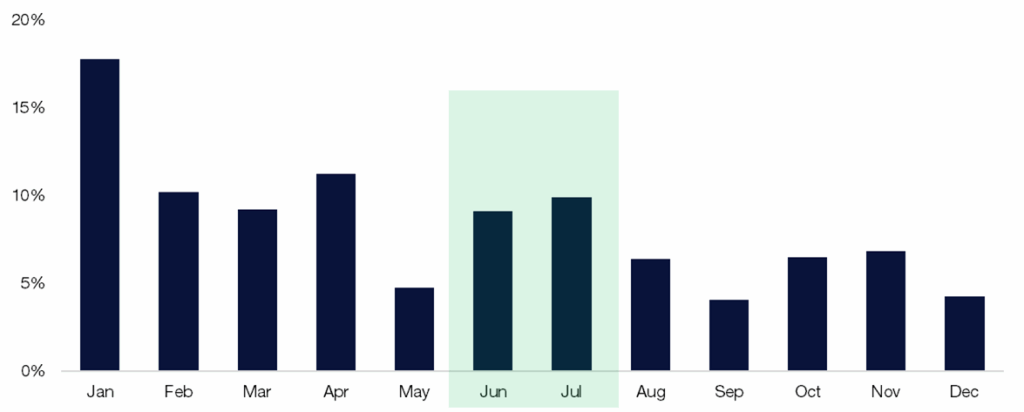
Source: Citadel Securities, as of 8/5/25. Figures are for illustrative purposes only. Past performance figures do not guarantee future results.II. Volatility Positioning
5. July 2025, Citadel Securities recorded its highest monthly retail options activity across the platform (based on monthly data dating back to 2020). Insights provided by Allie Becher.
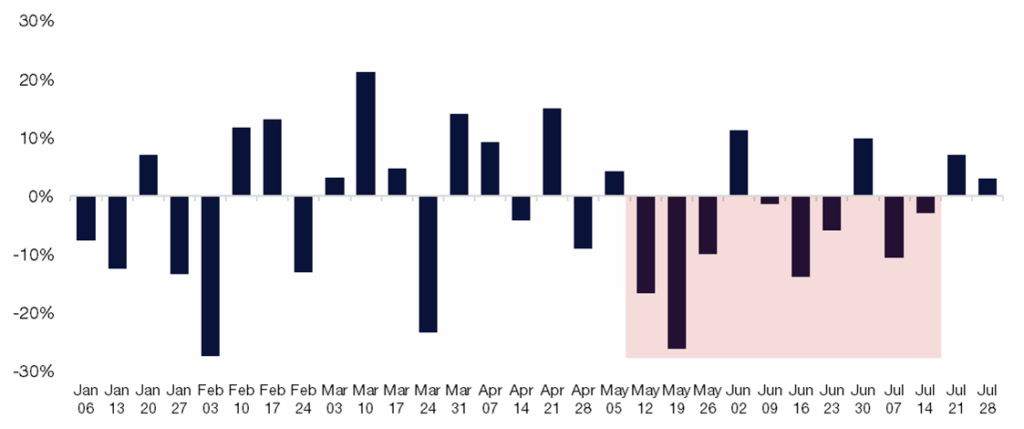
6. Citadel Securities’ retail activity has remained bullish in options for 14 consecutive weeks, dating back to April 2025.
Additionally, Citadel Securities’ retail options activity has been bullish in 20 of the last 21 trading days.
Retail Options – Put / Call Direction Ratio by Week
January – July 2025
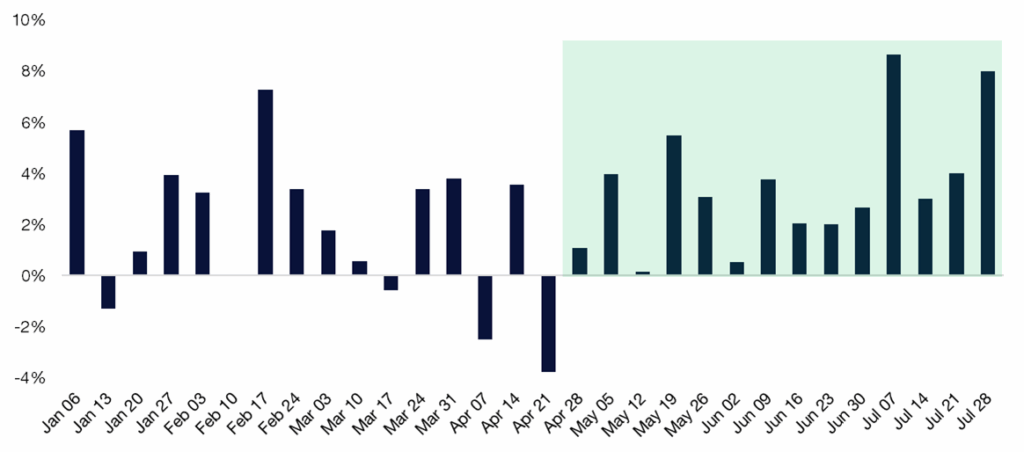
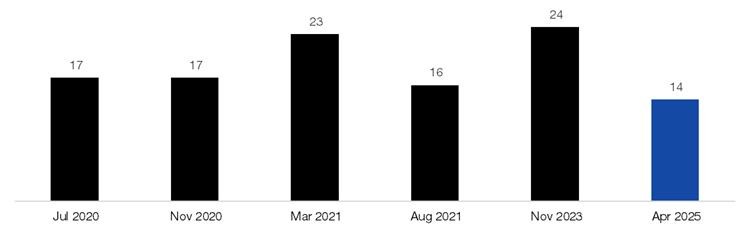
Source: Citadel Securities, as of 8/5/25. Figures are for illustrative purposes only. Past performance figures do not guarantee future results.7. The current bullish streak marks the sixth-longest since our dataset began in 2020.
The average duration of the previous five streaks is 18 weeks, implying that – if the pattern holds – this trend could persist for another four weeks, extending into the first week of September.
Longest Retail Weekly Option Buying Streaks on Record, since 2020.
# of weeks
Source: Citadel Securities, as of 8/5/25. Figures are for illustrative purposes only. Past performance figures do not guarantee future results.8. This seasonal pattern, observed consistently across our trading units, shows market participation typically slows as we transition from August to September. This is an important market dynamic.
Retail Options – Proportion of Contract Volume by Month
January 2020 – December 2024
Source: Citadel Securities, as of 8/5/25. Figures are for illustrative purposes only. Past performance figures do not guarantee future results.9. Citadel Securities’ institutional clients have been bearish 8 of the past 12 weeks, reflecting broader market caution among professional investors.
However, a notable shift occurred last week: we observed a sharp increase in call option activity, indicating a potential change in sentiment as high flying names have created a ‘force-in’ dynamic. There are equity dip buyers despite the consensus view on the macro.
Institutional Options – Put / Call Direction Ratio by Week
January – July 2025
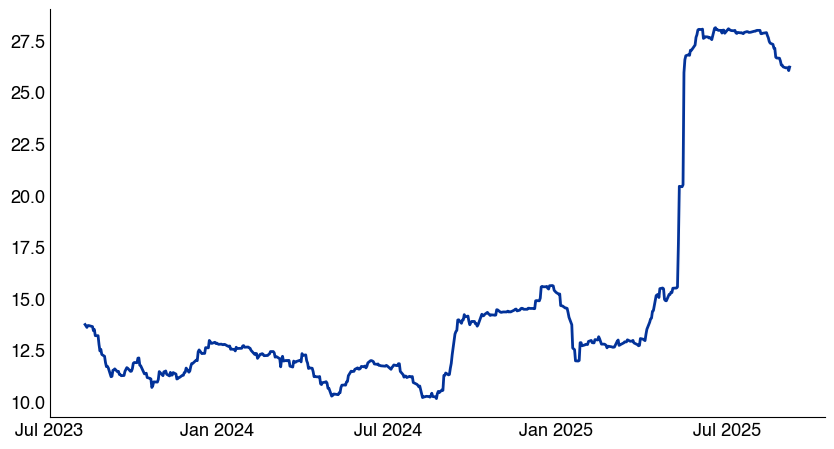
Source: Citadel Securities, as of 8/5/25. Figures are for illustrative purposes only. Past performance figures do not guarantee future results.10. Realized volatility continues to decline as high-volatility periods from April and May fall outside the 90-day observation window.
I have included the realized volatility metrics from Friday, and still there is a steep roll-down. 3-month realized vol currently stands at 26, compared to 9 for 1-month and just 13 for 1-week.
SPX 3-month realized volatility
July 2023 – July 2025
Source: Bloomberg as compiled by Citadel Securities, as of 8/5/25. Figures are for illustrative purposes only. Past performance figures do not guarantee future results.III. Corporate Earnings Expectations and Positioning
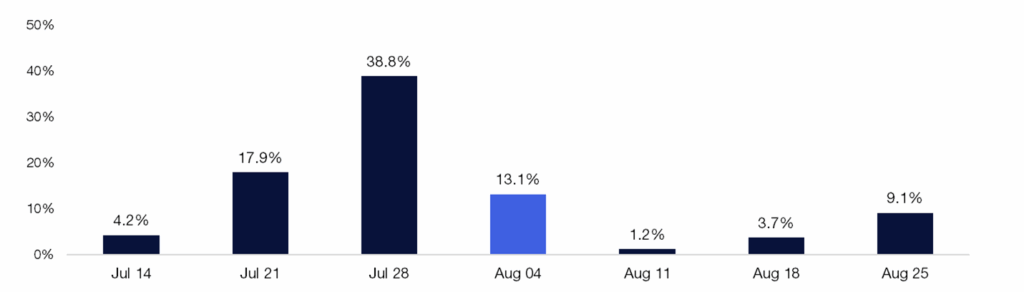
11. This week, 13.1% of the S&P 500’s market cap is scheduled to report quarterly earnings. By the end of the week, 74.1% of the index’s market cap will have reported quarterly earnings. One of the bellwether corporates reported earnings last night quoting “Astonishing” AI impact. AI Capex is the new buybacks.
12. As US corporates emerge from the post-earnings blackout window, I believe there is capacity for increased share repurchase activity – particularly during August.
SPX Market Cap reporting by week
Q2 earnings
Source: As reported by FINRA and compiled by Citadel Securities, as of 7/30/25. Figures are for illustrative purposes only. Past performance figures do not guarantee future results.13. A diverse mix of corporates across multiple sectors are scheduled to report earnings this week, across key semi and consumer stocks.
SPX GICS Sector by Market Cap
Earnings reporting schedule
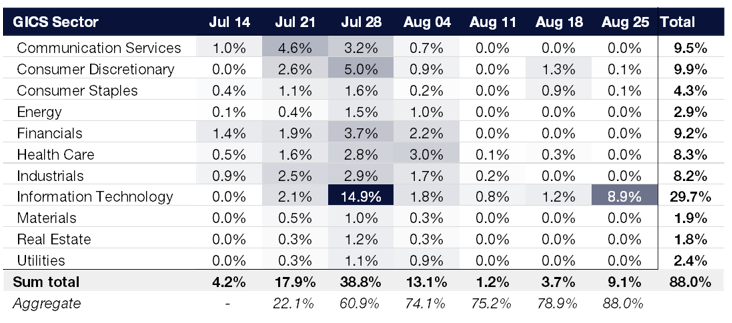
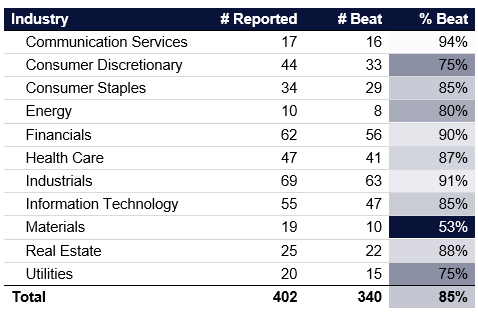
Source: Bloomberg as compiled by Citadel Securities, as of 8/5/25. Figures are for illustrative purposes only. Past performance figures do not guarantee future results.14. Weekly Q2 Earnings Tracker:
US corporate earnings expectations remain subdued, yet results have been strong. Of the 402 companies that have reported thus far, 340 (85%) have exceeded EPS earnings expectations. Confidence and clarity have become key themes of this earnings season.
According to Bloomberg, Q2 EPS beat rate of 85% is well above the 10-year historical average of 74%.
SPX Earnings Reporting
As of August 4, 2025
Source: Bloomberg as compiled by Citadel Securities, as of 8/5/25. Figures are for illustrative purposes only. Past performance figures do not guarantee future results.15. August seasonals are an important feature of this equity market rally.
Looking at the past 100 years, the S&P 500 tends to rally during the month of August, closing the month on the highs. This behavior is consistent with the number of vacations, pool parties, and the general unwillingness to put on a new short during August.
The final week of August, heading into Labor Day, is historically one of the most popular long weekend vacation periods of the year.
SPX August Daily Performance
Since 1928
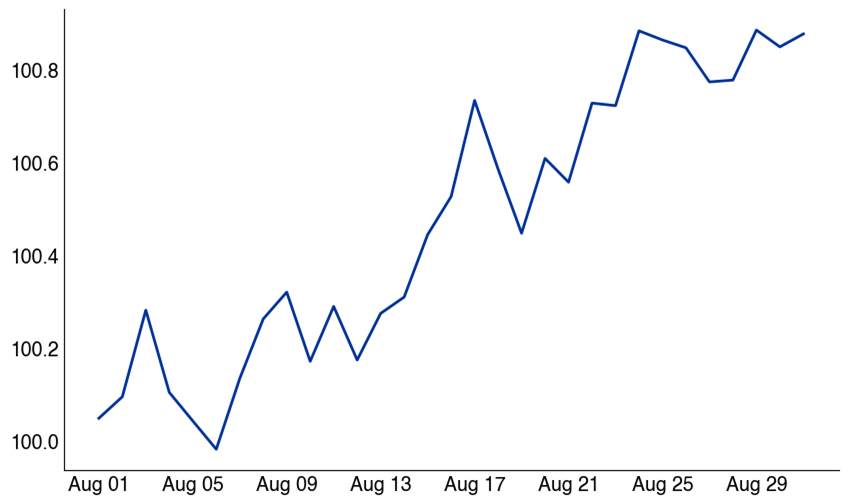
Source: Bloomberg as compiled by Citadel Securities, as of 8/5/25. Figures are for illustrative purposes only. Past performance figures do not guarantee future results.NDX August Daily Performance
Since 1985
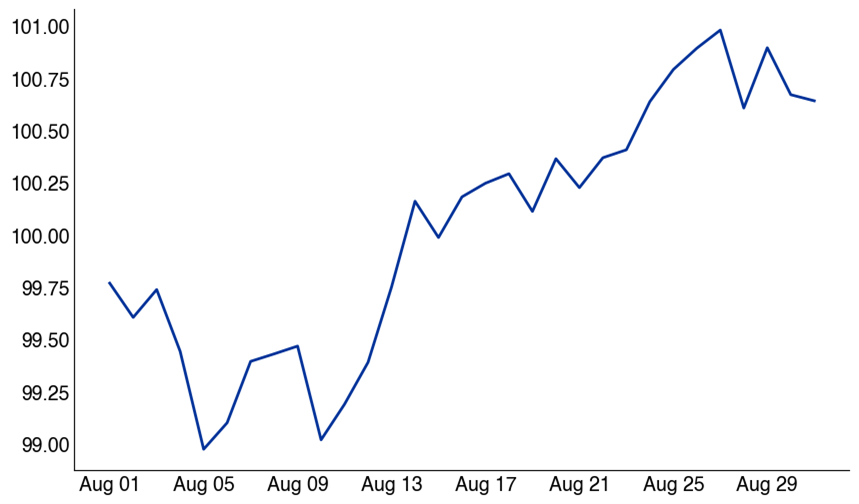
Source: Bloomberg as compiled by Citadel Securities, as of 8/5/25. Figures are for illustrative purposes only. Past performance figures do not guarantee future results.IV. Institutional Positioning and Systematic Re-Leveraging
Theme/Fuller House: Systematic, rules-based strategies should be full by the end of August.
16. Citadel Securities’ global macro strategy team estimates the ES1 (SPX) flip level at 6,166 versus the current level of 6,366. Insights provided by Grant Wilder
US Equity Aggregate CTA Positioning
January 2024 – July 2025
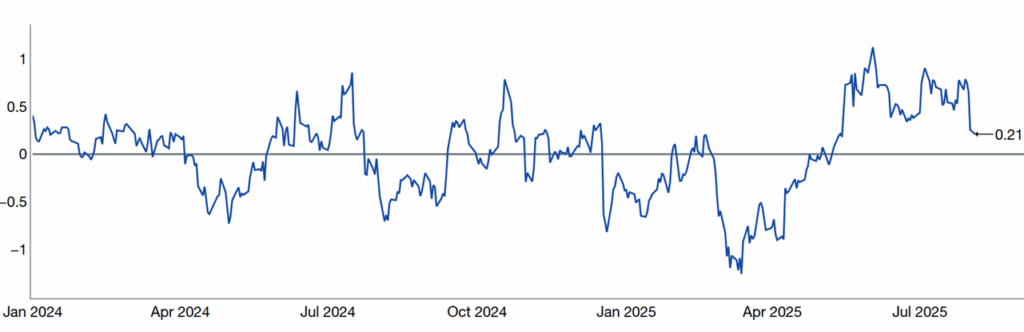
Source: Bloomberg as compiled by Citadel Securities, as of 8/5/25. Figures are for illustrative purposes only. Past performance figures do not guarantee future results.US CTA Signals
January 2024 – July 2025
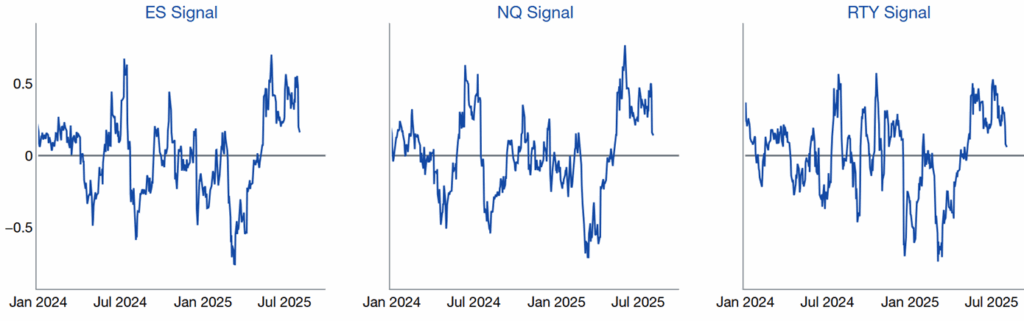
Source: Citadel Securities, as of 8/5/25. Figures are for illustrative purposes only. Past performance figures do not guarantee future results.17. Citadel Securities’ CTA medium-term “flip” thresholds are still below current spot, however the gap is starting to narrow over the past week as calibrate a bit higher spot levels of volatility.
1 week ago:
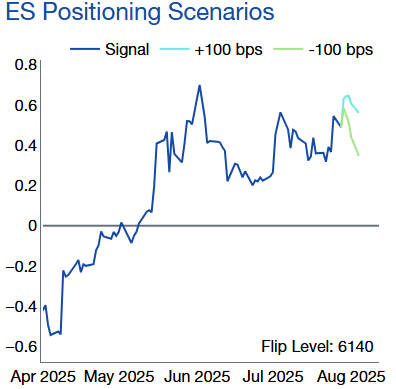
Source: Citadel Securities, as of 8/5/25. Figures are for illustrative purposes only. Past performance figures do not guarantee future results.Now:
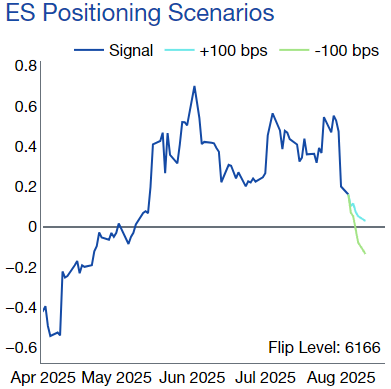
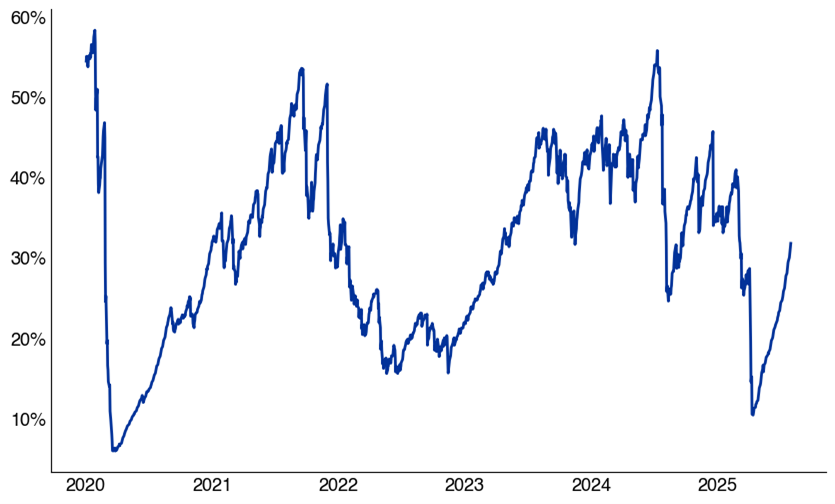
Source: Citadel Securities, as of 8/5/25. Figures are for illustrative purposes only. Past performance figures do not guarantee future results.18. Vol-Control strategies – which take cues from the realized volatility market – may continue to ramp equity exposure as volatility moves lower. Given the move higher in volatility on Friday, vol-control buying demand may start to stall out.
For a vol-target strategy with a 5% risk control, current equity exposure stands at 33% – up from the April low of 10%, but still below the December 2024 peak of 46%.
Vol Target Exposure with 5% Risk Control
Exposure Rank since 2020
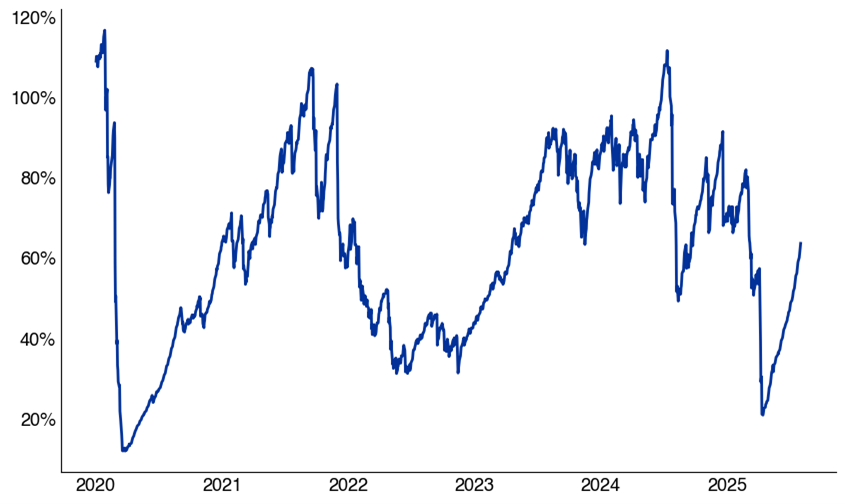
Source: Bloomberg as compiled by Citadel Securities, as of 8/5/25. Figures are for illustrative purposes only. Past performance figures do not guarantee future results.19. For a vol-target strategy with a 10% risk control, current equity exposure stands at 65% – up from the April low of 20%, but still below the December 2024 peak of 91%.
Vol Target Exposure with 10% Risk Control
Exposure Rank since 2020
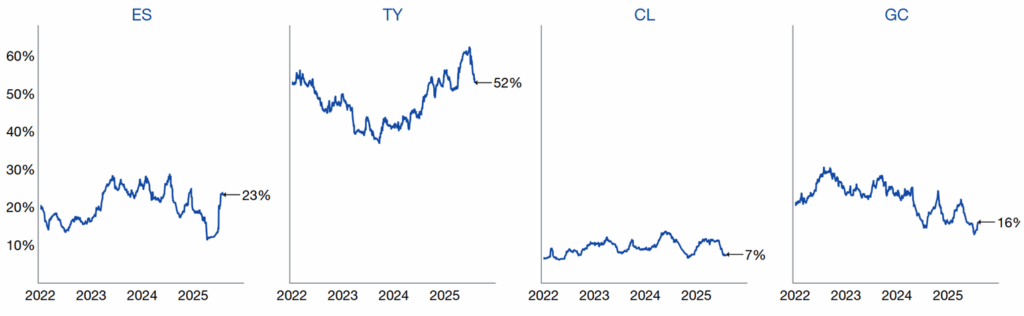
Source: Bloomberg as compiled by Citadel Securities, as of 8/5/25. Figures are for illustrative purposes only. Past performance figures do not guarantee future results.20. Risk Parity strategies – which respond to cross-asset volatility measures – also have capacity to increase equity exposure, however we are starting to get allocations back in line with historical levels. Equity exposure of 25% is back in line with 3 year averages, compared to 23% currently.
Risk Parity Exposure
Jan 2022 – July 2025
Source: Citadel Securities, as of 8/5/25. Figures are for illustrative purposes only. Past performance figures do not guarantee future results.
GMI | September Tactical Checklist
- Systematic positioning will likely reach full exposure by September, increasing vulnerability to downside shocks
- September has historically been the weakest month for the S&P 500 (based on data since 1928)
- Since 1990, volatility has historically trended higher during September – see chart below
- Citadel Securities’ retail equity and option franchise tend to see lower retail footprint during September
- Economically sensitive segments of the market may be particularly vulnerable to downside risks
- I am looking for a potential reversion lower in anti-momentum trades, particularly within high beta, lower quality, and thematic exposures as we discuss September downside trades
VIX August Monthly Performance
Since 1990
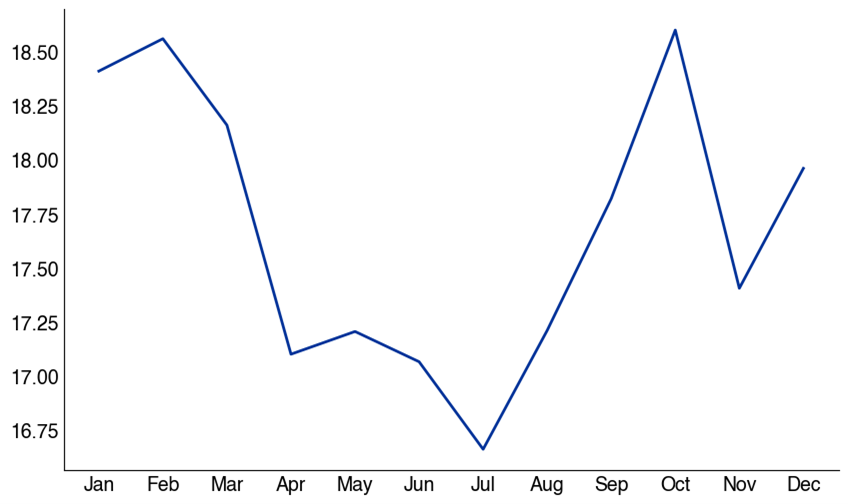
Source: Citadel Securities, as of 8/5/25. Figures are for illustrative purposes only. Past performance figures do not guarantee future results.Copyright © Citadel Enterprise Americas LLC or one of its affiliates. All rights reserved.
Legal Entities Disseminating this Material: This material is disseminated in the United Kingdom by Citadel Securities (Europe) Limited (“CDGE”) authorized and regulated by the Financial Conduct Authority (“FCA”) (Registered company number: 05462867); in the European Union by Citadel Securities GCS (Ireland) Limited (“CSGI”) and its Paris Branch authorized and regulated by the Central Bank of Ireland (“CBI”) (Registration Number: C173437); in Hong Kong by Citadel Securities (Hong Kong) Limited (“CDHK”) licensed by the Securities and Futures Commission of Hong Kong (“SFC”), in Japan by Citadel Securities Japan Co., Ltd (“CSJC”) registered as a Type 1 financial instruments business operator with the Japan Financial Services Agency (“JFSA”); and in the United States of America by Citadel Securities LLC (“CDRG”) registered with the Securities Exchange Commission (“SEC”), Financial Industry Regulatory Authority (“FINRA”), and Securities Investor Protection Corporation (“SIPC”), Citadel Securities Institutional LLC (“CSIN”) registered with the SEC, FINRA, and SIPC, or Citadel Securities Swap Dealer LLC (“CSSD”) registered with the SEC, Commodities Futures Trading Commission (“CFTC”), and National Futures Association (“NFA”). Unless governing law permits otherwise, you must contact a Citadel Securities entity in your home jurisdiction if you want to use our services in effecting a transaction in any financial instruments or securities, including derivatives.
FOR INSTITUTIONAL USE ONLY; FOR PROFESSIONAL CLIENTS AND ELIGIBLE COUNTERPARTIES ONLY. This material is not intended as and does not constitute investment research. Contents of this material will be strictly limited to non-specific, generic information (i.e. macro events/topics) and are not subject to the Markets in Financial Instruments directive (MiFID II) or FINRA research rules. This material does not constitute an offer, solicitation, invitation, or inducement to purchase, acquire, subscribe to, provide, or sell any financial instrument or otherwise engage in investment activity. Please see additional important disclosures, including disclosures that may be relevant to your country of residence or business at www.citadelsecurities.com/GlobalSalesTrading.
Explore
Market Insights - What We Do