By Scott Rubner
While near-term headline risks may continue to fuel volatility, the underlying equity market primary trend remains constructive. Strengthening corporate fundamentals should underpin the next leg higher as we enter a historically strong November.
📰 Stay mindful of positioning and exposure over the next two weeks, with equity market activity running above average. I’m closely monitoring non-fundamental, systematic equity supply and daily rebalancing as a potential driver of short-term dislocations.
📈 Options Activity: Retail’s Bullish Conviction Persists
- Friday, October 10th – marked the largest options trading day in market history, with over 108 million contracts traded — only the second time daily volume has topped 100 million (the first being April 4’s “Liberation Day,” when the SPX fell -6%). (Analysis: Citadel Securities’ Allie Becher.)
- Market-wide options flow ran 73% above the 3-month average, with Citadel Securities’ Retail volumes running exceptionally high. Retail’s bullish conviction remains extraordinary — this is the 24th consecutive week with a “better-to-buy” options skew, tying the longest bullish streak on record on our platform.
- Friday’s surge epitomized the “buy-the-dip” mentality. Retail flow skewed 11% better to buy via our Call/Put Direction ratio (vs. a 4% average over the past 3 months), marking the largest single-day call buying ever on our platform.
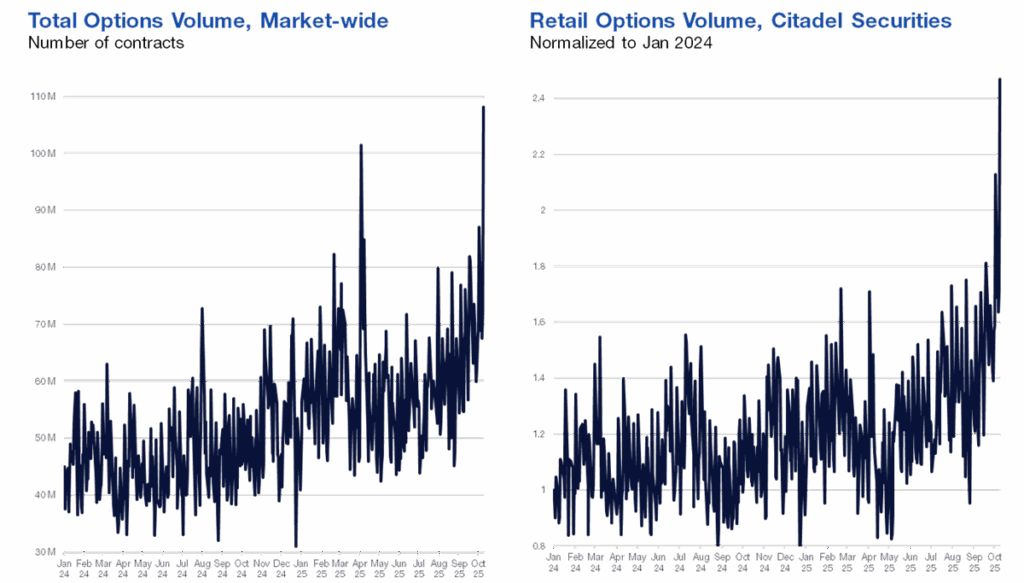
Source: Bloomberg as compiled by Citadel Securities, as of October 15th, 2025. Figures are for illustrative purposes only. Past performance figures do not guarantee future results.
📉 ‘Retail Is Still Buying the Dip’ – How Friday’s Selloff Compares to April
Contrary to market chatter, retail investors did not de-gross on Friday.
At Citadel Securities, we observed our retail flows:
- Net better-to-buy flows across cash, options, and ETFs — the second-highest gross activity day ever (after Jan 27, 2021).
- Within ETFs: +1.7 z-score to buy, concentrated in large-cap indices (S&P & Nasdaq). Reminder: 36 cents of every SPY dollar goes to the Mag 7.
- Within options: Retail +11% better to buy in calls vs. Institutional -23% better to buy in puts, underscoring a bullish retail vs. hedging institutional split.
Compared with April’s de-grossing episode (retail -6 z-score for sale on April 7), retail showed continued dip-buying resilience, even across China flows, which were mixed rather than skewed to sell.
Last week, Citadel Securities hosted its annual Future of Global Markets Conference, bringing together 350+ clients and thought leaders for two days of discussion on the key structural forces shaping today’s markets.
Here are three charts from our retail panel:
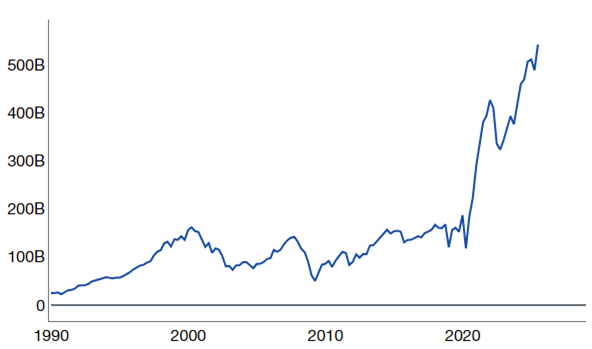
- Value of Equities Held by Under 40 years old (1990-present): Equity Value from households under 40 years old increased by 300% since 2020.
Source: Financial Accounts of the United States Z.1, Federal Reserve Board, as compiled by Citadel Securities, as of October 15th, 2025. Figures are for illustrative purposes only. Past performance figures do not guarantee future results.
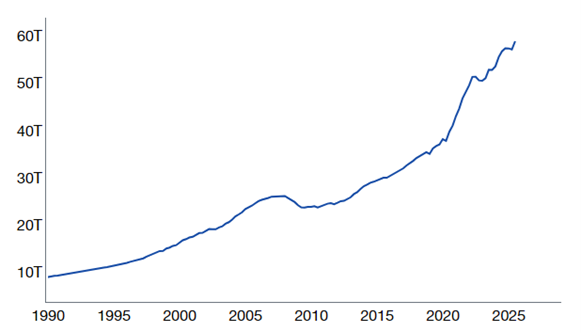
- Value of Equities Held by Final 50% of Households: Increased by 542% since 2020.
Source: Financial Accounts of the United States Z.1, Federal Reserve Board, as compiled by Citadel Securities, as of October 15th, 2025. Figures are for illustrative purposes only. Past performance figures do not guarantee future results.
- Value of Equities Held by Middle 40% (10-50%) of Households: Increased by 50% since 2020.
Source: Financial Accounts of the United States Z.1, Federal Reserve Board, as compiled by Citadel Securities, as of October 15th, 2025. Figures are for illustrative purposes only. Past performance figures do not guarantee future results.
Despite Friday’s pullback, the S&P 500 remains up nearly 30% over the past six months — marking its fifth-strongest six-month run since 1950. An orderly consolidation of recent gains would be a healthy development before a potential move higher into year-end.
It’s time for a thread🧵
I. Client Activity (Citadel Securities) |
Takeaway: Retail is buying micro ‘storybook’ names, while Institutions hedge macro exposure but remain benchmark long into Mutual Fund year-end (Oct 31).
- Retail Equities: Net buyers in 23 of last 26 weeks and 7-straight weeks
- Retail Options: 24-week net buying streak (a record)
- Retail ETFs: ETF buyers in 206 of 208 trading days
- Institutions: Hedging “macro” longs 8 of last 9 weeks
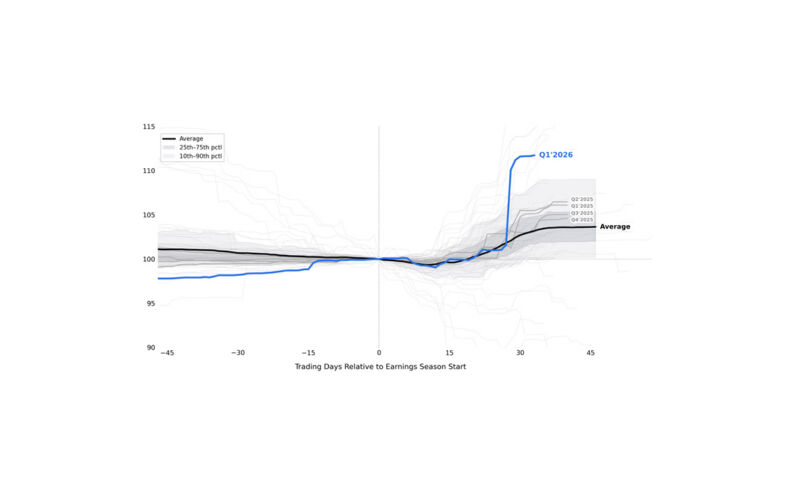
II. S&P Q3 Earnings Setup |
Earnings season kicks off this week, led by major banks 🏦
- Q2 recap: Consensus +5% YoY; delivered +11%, with 81% beating estimates
- Q3 setup: Bar is modestly higher; consensus +7.5% YoY
- SPX 3-month implied correlation remains low — a stock pickers’ market
- Options imply ~4.7% earnings-day move — the highest since 2022; Tech tops at ~5.9%
- There is a big spread between Index and Single Stock Skew
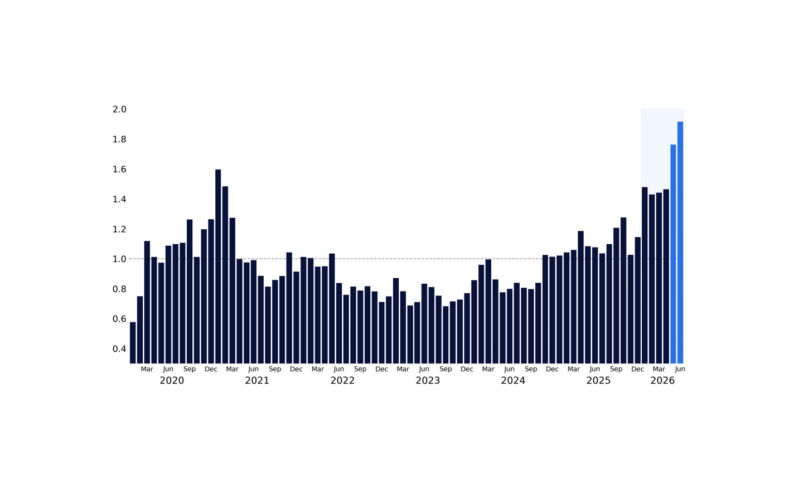
SPX EPS (% YoY)
Q4 2024 – Q3 2026
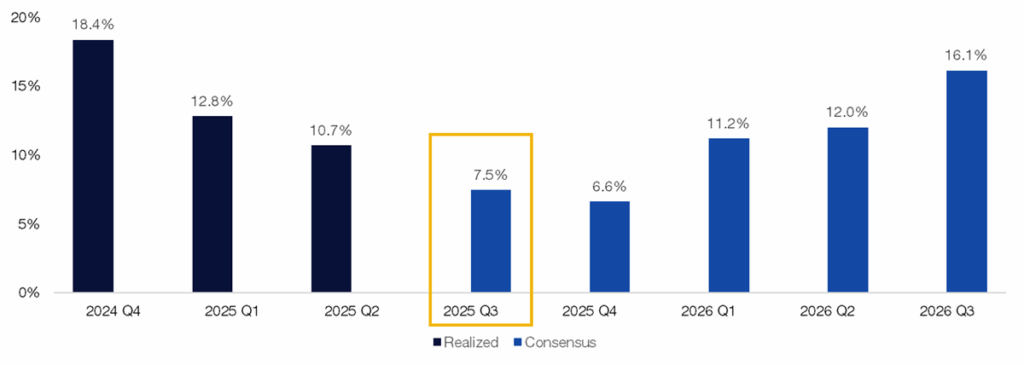
Source: Bloomberg as compiled by Citadel Securities, as of October 15th, 2025. Figures are for illustrative purposes only. Past performance figures do not guarantee future results.
SPX 3 Month Implied Correlation
January 2024 – October 2025
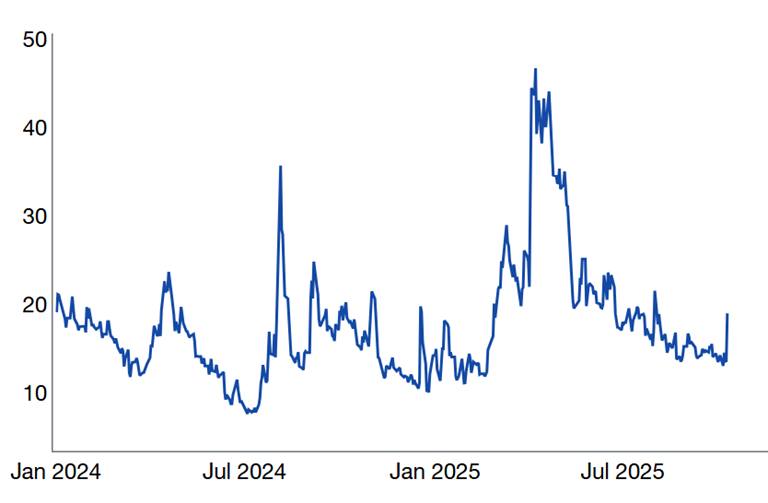
Source: Bloomberg as compiled by Citadel Securities, as of October 15th, 2025. Figures are for illustrative purposes only. Past performance figures do not guarantee future results.
III. Year-End Seasonality | Starting October 26 |
Takeaways from 100 Years of Data:
- October ranks among the choppiest months for equities
- On average, October 26th marks the Q4 low for the S&P 500, while October 27 marks the Q4 low for the Nasdaq 100. Happy Halloween 👻 🎃
- Late-October dips typically set up powerful year-end rallies
- Strong years heading into Q4, typically have stronger moves higher into year-end
S&P 500 Monthly Performance by Day
Since 1928
Source: Bloomberg as compiled by Citadel Securities, as of October 15th, 2025. Figures are for illustrative purposes only. Past performance figures do not guarantee future results.
S&P 500 Yearly Performance
Since 1928
Source: Bloomberg as compiled by Citadel Securities, as of October 15th, 2025. Figures are for illustrative purposes only. Past performance figures do not guarantee future results.
NDX Monthly Performance by Day
Since 1985
Source: Bloomberg as compiled by Citadel Securities, as of October 15th, 2025. Figures are for illustrative purposes only. Past performance figures do not guarantee future results.
NDX Yearly Performance
Since 1985
Source: Bloomberg as compiled by Citadel Securities, as of October 15th, 2025. Figures are for illustrative purposes only. Past performance figures do not guarantee future results.
IV. Retail Positioning — Persistent Strength |
1. Retail Demand: Citadel Securities’ Retail Equities clients: Net buyers in 23 of the last 26 weeks, and 7 straight weeks, rebounding after April weakness.
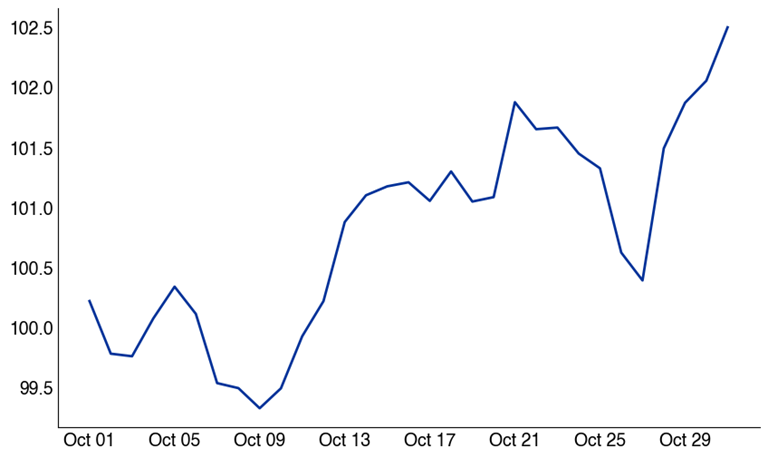
Retail Cash Equities – Net Notional by Week (Std Dev)
January – October 2025
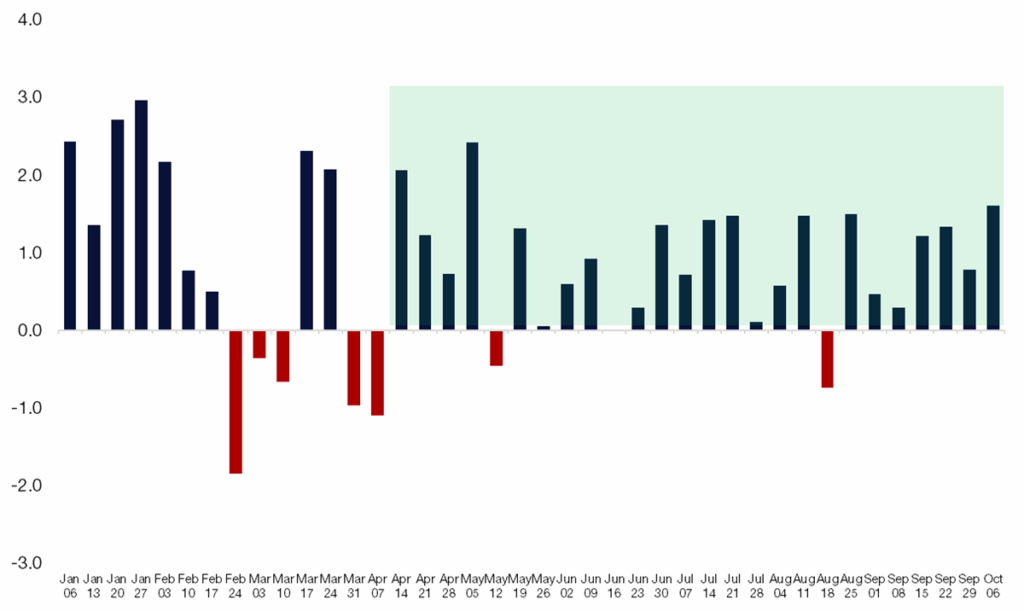
Source: Citadel Securities, as of October 15th, 2025. Figures are for illustrative purposes only. Past performance figures do not guarantee future results.
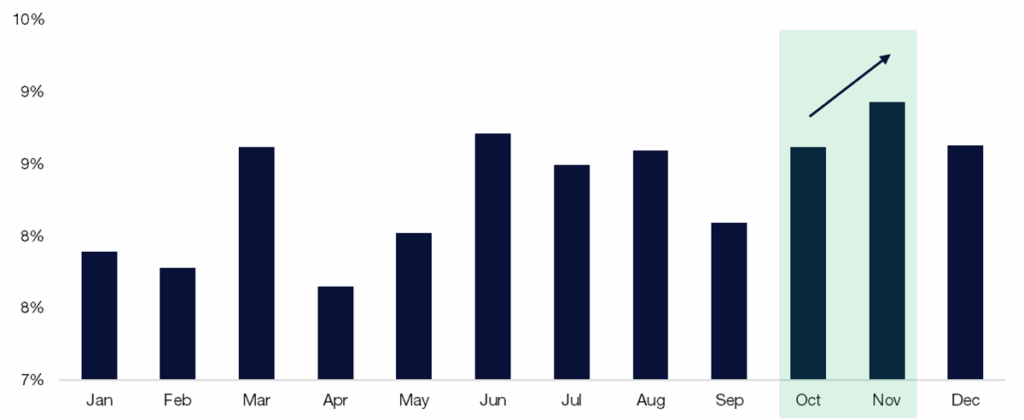
2. Citadel Securities’ Retail Equity client seasonal demand trends from the last 8 years: Sep weakest → Oct builds → Nov strongest
Retail Cash – Proportion of Net Notional by Month
August 1, 2017 – September 29, 2025
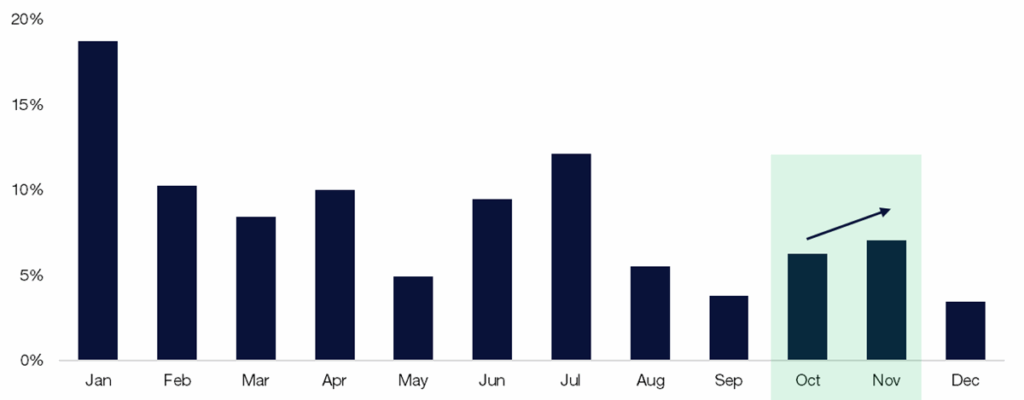
Source: Citadel Securities, as of October 15th, 2025. Figures are for illustrative purposes only. Past performance figures do not guarantee future results.
V. Volatility & Options Positioning |
3. Citadel Securities’ Retail Options client bullish streak watch
- Retail options demand: 24 straight weeks 🐂
- This ties the longest streak on record for our platform
- Largest single day worth of activity on record for our platform
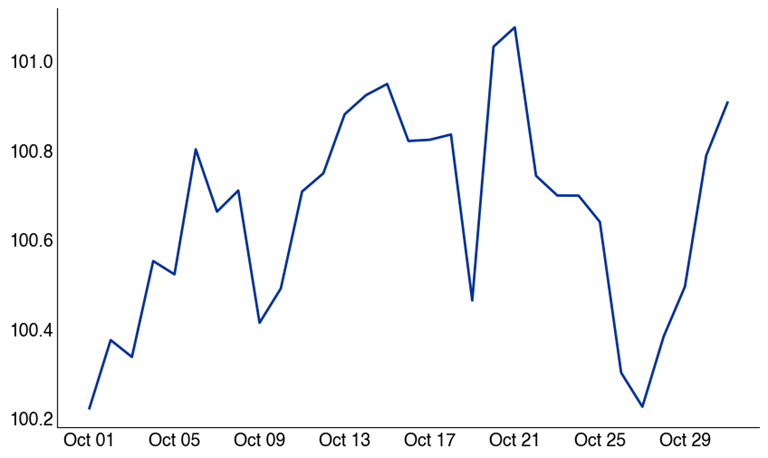
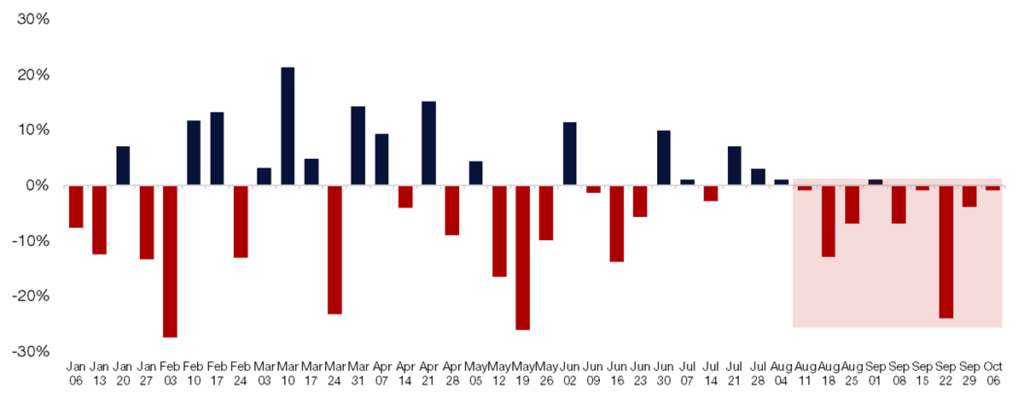
Retail Options – Call / Put Direction Ratio by Week (%)
January – October 2025
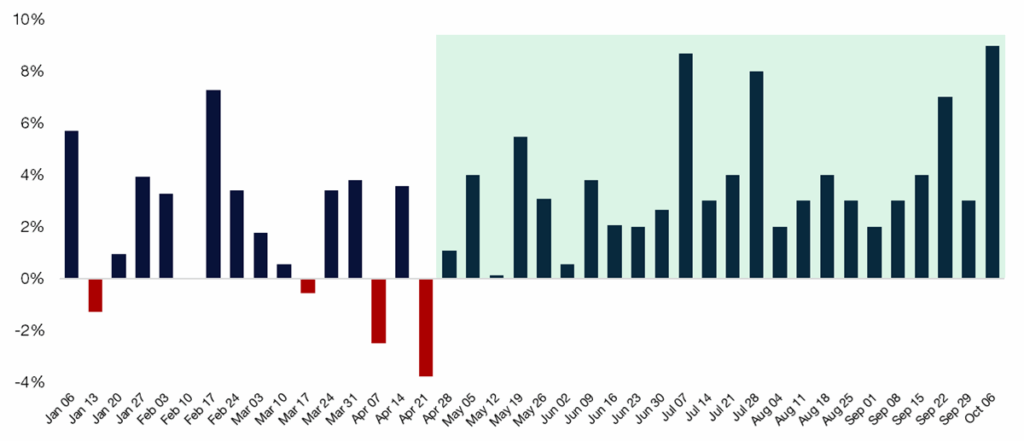
Source: Citadel Securities, as of October 15th, 2025. Figures are for illustrative purposes only. Past performance figures do not guarantee future results.
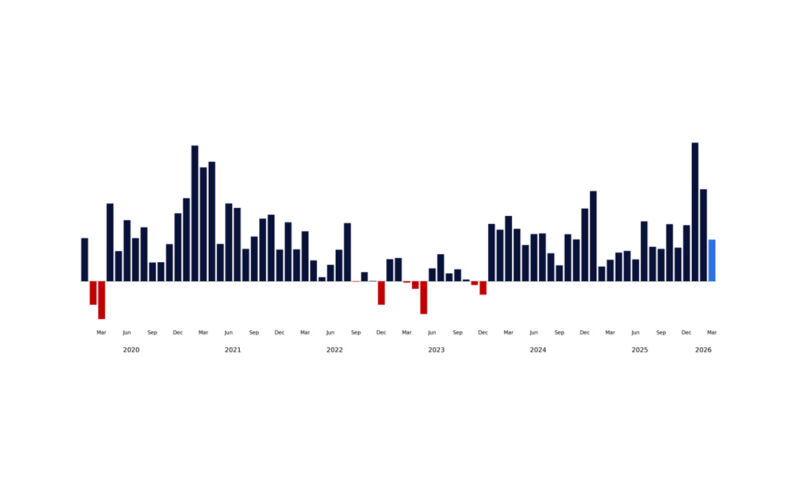
4. Longest Retail Weekly Option Buying Streaks on Record, since 2020.
Starting month, # of weeks
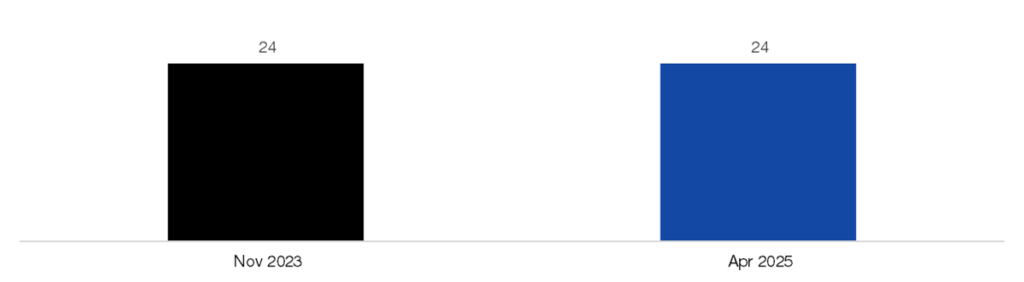
Source: Citadel Securities, as of October 15th, 2025. Figures are for illustrative purposes only. Past performance figures do not guarantee future results.
5. Retail Option acceleration in Q4
Citadel Securities’ Retail Options client volume typically wanes in September before rebounding into the final quarter of the calendar year. Activity picks back up in Q4, with November the strongest month of the year.
Retail Options – Proportion of Contract Volume by Month
January 2020 – December 2024
Source: Citadel Securities, as of October 15th, 2025. Figures are for illustrative purposes only. Past performance figures do not guarantee future results.
6. Citadel Securities’ Institutional Options clients turned to hedging demand
- Bearish in 8 of the last 9 weeks
- Implied volatility has reset lower – hedges are attractive while staying in long positions
- FOMU– “fear of material underperformance” to benchmark indices has accelerated and kept longs in play given consecutive moves in the largest cap equities
- Our macro client base is looking to fade the move higher in the lowest quality segments of the market
Institutional Options — Call/Put Direction Ratio by Week (Bearish Flows)
January – October 2025
Source: Citadel Securities, as of October 14th, 2025. Figures are for illustrative purposes only. Past performance figures do not guarantee future results.
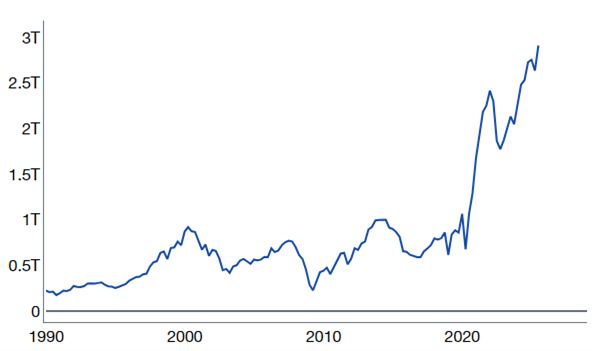
VI. Peak Corporate Blackout Window |
- Today markets the PEAK blackout window. Blackout typically begins ~2 weeks before quarter-end and ends a day or two after Q3 earnings. August saw strong executions during the open window.
- EventVestor: U.S. authorizations have surpassed $1.297T (fastest pace on record) for Russell 3000; could reach $1.5T by year-end. Assuming a 90% execution rate means $1.35T actual executions (a record). S&P 500 companies have seen $1.064T authorizations YTD. Keep an eye on this dynamic after reported Q3 results.
- Buyback math: ~$1.35T of VWAP executions over 251 trading days ≈ $5.3B of implied daily buyback demand.
- Nov–Dec are historically the strongest buyback execution months for U.S. corporates. I expect corporates to fill their authorizations by end of 2025. Blackout window ends on November 1st.
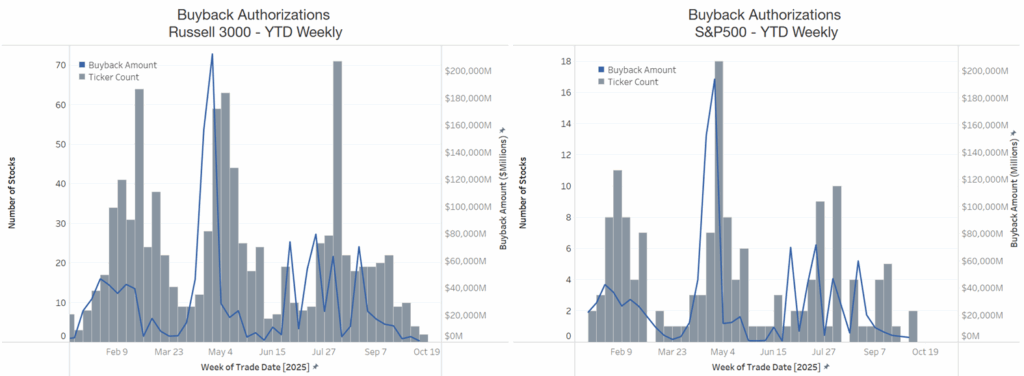
Source: EventVestor as compiled by Citadel Securities, as of October 15th, 2025. Figures are for illustrative purposes only. Past performance figures do not guarantee future results.
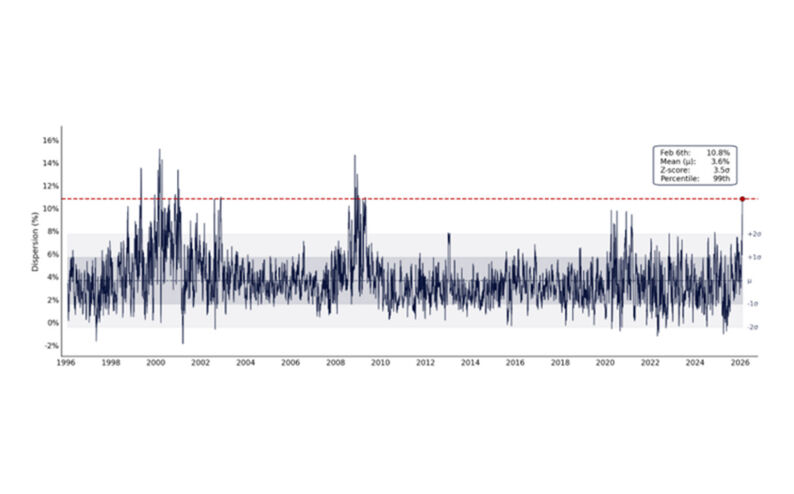
VII. Volatility Dynamics – Friday’s Event |
- Hedge funds / large specs were extremely short VIX, heading into Friday
- Observation: Crowded short volatility trade = asymmetric risk if shocks emerge (this happened last Friday).
- Client Feedback from Monday: Re-establish vol selling strategies
CFTC VIX Consolidated % Long
January 2024 – Oct 2025
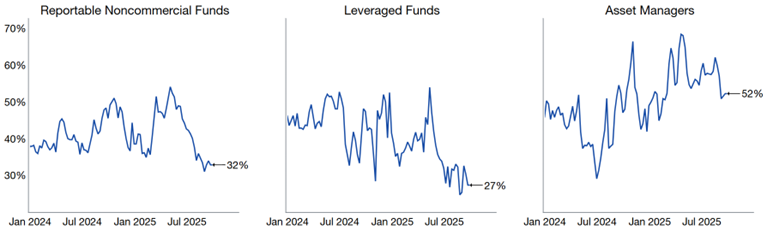
Source: COT report, as compiled by Citadel Securities, as of October 14th, 2025. Figures are for illustrative purposes only. Past performance figures do not guarantee future results.
VIII. Systematic Positioning — Full but Fragile |
7. CTA/Trend following and Trigger Levels
Citadel Securities’ estimates that equity trend signals are getting weaker from here (+.4 to .+15) z-scores, suggesting orderly reduction in exposure to slightly long in medium term strategies.
US Equity CTA Signals (Z-score)
January 2024 – Sep 2025
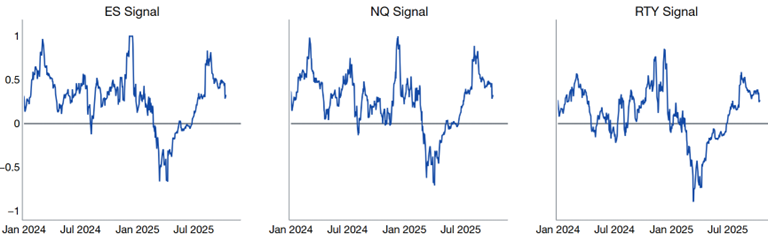
Source: Citadel Securities, as of October 14th, 2025. Figures are for illustrative purposes only. Past performance figures do not guarantee future results.
Trigger / Threshold Levels:
We are watching 6494 as the big medium term threshold level which flips CTAs from long to short. We are currently above this level right now.
US Equity CTA Signals (Z-score)
January 2024 – Sep 2025
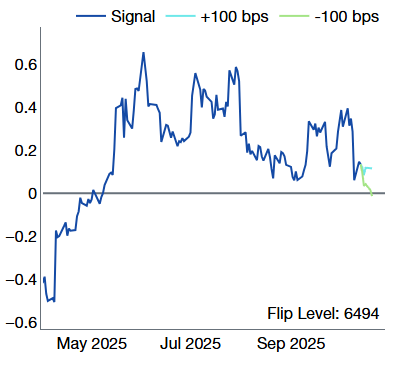
Source: Citadel Securities, as of October 14th, 2025. Figures are for illustrative purposes only. Past performance figures do not guarantee future results.
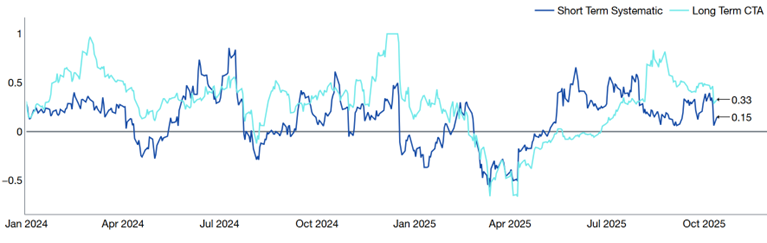
8. Systematic Thresholds in SPX
- Short-term threshold signal continues to weaken (we would have tripped this wire if we didn’t bounce on Monday)
- Long-term threshold signal is back at neutral – this is a big signal, weaker but holding for now.
CTA ES1: Short-term and long-term signals (z-score)
January 2024 – October 2025
Source: Citadel Securities, as of October 14th, 2025. Figures are for illustrative purposes only. Past performance figures do not guarantee future results.
9. Vol-Control strategies – Potential Large Lagged Supply.
Theme Watch: Escalator Up, Elevator Down?
Vol Control strategies which take cues from the realized volatility market – have already increased exposure substantially. This is one of the sharpest rebounds in equity exposure we’ve seen.
No incremental demand from Vol-Control given the recent increase in volatility. There is a lot of chatter of supply from this cohort in the marketplace. Vol-Control are typically slower to act, but we are watching realized volatility pick up for any signs of de-risking.
Vol Target Exposure with 5%, 10%, 15%, Risk Control
Exposure Rank since 2020
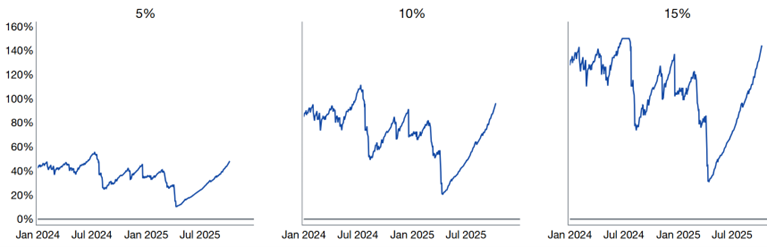
Source: Bloomberg as compiled by Citadel Securities, as of October 14th, 2025. Figures are for illustrative purposes only. Past performance figures do not guarantee future results.
10. Risk Parity strategies
Allocation Change WoW: (-ES, +TY, +CL, +GC)
Risk Parity strategies are driven by lower cross-asset volatility – now hold equity exposure near their 3-year average of 25% exposure.
Systematic positioning remains elevated, but no unwind trigger. Positioning is fragile: shallow pullbacks risk turning into larger drawdowns.
Risk Parity Exposure
Jan 2022 – October 2025
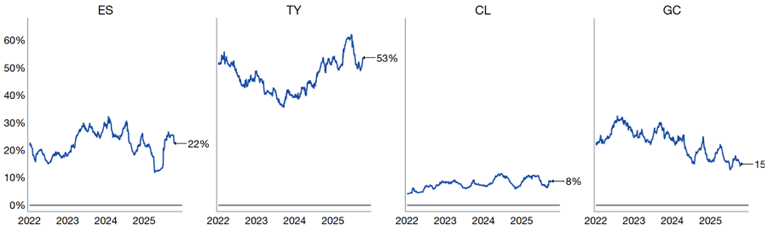
Source: Citadel Securities, as of October 14th, 2025. Figures are for illustrative purposes only. Past performance figures do not guarantee future results.
11. Sentiment and Asset Allocations:
AAII Equity Asset Allocation (%)
January 2024 – October 2025
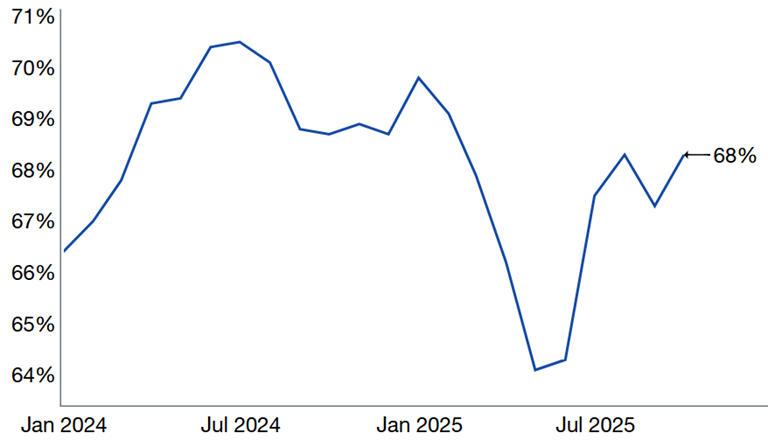
Source: AAII, as reported by Bloomberg and compiled by Citadel Securities, as of October 14th, 2025. Figures are for illustrative purposes only. Past performance figures do not guarantee future results.
AAII Bull – AAII Bear Spread, saw a rebound this week, but remains in neutral territory.
January 2024 – October 2025
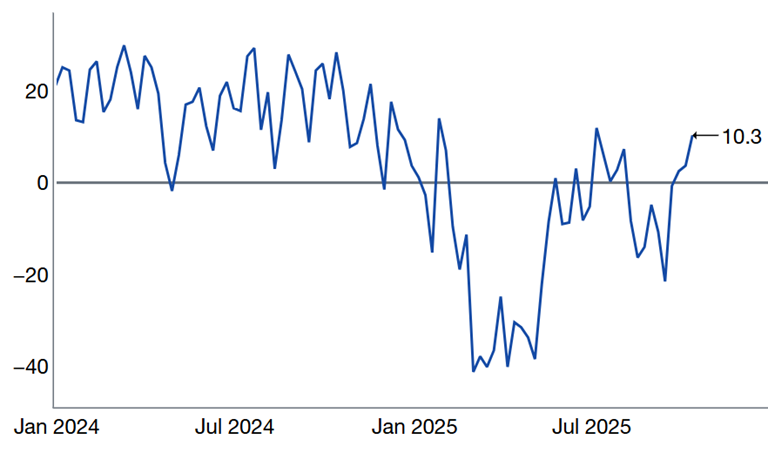
Source: AAII, as reported by Bloomberg and compiled by Citadel Securities, as of September 29th, 2025. Figures are for illustrative purposes only. Past performance figures do not guarantee future results.
Takeaway: If markets slip, systematic flows could exacerbate drawdowns.
GMI October Takeaways ✅ |
📌 Theme: Structural Bull; Tactical October Fragility Persists
- Structural Bull: Retail demand, buybacks, passive inflows, and AI themes remain supportive
- Tactical Risk: October fragility; hedge crowded names into earnings, headline risks
- Forward View: Year-end FOMO rally likely; treat 2H October dips as buy opportunities
- Rotation Watch: 493 stocks, EM, Value, and International sectors could see catch-up flows
- Anti-momentum in November and December: Laggards outperform after Mutual fund Year-end
Copyright © Citadel Enterprise Americas LLC or one of its affiliates. All rights reserved.
Legal Entities Disseminating this Material: This material is disseminated in the United Kingdom by Citadel Securities (Europe) Limited (“CDGE”) authorized and regulated by the Financial Conduct Authority (“FCA”) (Registered company number: 05462867); in the European Union by Citadel Securities GCS (Ireland) Limited (“CSGI”) and its Paris Branch authorized and regulated by the Central Bank of Ireland (“CBI”) (Registration Number: C173437); in Hong Kong by Citadel Securities (Hong Kong) Limited (“CDHK”) licensed by the Securities and Futures Commission of Hong Kong (“SFC”), in Japan by Citadel Securities Japan Co., Ltd (“CSJC”) registered as a Type 1 financial instruments business operator with the Japan Financial Services Agency (“JFSA”); and in the United States of America by Citadel Securities LLC (“CDRG”) registered with the Securities Exchange Commission (“SEC”), Financial Industry Regulatory Authority (“FINRA”), and Securities Investor Protection Corporation (“SIPC”), Citadel Securities Institutional LLC (“CSIN”) registered with the SEC, FINRA, and SIPC, or Citadel Securities Swap Dealer LLC (“CSSD”) registered with the SEC, Commodities Futures Trading Commission (“CFTC”), and National Futures Association (“NFA”). Unless governing law permits otherwise, you must contact a Citadel Securities entity in your home jurisdiction if you want to use our services in effecting a transaction in any financial instruments or securities, including derivatives.
FOR INSTITUTIONAL USE ONLY; FOR PROFESSIONAL CLIENTS AND ELIGIBLE COUNTERPARTIES ONLY. This material is not intended as and does not constitute investment research. Contents of this material will be strictly limited to non-specific, generic information (i.e. macro events/topics) and are not subject to the Markets in Financial Instruments directive (MiFID II) or FINRA research rules. This material does not constitute an offer, solicitation, invitation, or inducement to purchase, acquire, subscribe to, provide, or sell any financial instrument or otherwise engage in investment activity. Please see additional important disclosures, including disclosures that may be relevant to your country of residence or business at www.citadelsecurities.com/GlobalSalesTrading.