-
Who We Are
- What We Do
Series: Global Market Intelligence2026 – Q1 Outlook
By Scott Rubner
The U.S. economy enters 2026 with resilient growth, broadening profit drivers, and a policy mix that remains supportive of risk assets. Market structure has normalized further, liquidity conditions are steadier, and cross-asset flows suggest investors are positioning for a more durable expansionary phase.
Retail investors remain central to this dynamic. Following a year of strong portfolio returns and record household wealth, retail participants enter 2026 with both conviction and balance-sheet capacity to increase market participation. As leaders in retail trading, we continue to observe expanding retail market share and expect retail to remain a decisive contributor to liquidity and price discovery in the year ahead.
Against this constructive macro landscape, five main pillars will shape early-2026 market behavior.
My framework for Q1 is anchored by 5 factors: (2 R’s and 3 P’s)
- Retail
- Rotation
- Profits
- Policy
- Positioning
It is time for a thread.
🧵
I. Retail: A Structural Force
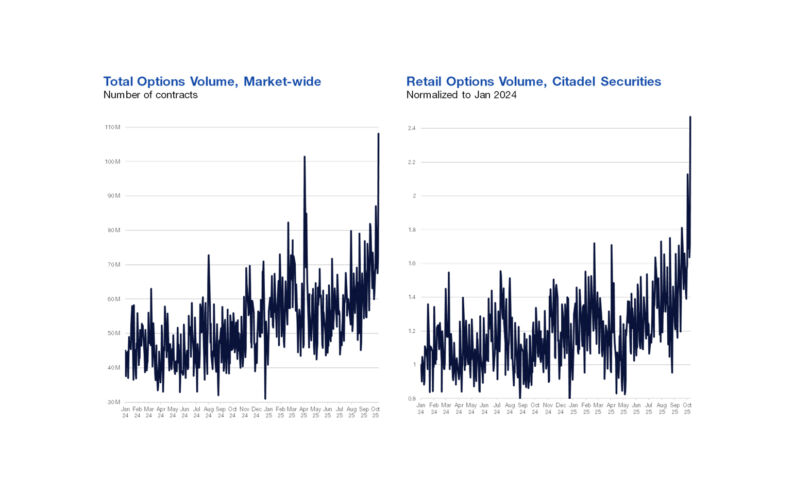
Retail participation is structurally higher and poised to remain so into 2026. Elevated engagement, rising household wealth, broader equity adoption, and historically high cash balances together create one of the strongest retail backdrops of the past decade. Seasonally, retail participation tends to rise into year-end as liquidity thins – amplifying its market impact.
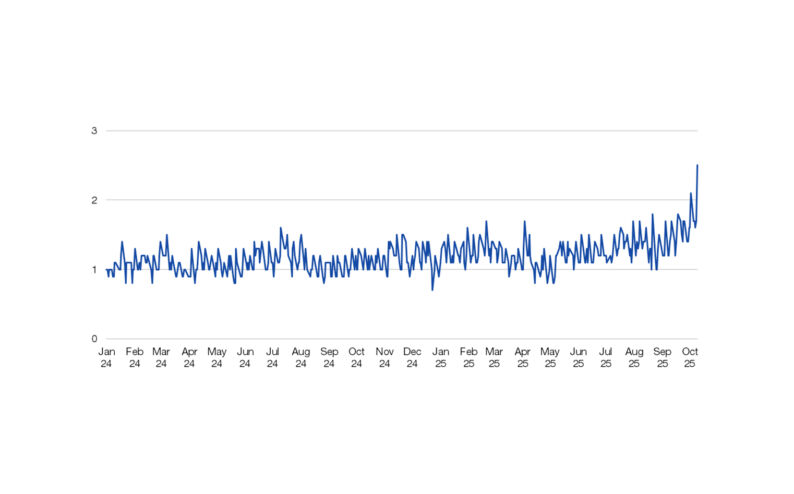
Retail Cash – Proportion of Industry Volume by Month
January 2018 – December 2025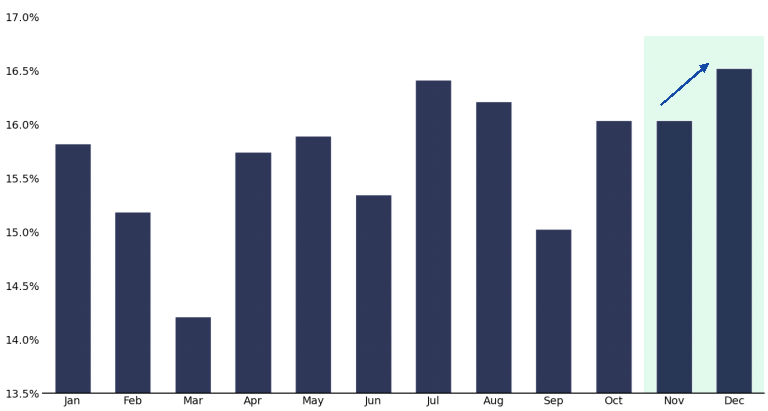
Source: Bloomberg as compiled by Citadel Securities, GMI, as of December 18th, 2025. Figures are for illustrative purposes only. Past performance figures do not guarantee future results.
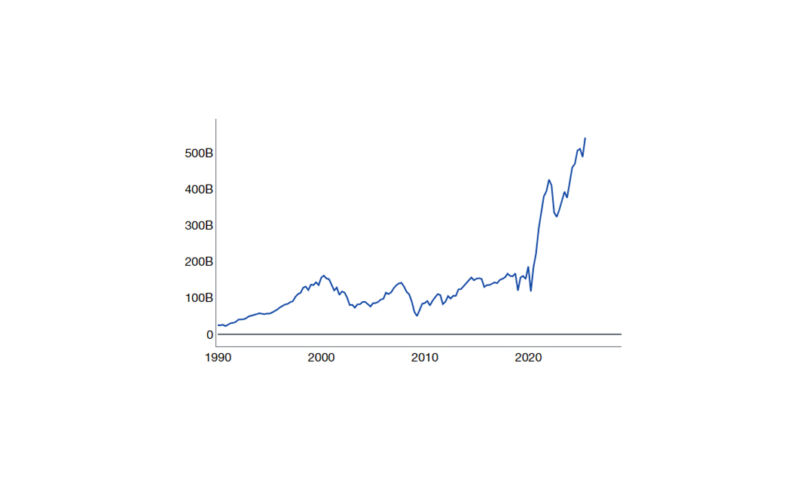
The balance-sheet backdrop is compelling. Total household wealth stands at record highs across all percentile groups. Notably, the bottom 50% – historically the least engaged in equities – has experienced the fastest rate of wealth accumulation and now holds more than $4 trillion in net worth. Indexed wealth data highlights a decade-long expansion of the retail wallet: since 2010, percentage wealth growth for the bottom half has far outpaced higher-wealth cohorts.
Household Wealth by Percentile Group
Since 1990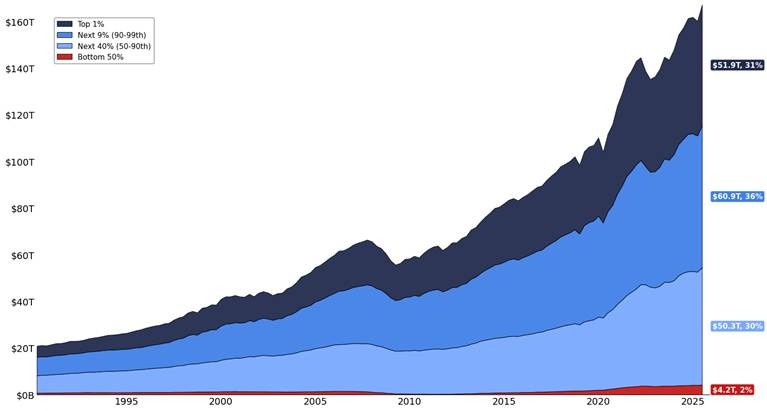
Source: Federal Reserve Bank, Financial Accounts of the United States – Z.1, as compiled by Citadel Securities, GMI, as of December 18th, 2025. Figures are for illustrative purposes only. Past performance figures do not guarantee future results.
Household Wealth: Bottom 50%
Since 1990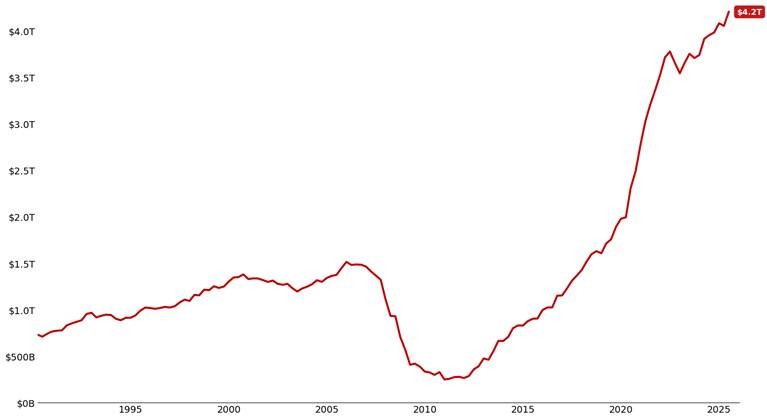
Source: Federal Reserve Bank, Financial Accounts of the United States – Z.1, as compiled by Citadel Securities, GMI, as of December 18th, 2025. Figures are for illustrative purposes only. Past performance figures do not guarantee future results.
Household Wealth by Percentile Group
Since 2010, Indexed to 100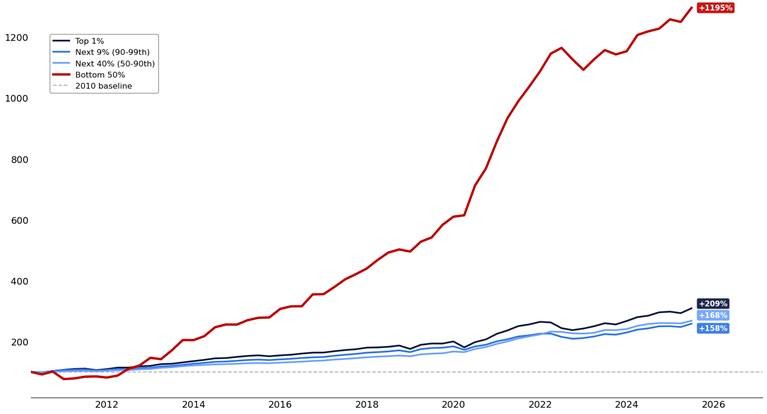
Source: Federal Reserve Bank, Financial Accounts of the United States – Z.1, as compiled by Citadel Securities, GMI, as of December 18th, 2025. Figures are for illustrative purposes only. Past performance figures do not guarantee future results.
This wealth accumulation has translated directly into equity ownership. All percentile groups now hold more equities, with the steepest gains again coming from the bottom 50.
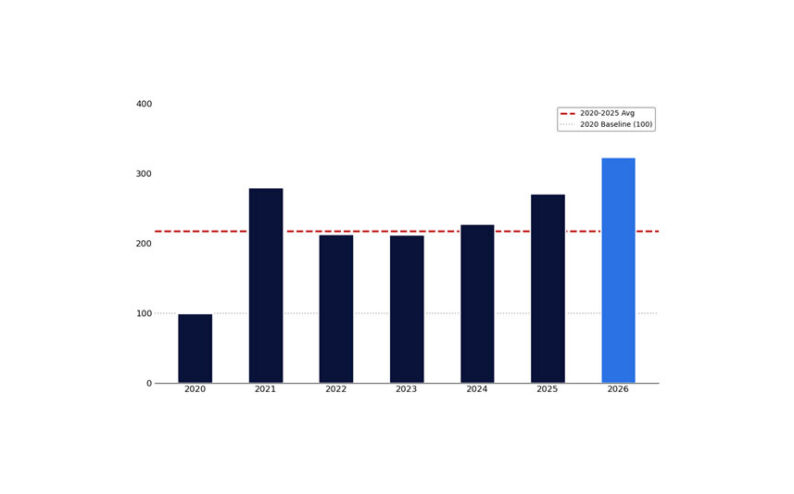
Participation is also broadening across generations. Households under 40 have increased equity and fund ownership by more than 300% since 2020, reinforcing the structural shift toward retail-led markets.
Household Ownership of Equities and Mutual Funds by Percentile Group
Since 1990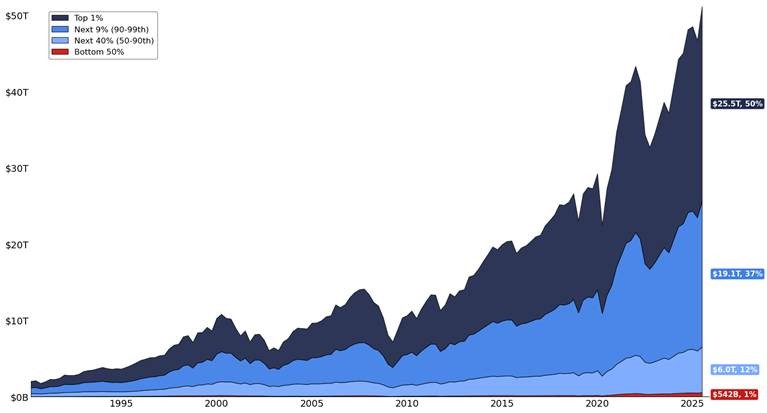
Source: Federal Reserve Bank, Financial Accounts of the United States – Z.1, as compiled by Citadel Securities, GMI, as of December 18th, 2025. Figures are for illustrative purposes only. Past performance figures do not guarantee future results.
Household Ownership of Equities and Mutual Funds: Bottom 50%
Since 1990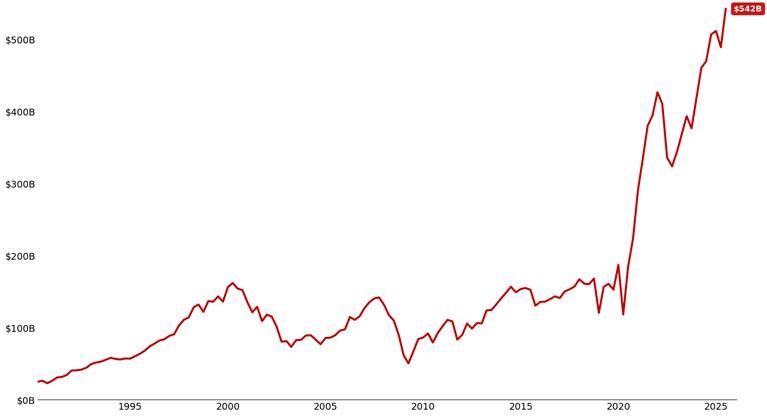
Source: Federal Reserve Bank, Financial Accounts of the United States – Z.1, as compiled by Citadel Securities, GMI, as of December 18th, 2025. Figures are for illustrative purposes only. Past performance figures do not guarantee future results.
Household Ownership of Equities and Mutual Funds by Percentile Group
Since 2010, Indexed to 100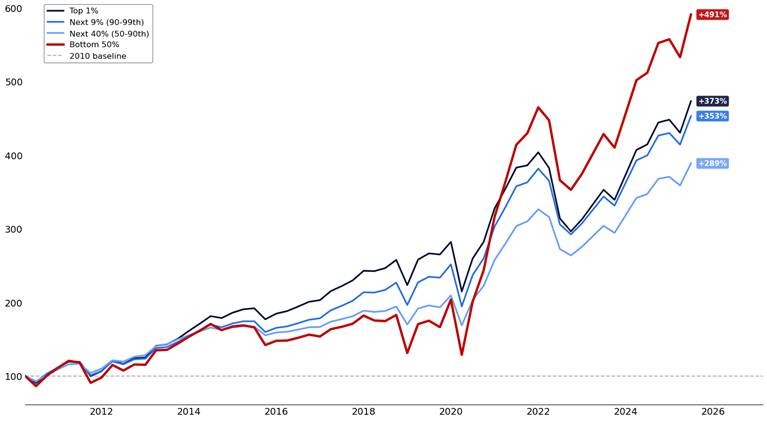
Source: Federal Reserve Bank, Financial Accounts of the United States – Z.1, as compiled by Citadel Securities, GMI, as of December 18th, 2025. Figures are for illustrative purposes only. Past performance figures do not guarantee future results.
Household Ownership of Equities and Mutual Funds by Age Group
Since 1990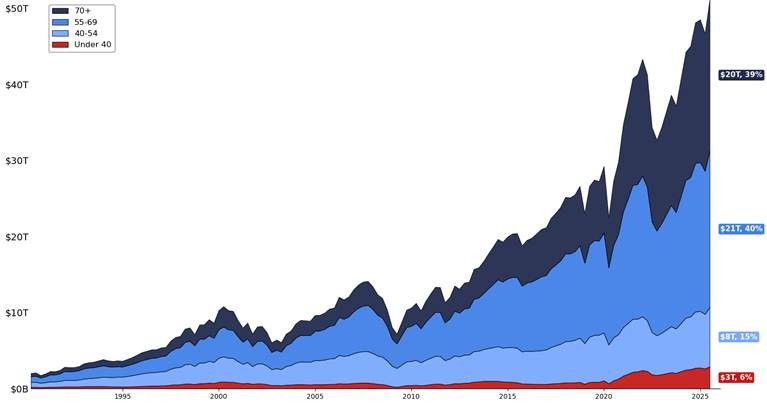
Source: Federal Reserve Bank, Financial Accounts of the United States – Z.1, as compiled by Citadel Securities, GMI, as of December 18th, 2025. Figures are for illustrative purposes only. Past performance figures do not guarantee future results.
Household Ownership of Equities and Mutual Funds by Age Group
Since 2020, Indexed to 100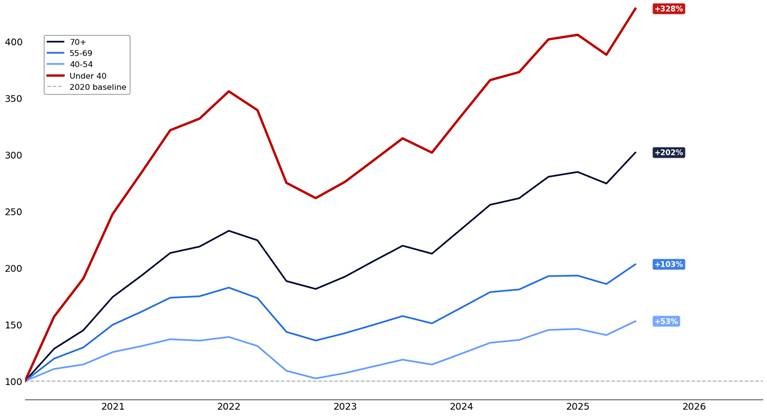
Source: Federal Reserve Bank, Financial Accounts of the United States – Z.1, as compiled by Citadel Securities, GMI, as of December 18th, 2025. Figures are for illustrative purposes only. Past performance figures do not guarantee future results.
Despite this increased engagement, households continue to hold near-record cash balances (98th percentile historically), leaving substantial dry powder should confidence and risk appetite continue to improve. We see this “buy-the-dip” behavior, every day in our data at Citadel Securities.
Household Cash as Percent of Total Financial Assets
Since 1990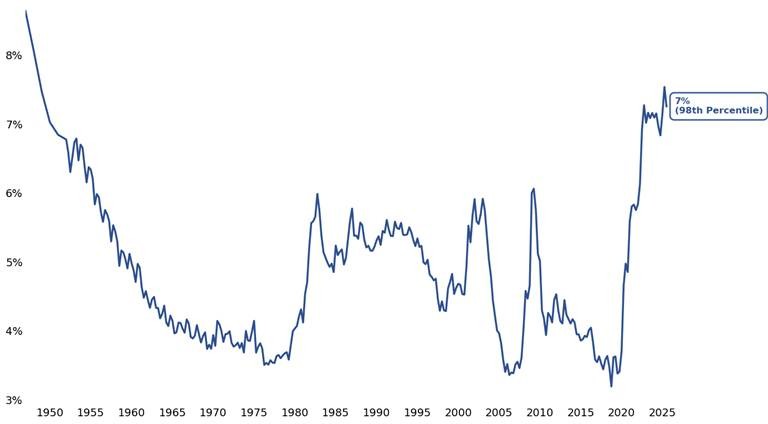
Source: Federal Reserve Bank, Financial Accounts of the United States – Z.1, as compiled by Citadel Securities, GMI, as of December 18th, 2025. Figures are for illustrative purposes only. Past performance figures do not guarantee future results.
II. Rotation: Broadening Market Leadership
Market leadership is clearly broadening. After years of concentration, Q4 delivered a meaningful shift toward diversified participation – a constructive signal heading into 2026. Small caps have broken out to new highs, reflecting easing financial conditions and rising earnings leverage. Equal-weight benchmarks confirm this shift, with the equal-weight S&P 500 reaching new highs as participation extends beyond mega-cap technology.
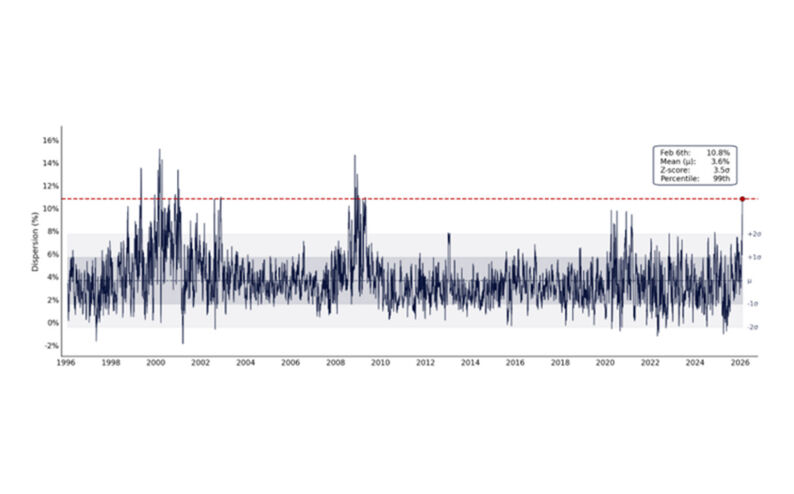
Despite this progress, dispersion remains elevated. The performance ratio of SPW versus SPX sits in the 15th percentile over the past yer and the 3rd percentile on a five-year basis, suggesting ample runway for continued rotation.
SPW vs. SPX Performance
Five Year Lookback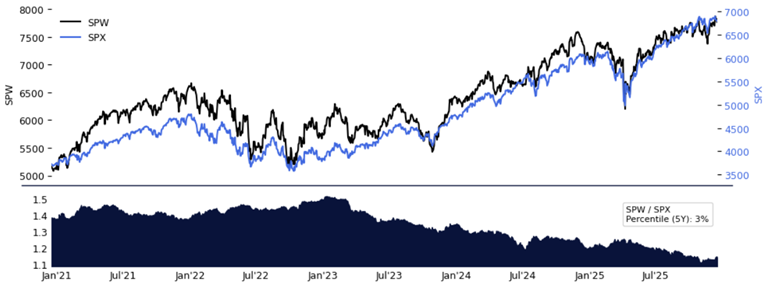
Source: Bloomberg as compiled by Citadel Securities, GMI, as of December 18th, 2025. Figures are for illustrative purposes only. Past performance figures do not guarantee future results.
Rotation is not limited to equities. Precious and industrial metals – gold, silver, and copper – have reached new all-time highs, while platinum trades at its strongest levels since 2008. Sector-level market capitalization also highlights catch-up potential, particularly in energy and industrials, where relative weights remain depressed despite improving fundamentals.
SPX Weightings by Sector
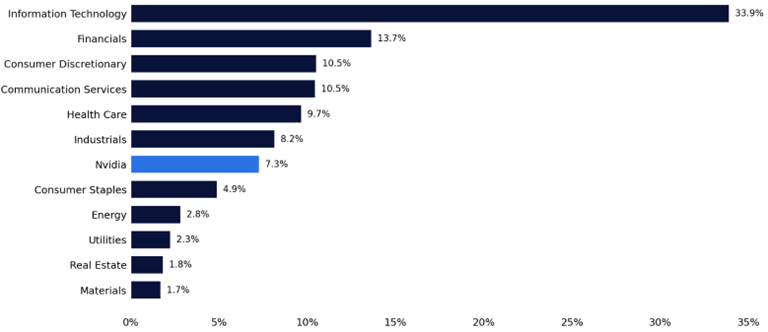
Source: Bloomberg as compiled by Citadel Securities, GMI, as of December 18th, 2025. Figures are for illustrative purposes only. Past performance figures do not guarantee future results.
If you allocate $1 into the SPX ETF, 39 cents goes into the top-10 holdings. I expect the rest of the basket to increase market capitalization in 2026.
SPX – Weighting of Top 10 Holdings
Weekly, 1995-2025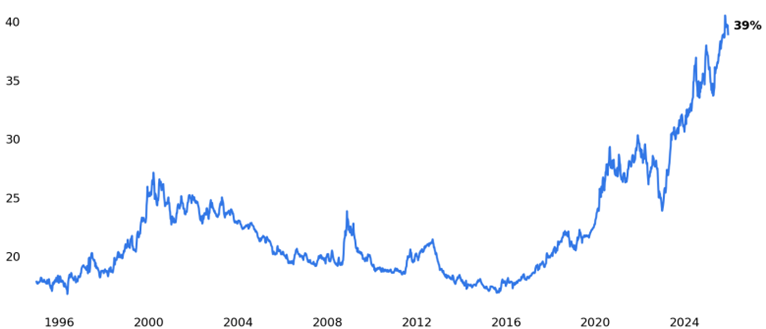
Source: Bloomberg as compiled by Citadel Securities, GMI, as of December 18th, 2025. Figures are for illustrative purposes only. Past performance figures do not guarantee future results.
SPX Sectors – Recent Rotation Away from Prior Leaders
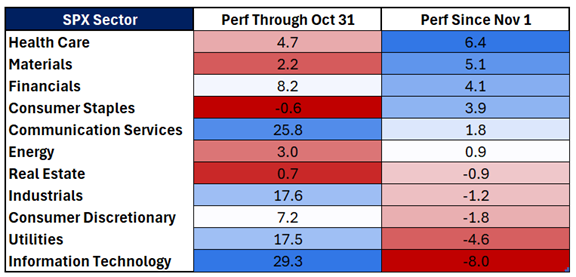
Source: Bloomberg as compiled by Citadel Securities, GMI, as of December 18th, 2025. Figures are for illustrative purposes only. Past performance figures do not guarantee future results.
III. Policy: Turning from Drag to Tailwind
I spoke to Frank Flight, Citadel Securities Macro Strategist, on the policy outlook. He shared that the turn of the year marks an important inflection in policy. Tariff-related uncertainty is fading, while the fiscal impulse is set to flip from a meaningful drag in Q4 (approximately -0.6% of GDP) to a tailwind in early 2026 (+0.5% to +0.9% of GDP) as the One, Big, Beautiful Bill Act, impulse takes effect.
A key feature is front-loaded stimulus from retroactive personal income tax cuts, with U.S. households expected to receive roughly $80 billion in refunds in Q1 2026 – a development likely to carry a high economic multiplier. This may lead to higher retail equity trading activity.
Monetary policy adds further support. The lagged effects of 175bp of Fed rate cuts over the past 18 months continue to ease financial conditions, contributing an estimated +0.5% to quarterly annualized growth through much of 2026.
Risks to policy stimulus appear skewed to the upside. Additional tariff relief or targeted household transfers – such as potential stimulus payments tied to tariff offsets – could add meaningfully to aggregate demand. For example, a $2,000 transfer to households earning under $75k would amount to roughly $150 billion in additional fiscal support.
Source: Bloomberg as compiled by Citadel Securities as of December 18th, 2025. Figures are for illustrative purposes only. Past performance figures do not guarantee future results.
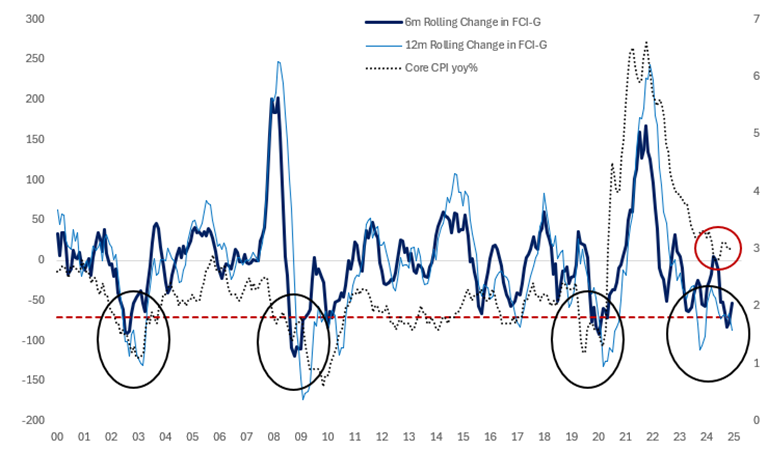
Labor market concerns remain a key client focus. However, forward-looking indicators suggest normalization rather than deterioration. Private payroll growth is rebounding after smoothing through monthly noise and government shutdown effects, layoffs remain historically low, and initial claims continue to signal stability. Survey-based indicators – including NFIB hiring plans and BLS diffusion indices – point to hiring consistent with a steady or declining unemployment rate into 2026.
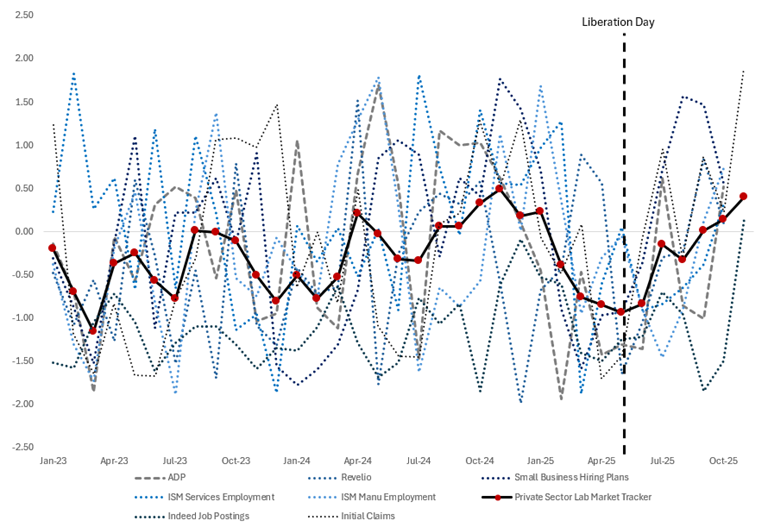
Source: Bloomberg as compiled by Citadel Securities as of December 18th, 2025. Figures are for illustrative purposes only. Past performance figures do not guarantee future results.
IV. Profits: Earnings Diffusion Continues
Earnings momentum is broadening beyond a narrow group of mega-cap leaders. What began as an AI-led profit cycle is increasingly diffusing across sectors, reinforcing market breadth and supporting a more durable earnings expansion.
The S&P 500 is currently delivering approximately 13% year-over-year earnings growth, underpinned by the largest technology investment cycle since the internet era. Annual technology capital expenditures now exceed $700 billion, providing a multi-year tailwind to productivity and margins.
SPX EPS (% YoY)
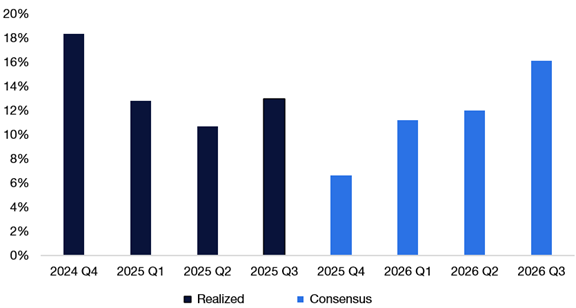
Source: Bloomberg as compiled by Citadel Securities as of December 18th, 2025. Figures are for illustrative purposes only. Past performance figures do not guarantee future results.
As AI adoption widens, productivity gains are becoming more visible – supporting real growth and offering upside to corporate profitability over time into the “other 493 equities”.
V. Positioning: Still Room to Add Risk
From our vantage point as a leading provider of market liquidity, overall institutional positioning remains light. Retail investors continue to provide consistent demand, while institutional exposure is still rebuilding. This institutional dynamic may change in January when the scoreboard gets reset to 0-0.
Retail investors have been net buyers of calls in 32 of the past 33 weeks, representing the strongest sustained buying streak in our dataset. Institutions also turned net buyers of calls recently, with Real Estate, Healthcare, and Industrials showing the strongest buy skews for a second consecutive week.
Retail Options – Put / Call Direction Ratio by Week
January – December 2025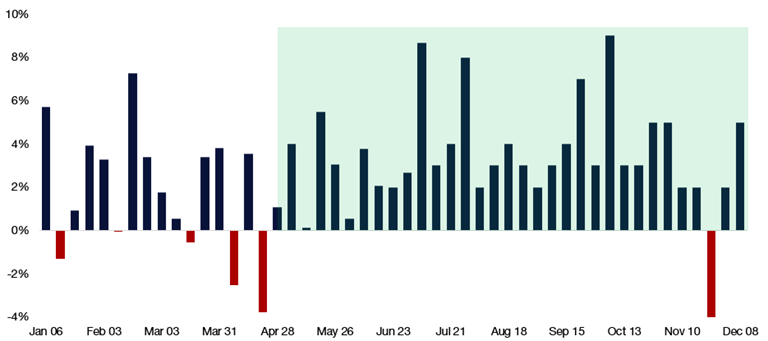
Source: Bloomberg as compiled by Citadel Securities, GMI, as of December 18th, 2025. Figures are for illustrative purposes only. Past performance figures do not guarantee future results.
Institutional Options – Put / Call Direction Ratio by Week
January – December 2025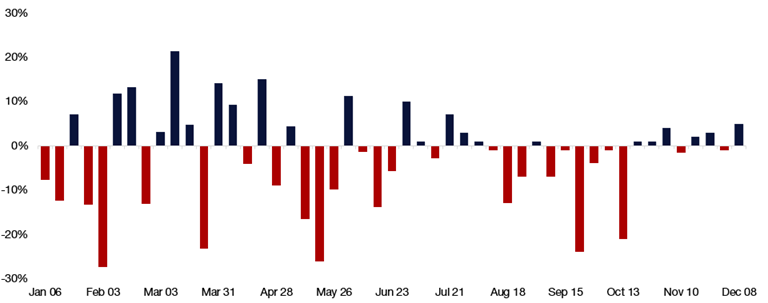
Source: Bloomberg as compiled by Citadel Securities, GMI, as of December 18th, 2025. Figures are for illustrative purposes only. Past performance figures do not guarantee future results.
Near-term dynamics warrant attention. A record $7.1 trillion in U.S. options notional is set to expire during December triple witching – nearly 30% of total U.S. options exposure – raising the potential for short-term volatility around expiry and reducing some of the long gamma positioning in the market.
Triple Witching (Dec. 19) – Record ~$7.1T of Options Notional Set to Expire
December Expiry Notional Open Interest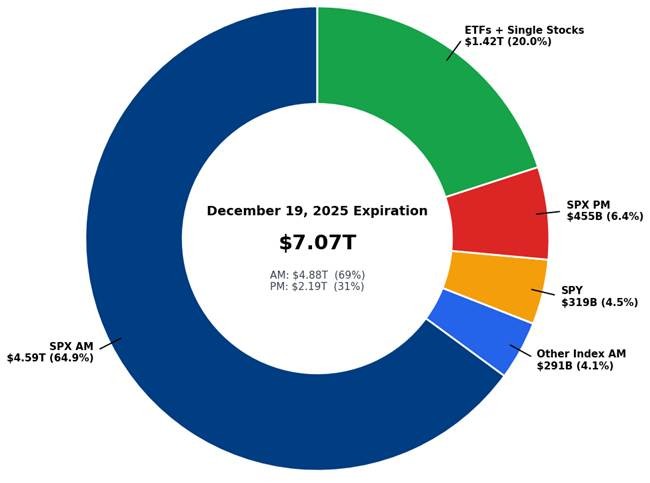
Source: Bloomberg as compiled by Citadel Securities, GMI, as of December 16th, 2025. Figures are for illustrative purposes only. Past performance figures do not guarantee future results.
SPX (December 19, 2025) Triple Witching Expiry
Notional ($) by Strike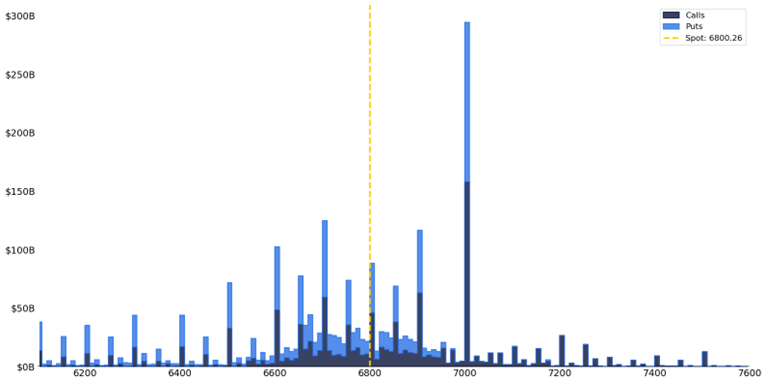
Source: Bloomberg as compiled by Citadel Securities, GMI, as of December 16th, 2025. Figures are for illustrative purposes only. Past performance figures do not guarantee future results.
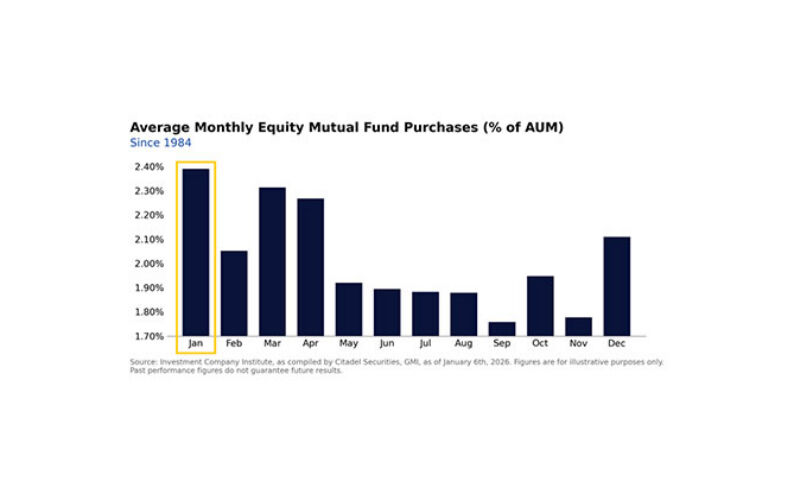
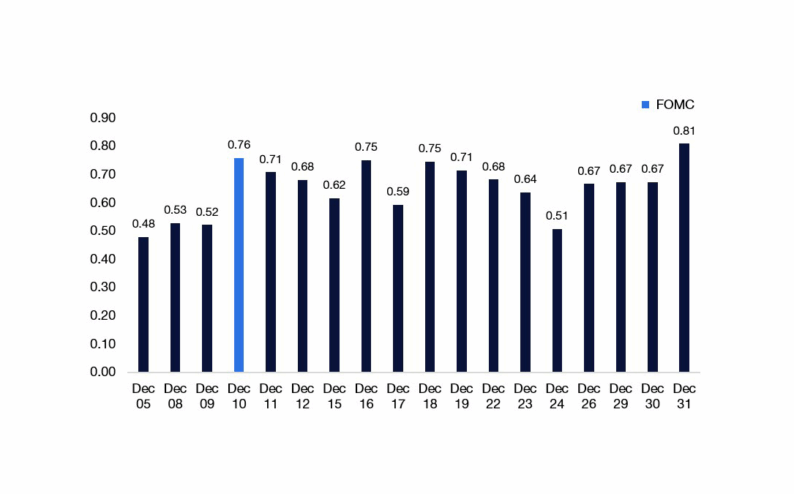
Seasonality remains supportive. The second half of December historically carries one of the highest hit rates of any two-week period, extending into January (i.e. The January Effect). Since 1928, the S&P 500 has risen 75% of the time during the latter half of December, with an average return of +1.3%, while trading volumes typically decline, amplifying price impact.
SPX Half-Month Seasonality
Since 1928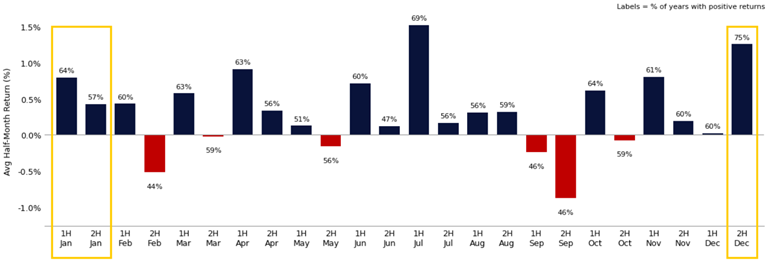
Source: Bloomberg as compiled by Citadel Securities, GMI, as of December 18th, 2025. Figures are for illustrative purposes only. Past performance figures do not guarantee future results.
NDX Half-Month Seasonality
Since 1985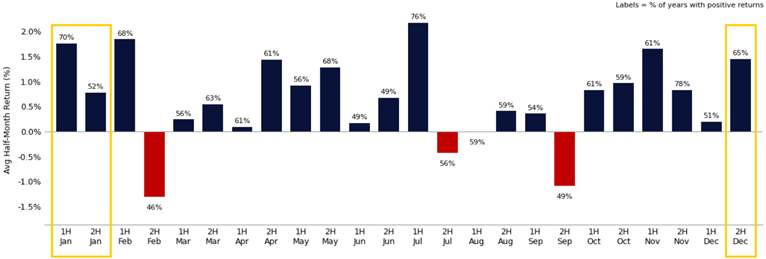
Source: Bloomberg as compiled by Citadel Securities, GMI, as of December 18th, 2025. Figures are for illustrative purposes only. Past performance figures do not guarantee future results.
RTY Half-Month Seasonality
Since 1978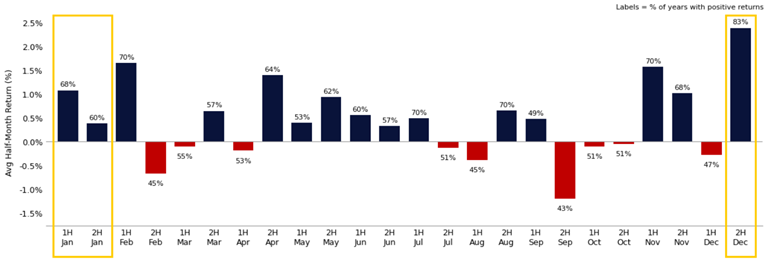
Source: Bloomberg as compiled by Citadel Securities, GMI, as of December 18th, 2025. Figures are for illustrative purposes only. Past performance figures do not guarantee future results.
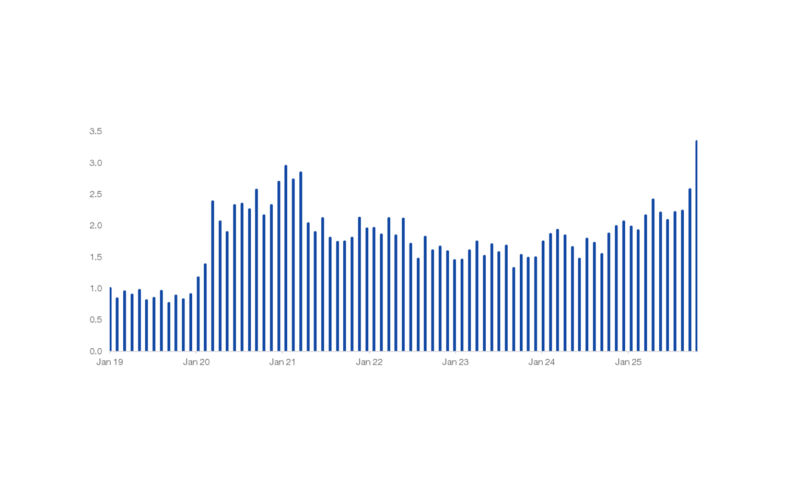
Weekly Equities Trading Volume vs. Average
Calendar Weeks, 2004 – Present
Source: Bloomberg as compiled by Citadel Securities, GMI, as of December 18th, 2025. Figures are for illustrative purposes only. Past performance figures do not guarantee future results.
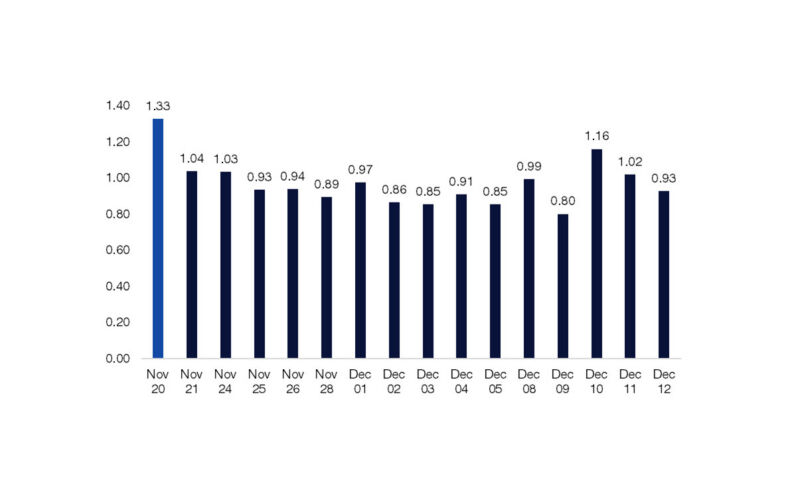
SPX – Implied Daily Move (%)
December 18, 2025 – January 16, 2026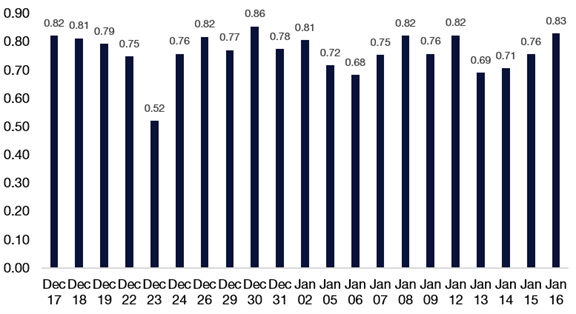
Source: Bloomberg as compiled by Citadel Securities, GMI, as of December 18th, 2025. Figures are for illustrative purposes only. Past performance figures do not guarantee future results.
SPX – Implied Weekly Move (%)
December 19, 2025 – January 16, 2026
Source: Bloomberg as compiled by Citadel Securities, GMI, as of December 18th, 2025. Figures are for illustrative purposes only. Past performance figures do not guarantee future results.
⬇️ GMI BOTTOM LINE ⬇️
Markets enter 2026 with a solid macroeconomic foundation. Retail participation is structurally higher, supported by record household wealth, broadening equity ownership, and substantial cash balances. Rotation across indices, sectors, and commodities signals healthier market breadth, while earnings momentum continues to diffuse beyond a narrow leadership cohort.
Policy dynamics reinforce this constructive outlook. Fiscal impulse is turning positive, monetary conditions are easing, and political uncertainty is diminishing. Positioning remains far from crowded, with persistent retail demand, rebuilding institutional exposure, and favorable seasonal dynamics in January.
The path forward may not be linear, but the ingredients for continued upside are in place. With participation broadening, profits expanding, and policy becoming more accommodative, we remain constructive on the macro and market structure outlook for Q1 2026 and beyond.
Copyright © Citadel Enterprise Americas LLC or one of its affiliates. All rights reserved.
Legal Entities Disseminating this Material: This material is disseminated in the United Kingdom by Citadel Securities (Europe) Limited (“CDGE”) authorized and regulated by the Financial Conduct Authority (“FCA”) (Registered company number: 05462867); in the European Union by Citadel Securities GCS (Ireland) Limited (“CSGI”) and its Paris Branch authorized and regulated by the Central Bank of Ireland (“CBI”) (Registration Number: C173437); in Hong Kong by Citadel Securities (Hong Kong) Limited (“CDHK”) licensed by the Securities and Futures Commission of Hong Kong (“SFC”), in Japan by Citadel Securities Japan Co., Ltd (“CSJC”) registered as a Type 1 financial instruments business operator with the Japan Financial Services Agency (“JFSA”); and in the United States of America by Citadel Securities LLC (“CDRG”) registered with the Securities Exchange Commission (“SEC”), Financial Industry Regulatory Authority (“FINRA”), and Securities Investor Protection Corporation (“SIPC”), Citadel Securities Institutional LLC (“CSIN”) registered with the SEC, FINRA, and SIPC, or Citadel Securities Swap Dealer LLC (“CSSD”) registered with the SEC, Commodities Futures Trading Commission (“CFTC”), and National Futures Association (“NFA”). Unless governing law permits otherwise, you must contact a Citadel Securities entity in your home jurisdiction if you want to use our services in effecting a transaction in any financial instruments or securities, including derivatives.
FOR INSTITUTIONAL USE ONLY; FOR PROFESSIONAL CLIENTS AND ELIGIBLE COUNTERPARTIES ONLY. This material is not intended as and does not constitute investment research. Contents of this material will be strictly limited to non-specific, generic information (i.e. macro events/topics) and are not subject to the Markets in Financial Instruments directive (MiFID II) or FINRA research rules. This material does not constitute an offer, solicitation, invitation, or inducement to purchase, acquire, subscribe to, provide, or sell any financial instrument or otherwise engage in investment activity. Please see additional important disclosures, including disclosures that may be relevant to your country of residence or business at www.citadelsecurities.com/GlobalSalesTrading.
Explore
Global Market Intelligence - What We Do