-
Who We Are
- What We Do
By Thomas Sozzi
Overview
As the end of daylight savings time approaches, we’re reminded it’s not just our clocks that are shifting—market rhythms are evolving too. While broader volumes have steadily concentrated in the late-day swell, retail investors began moving earlier some time ago, and this shift has only accelerated recently. These changing tides highlight an important point: as the timing of retail investor participation continues to evolve, it may be time to recalibrate how we think about the flow of volume throughout the trading day.
Amid the rise of overnight trading venues, we’ve observed notable shifts in volume dynamics on our retail platform. Given our scale, it’s worth revisiting how retail liquidity has evolved over time and what that means for the years ahead. Further, in securities where retail represents an outsized share of flow, some have labeled liquidity as “inaccessible”. Instead of placing blame on changes in market structure and investor preferences, traders should instead consider adapting strategy, venue selection, and – importantly – timing. In practice, that may mean leaning into the morning session, even when spreads run wider.
24/5 Trading On the Horizon
Launching next month – Citadel Securities will offer 24/5 liquidity (24 hours/day, 5 days/week) via the three venues now live in the overnight session.
Changing Tides
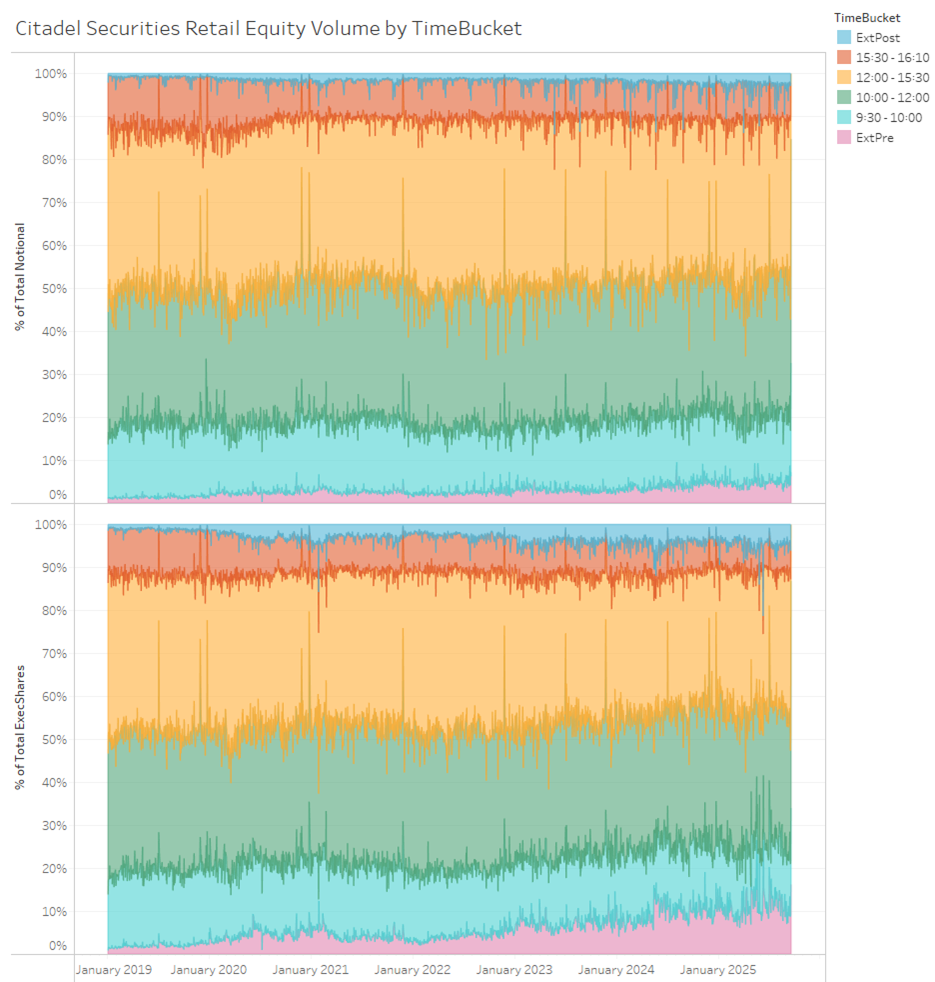
The below charts provide an overview of retail volumes over time, bucketed by time of day. For the purposes of this analysis, we broke the world up into six buckets: ExtPre (pre-market), 9:30 – 10:00 (to capture market open + morning price discovery), 10:00 – 12:00 (morning continuous session), 12:00 – 15:30 (afternoon continuous session), 15:30 – 16:10 (volume ramp-up into the close + closing auction), ExtPost (post-market).
In some cases, volume patterns appear consistent year-over-year. However, in certain sub-categories of flow, there are notable changes underway. Namely:
- The Rise of Pre-Market: pre-market volume (both in Notional and Shares terms) continues to increase. In 2019, pre-market volume accounted for just 1% of overall executed volume, but now makes up over ~5% of notional traded and ~10% of shares traded. This is also true in absolute volume terms (shares and notional). Note: pre-market volumes tend to be focused in the Mag-7/similar names as well as broad-market ETFs/levered ETFs (QQQ, SPY, TQQQ, SQQQ, SOXL).
- Closing Time: according to a 2024 article by NYSE , “Over the last couple of years, closing auctions have not only reached new highs in terms of daily traded shares and notional, but have also reached their highest levels as a share of US equity markets’ consolidated volume and notional.” Interestingly, retail volume on a relative basis from 15:30 – 16:10 has decreased over time and accounts for just ~6-7% of overall retail volume. This figure is down from ~10-12% back in 2019. While our overall retail volume figures for this category are mixed over time, retail investors haven’t kept-up with the broader shift.
- Burning the Midnight Oil: though still a fairly low percentage of overall volume, relative volume in the post-market session continues to increase in both Shares and Notional terms. This currently accounts for ~2% of notional traded and ~6% of shares traded. With our launch of 24/5 trading, we expect this to increase over time.
Source: Citadel Securities, as of 9/18/2025. Figures are for illustrative purposes only. Past performance figures do not guarantee future results.Intraday Volume Curves
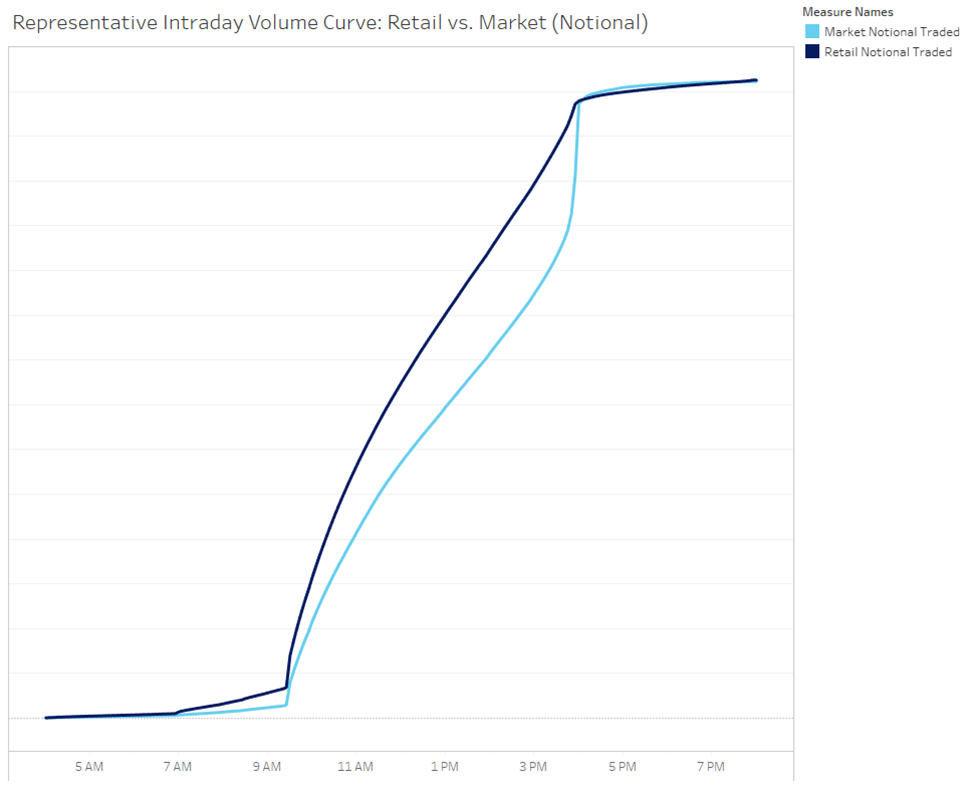
Examining this further, we thought it might be helpful to boil things down into representative intraday volume curves for retail versus the broader market. Using YTD data, the below chart plots overall volume on our retail platform compared to that of the broader market throughout the day (cumulative % of total). Retail (the dark blue line) tends to be much more active on a relative basis in the pre-market session as well as over the bulk of the trading day up to ~3:30pm. Broader market volumes (light blue line) pick-up exponentially at 3:30pm into the close.
Source: Citadel Securities, as of 9/18/2025. Figures are for illustrative purposes only. Past performance figures do not guarantee future results.Leverage x Liquidity
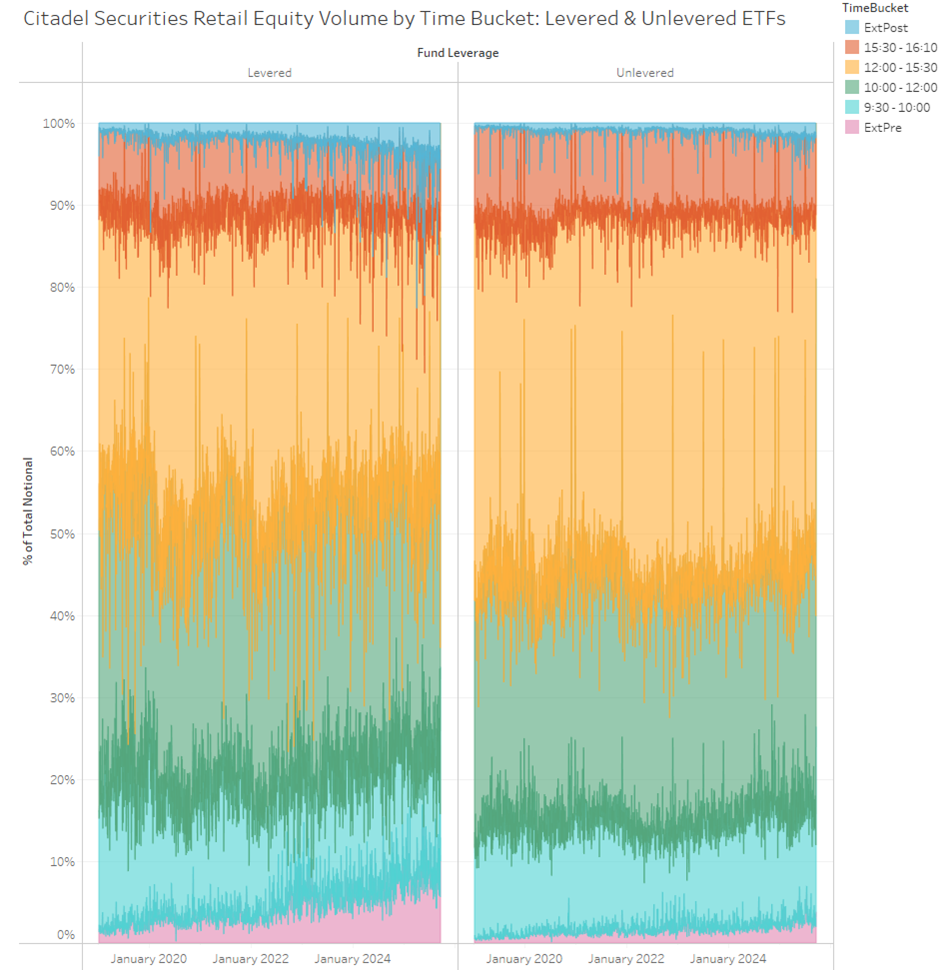
Within the ETF space, liquidity dynamics have shifted considerably since pre-COVID. We’ve noted in the past the rise in levered and inverse levered ETF volumes across the index space (namely SPX and NDX). However, with the introduction of single stock levered products a few years back, the space continues to draw retail investor interest. Retail investors have become increasingly active in the pre-market session, and to a lesser extent the post-market.
Source: Citadel Securities, as of 9/18/2025. Figures are for illustrative purposes only. Past performance figures do not guarantee future results.Retail Roster Names
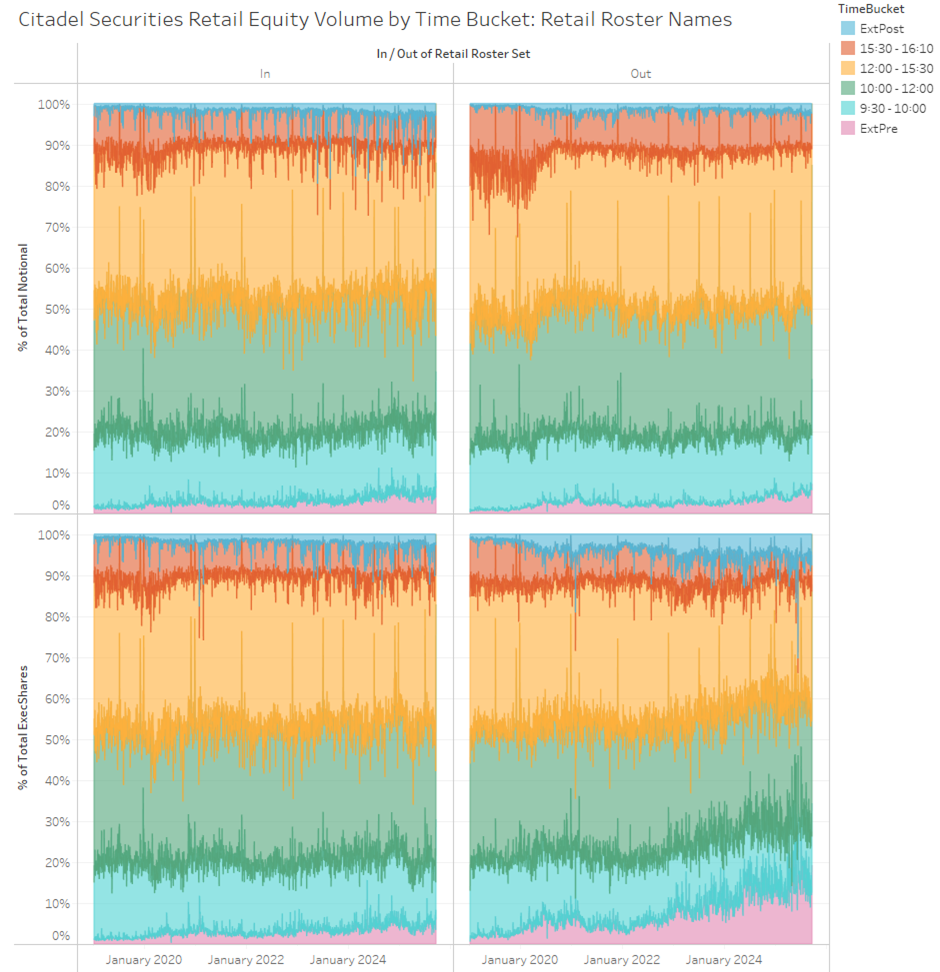
Given our recent work on our Retail Roster basket series (which monitor the performance of popular retail trades based on our estimates of aggregate retail flows), we wanted to see if there were any observable differences in these same liquidity dynamics for stocks that have been present in either the Top-30 Buy or Top-30 Sell baskets since introduction.
While we don’t note any material differences in Notional terms on a relative basis (the top two charts below, where “In” denotes common stocks in the Retail Roster universe and “Out” is all others), retail market volumes in Shares terms is notably different in the pre-market and Open + Price Discovery periods. One theory as to why is that retail investors are likely utilizing lower dollar securities (hence, more notable in Share vs. Notional terms) as vehicles for intraday trading as opposed to longer-term holding periods. The Retail Roster baskets are designed to observe patterns over an entire month and not higher frequency periods, so likely less relevant for intraday trading vehicles such as the ones that have seen a jump in pre-market and Open + Price Discovery volumes.
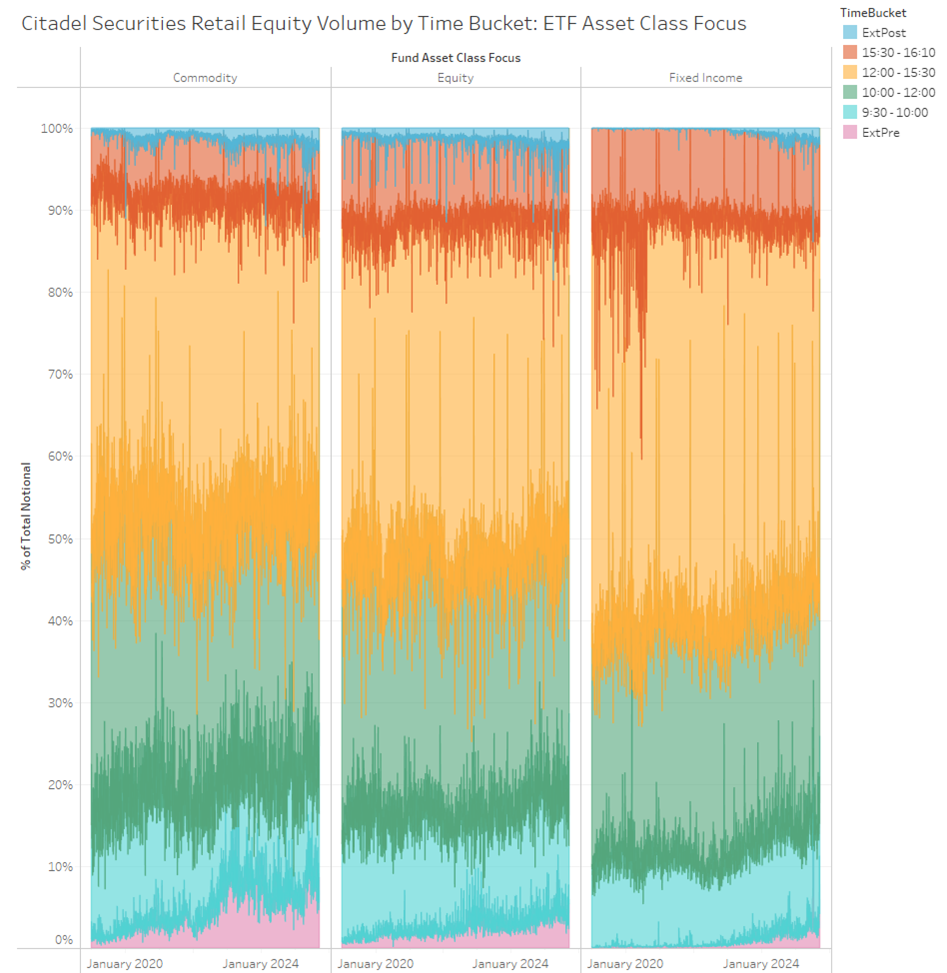
Source: Citadel Securities, as of 9/18/2025. Figures are for illustrative purposes only. Past performance figures do not guarantee future results.ETF Asset Class Focus
Lastly, we looked at whether there were any notable differences among the main ETF asset classes: Equity, Fixed Income, Commodity. A few observations:
- All three sub-categories have seen an increase in pre-market volumes over time (in particular, Fixed Income ETF pre-market volumes were non-existent just a few short years ago)
- Fixed Income ETFs have the highest portion of overall retail volumes in the closing 30 minutes + auction. This is contrary to what one would expect given the differences in equity vs. fixed income market structure.
- Commodity ETFs have the highest proportion of pre-market liquidity amongst retail investors
Source: Citadel Securities, as of 9/18/2025. Figures are for illustrative purposes only. Past performance figures do not guarantee future results.Legal Entities Disseminating this Material: This material is disseminated in the United Kingdom by Citadel Securities (Europe) Limited (“CDGE”) authorised and regulated by the Financial Conduct Authority (“FCA”) (Registered company number: 05462867); in the European Union by Citadel Securities GCS (Ireland) Limited (“CSGI”) and its Paris Branch authorised and regulated by the Central Bank of Ireland (“CBI”) (Registration Number: C173437); in Hong Kong by Citadel Securities (Hong Kong) Limited (“CDHK”) licensed by the Securities and Futures Commission of Hong Kong (“SFC”), in Japan by Citadel Securities Japan Co., Ltd (“CSJC”) registered as a Type 1 financial instruments business operator with the Japan Financial Services Agency (“JFSA”); and in the United States of America by Citadel Securities LLC (“CDRG”) registered with the Securities Exchange Commission (“SEC”), Financial Industry Regulatory Authority (“FINRA”), and Securities Investor Protection Corporation (“SIPC”), Citadel Securities Institutional LLC (“CSIN”) registered with the SEC, FINRA, and SIPC, or Citadel Securities Swap Dealer LLC (“CSSD”) registered with the SEC, Commodities Futures Trading Commission (“CFTC”), and National Futures Association (“NFA”). Unless governing law permits otherwise, you must contact a Citadel Securities entity in your home jurisdiction if you want to use our services in effecting a transaction in any financial instruments or securities, including derivatives.
FOR INSTITUTIONAL USE ONLY; FOR PROFESSIONAL CLIENTS AND ELIGIBLE COUNTERPARTIES ONLY. This material is not intended as and does not constitute investment research. Contents of this material will be strictly limited to non-specific, generic information (i.e. macro events/topics) and are not subject to the Markets in Financial Instruments directive (MiFID II) or FINRA research rules. This material does not constitute an offer, solicitation, invitation, or inducement to purchase, acquire, subscribe to, provide, or sell any financial instrument or otherwise engage in investment activity. Please see additional important disclosures, including disclosures that may be relevant to your country of residence or business at www.citadelsecurities.com/GlobalSalesTrading.
https://www.citadelsecurities.com/privacy/
Explore
Market Insights - What We Do