-
Who We Are
- What We Do
Series: Global Market IntelligenceDecember / Year-End
By Scott Rubner
The U.S. equity market has meaningfully healed after a period dominated by non-fundamental technical dynamics. With 18 trading days left in 2025, our stance remains constructive. The supply and demand mismatch has turned decisively in favor of the buyside, and if indices push to new highs, FOMO-driven chase behavior could accelerate. Retail investors – this year’s primary price setter – continue to hold the hottest hand and remain fully engaged.
I spent this week meeting clients across two cities, and the feedback was strikingly consistent: What is the playbook for 2026? All clear into year-end?
We are entering the new year with an unusually potent mix of fiscal, technological, and political catalysts – a constructive backdrop for global equities.
My framework is anchored in the Three P’s: Profits, Policy, and Positioning.
Profits
- AI diffusion is broadening earnings. Profit growth is no longer concentrated in mega-cap tech. AI adoption across the S&P 500 is improving market breadth and positioning 2026 as a true stock-picker’s environment.
- Corporate strength remains intact. The S&P 500 is delivering 13% YoY earnings growth, supported by the largest technology investment cycle since the internet era – more than $700B in annual tech CapEx.
- AI as a macro tailwind. Continued diffusion can lift U.S. productivity, real growth, and ultimately profit margins.
Policy
- A powerful global fiscal impulse. The U.S. is running more than $2T in annual deficit spending, complemented by stimulus initiatives in Japan, Germany, and new U.S. programs.
- A shifting monetary stance. Quantitative Tightening officially ended on December 1st, with a potential path toward an expanding Fed balance sheet in 2026.
- Deregulatory momentum. Easing policy constraints across sectors adds incremental tailwinds.
- Reduced political uncertainty. 2026 Midterm Elections are November 3rd and may see a period of reduced headline volatility.
- Household balance sheet strength. Retail investors remain thematically engaged around Fed cuts, potential stimulus checks, and possible tax relief.
- A pivotal Fed decision ahead. The next Fed Chair will be a defining catalyst for the next monetary-policy regime.
Positioning
- Positioning remains light. As markets grind higher, FOMO continues to pull under-allocated investors back in.
- Institutions under-exposed; retail still engaged. Institutional positioning remains muted, while retail activity is elevated and continues to influence price action.
- Buybacks supportive. Corporate repurchase programs are re-accelerating into the strongest seasonal period of the year.
- Systematic strategies re-levering. After a period of de-grossing, vol resetting lower is enabling mechanical buyers to re-add exposure.
- January Effect ahead. Historically the largest seasonal household portfolio rebalance.
Below is the updated GMI market health check, highlighting the key signals we are monitoring as the tape transitions from mechanically driven flows back toward macro and fundamental drivers.
SPX – Implied Daily Move (%)
December 5 – December 31, 2025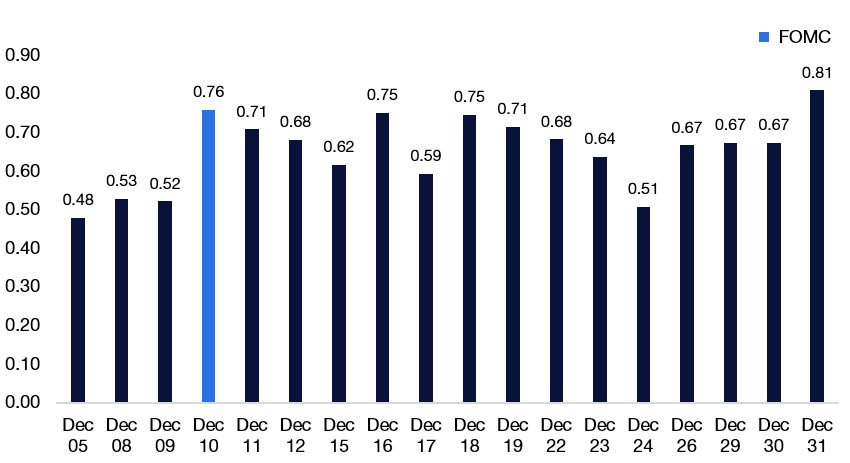
Source: Bloomberg as compiled by Citadel Securities, GMI, as of December 5th, 2025. Figures are for illustrative purposes only. Past performance figures do not guarantee future results.
SPX – Implied Weekly Move (%)
December 5 – December 19, 2025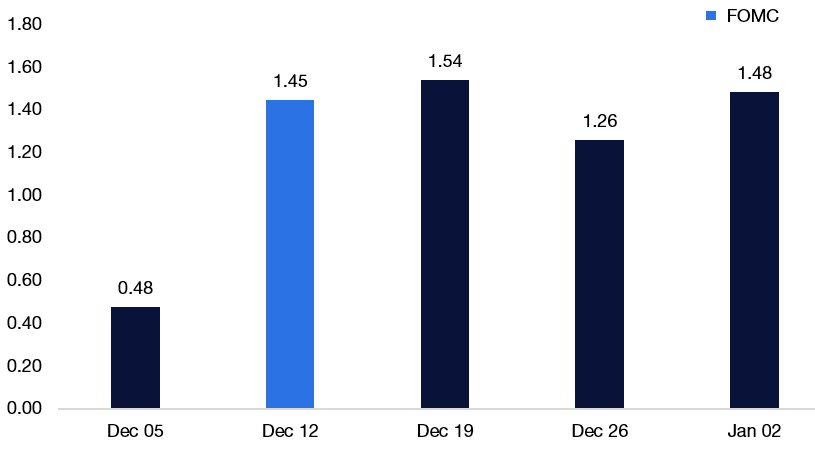
Source: Bloomberg as compiled by Citadel Securities, GMI, as of December 5th, 2025. Figures are for illustrative purposes only. Past performance figures do not guarantee future results.
It is time for a thread.🧵
I. GMI Citadel Securities – Market Technicals Checklist
November’s volatility was driven primarily by technical rather than fundamental forces. That pressure is now unwinding, and the tape is stabilizing. Volatility and flow indicators have retreated from their April-style extremes, and market structure has HEALED.
Source: Bloomberg as compiled by Citadel Securities, GMI, as of December 5th, 2025. Figures are for illustrative purposes only. Past performance figures do not guarantee future results.
1. Intraday volatility remains elevated, but is beginning to moderate.
Following NVDA earnings, we saw a sharp pickup in intraday moves across the tape. SPX logged nine consecutive sessions with intraday swings greater than 128bps, while NDX and RTY showed similar behavior (>179bps and >148bps, respectively). All three indices posted their largest weekly average intraday ranges since April. Last week, however, finally brought signs of stabilization, which have continued this week.
SPX – Weekly Average Intraday Moves
April 4 – November 28, 2025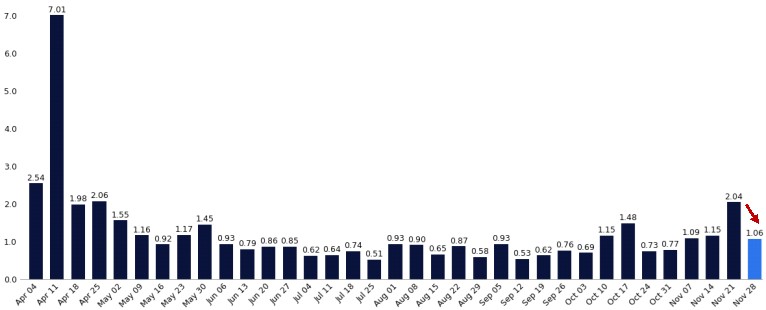
Source: Bloomberg as compiled by Citadel Securities, GMI, as of December 5th, 2025. Figures are for illustrative purposes only. Past performance figures do not guarantee future results.
NDX – Weekly Average Intraday Moves
April 4 – November 28, 2025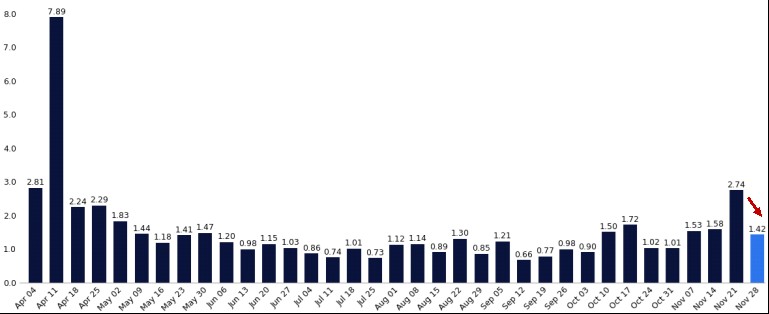
Source: Bloomberg as compiled by Citadel Securities, GMI, as of December 5th, 2025. Figures are for illustrative purposes only. Past performance figures do not guarantee future results.
RTY – Weekly Average Intraday Moves
April 4 – November 28, 2025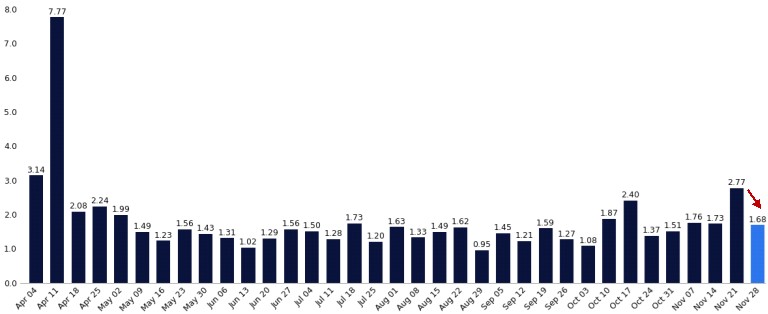
Source: Bloomberg as compiled by Citadel Securities, GMI, as of December 5th, 2025. Figures are for illustrative purposes only. Past performance figures do not guarantee future results.
2. Volatility is compressing → systematic re-leveraging begins
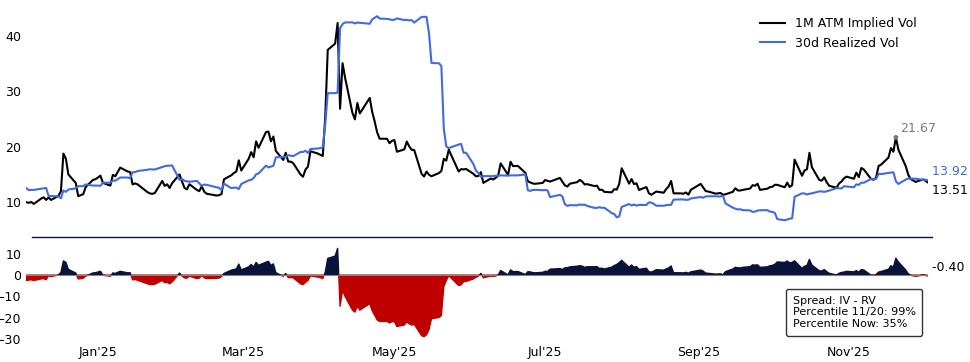
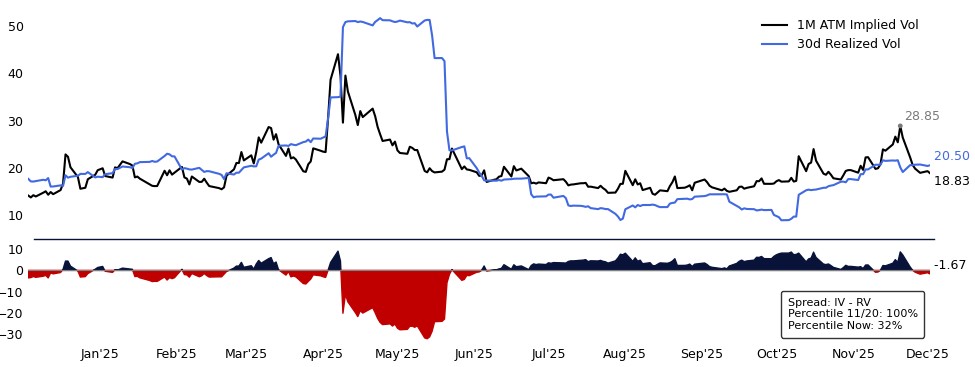
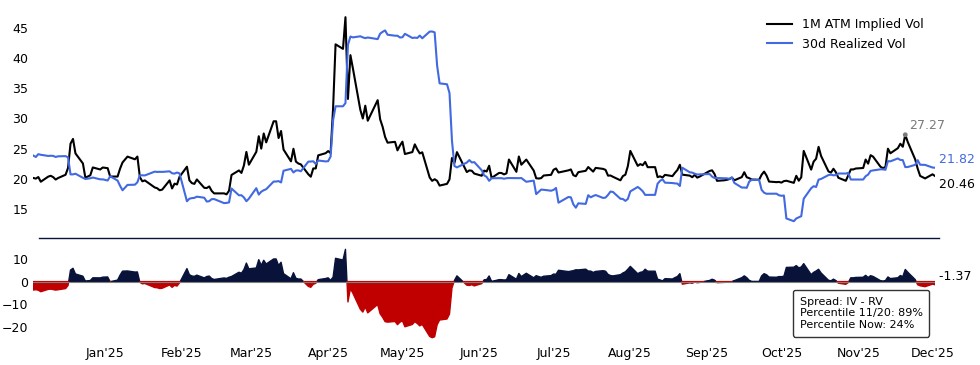
1-month at-the-money implied vols reached their highest levels since April across SPX, NDX, and RTY. The spread between 1-month implied and 30-day realized vols also approached its widest level in the last year for all-three indices. With the recent rally, implied volatility is compressing and the implied-realized gap is fading.
A significant portion of the short-dated, destabilizing gamma bled off at November expiry. As dealers have shifted meaningfully longer gamma than they were two weeks ago, the vol complex has lost one of its major amplifiers. This helps explain why vol has underperformed and why intraday swings have become more orderly.
SPX 1-Month Implied Vols: One-Year Lookback
Source: Bloomberg as compiled by Citadel Securities, GMI, as of December 5th, 2025. Figures are for illustrative purposes only. Past performance figures do not guarantee future results.
NDX 1-Month Implied Vols: One-Year Lookback
Source: Bloomberg as compiled by Citadel Securities, GMI, as of December 5th, 2025. Figures are for illustrative purposes only. Past performance figures do not guarantee future results.
RTY 1-Month Implied Vols: One-Year Lookback
Source: Bloomberg as compiled by Citadel Securities, GMI, as of December 5th, 2025. Figures are for illustrative purposes only. Past performance figures do not guarantee future results.
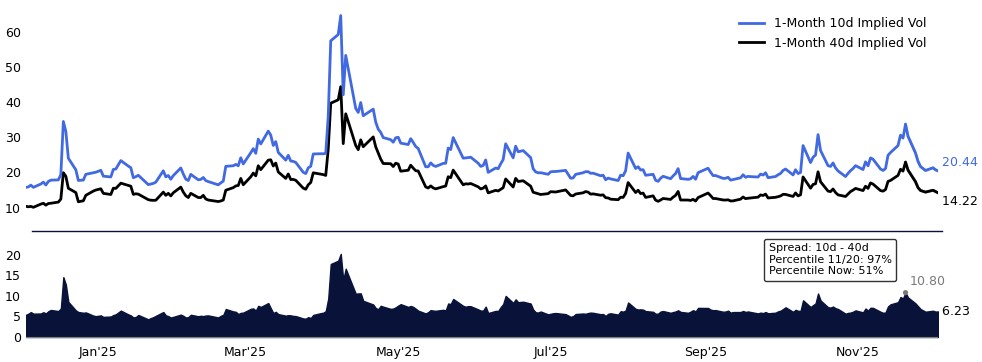
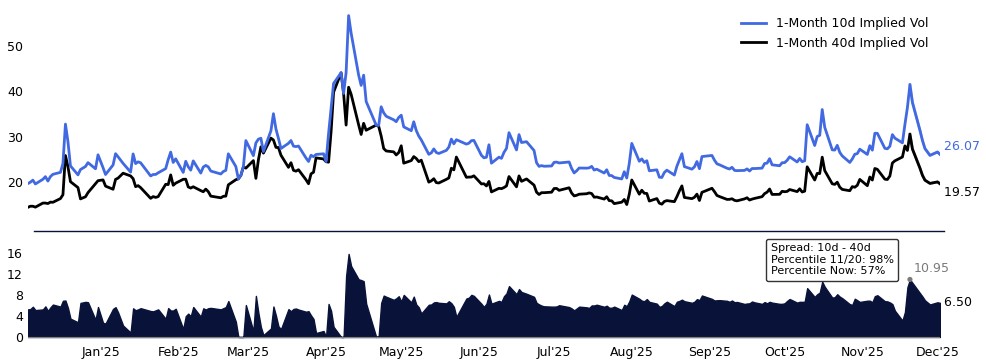
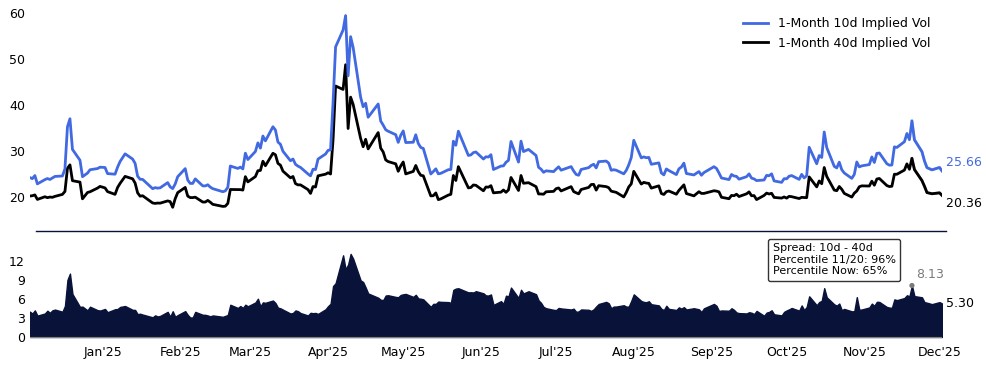
3. Skew is flattening
Downside skew at the front of the curve blew out two weeks ago, with 1-month put skew hitting levels last seen in April 2025. As those hedges have been monetized, front-end skew has flattened meaningfully.
SPX 1-Month 40/10d Put Skew – One-Year Lookback
Source: Bloomberg as compiled by Citadel Securities, GMI, as of December 5th, 2025. Figures are for illustrative purposes only. Past performance figures do not guarantee future results.
NDX 1-Month 40/10d Put Skew – One-Year Lookback
Source: Bloomberg as compiled by Citadel Securities, GMI, as of December 5th, 2025. Figures are for illustrative purposes only. Past performance figures do not guarantee future results.
RTY 1-Month 40/10d Put Skew – One-Year Lookback
Source: Bloomberg as compiled by Citadel Securities, GMI, as of December 5th, 2025. Figures are for illustrative purposes only. Past performance figures do not guarantee future results.
4. Put volumes have normalized – now back in the 40th percentile
Total Put Volumes over the last 5 years.
Five-Year Lookback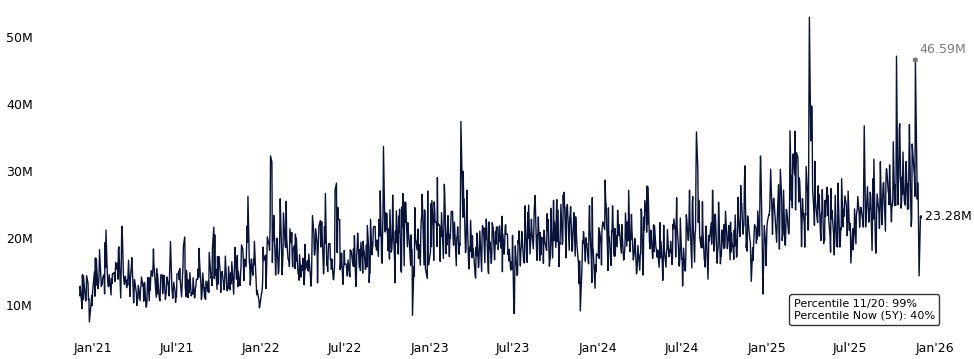
Source: Bloomberg as compiled by Citadel Securities, GMI, as of December 5th, 2025. Figures are for illustrative purposes only. Past performance figures do not guarantee future results.
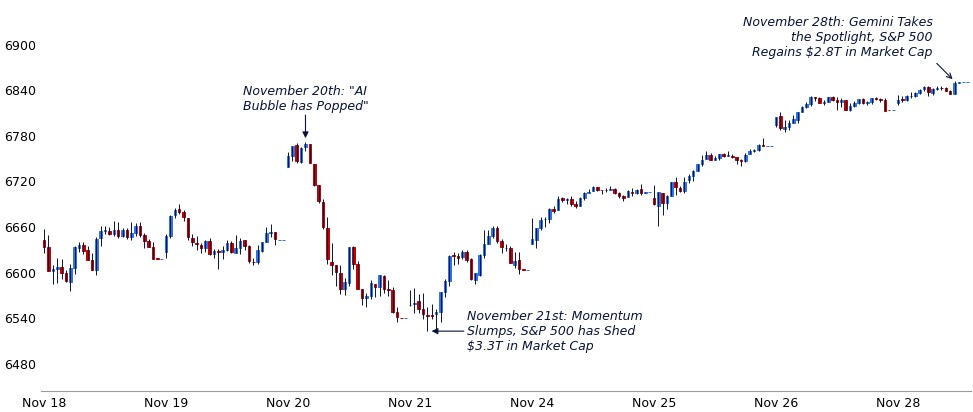
Right as Mentions of “AI BUBBLE” Peaked…
One-Year Lookback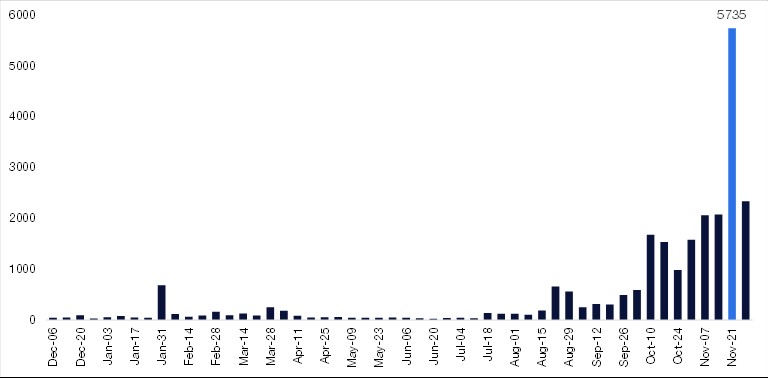
Source: Bloomberg as compiled by Citadel Securities, GMI, as of December 5th, 2025. Figures are for illustrative purposes only. Past performance figures do not guarantee future results.
5. ETF share of volume is moderating
ETF activity has normalized after November’s spike. On November 20th, ETFs accounted for 41% of total equity volume (a 98th-percentile reading) but volumes have since reverted to the 28% 1-year average.
This suggests less aggressive hedging, a reduction in systematic short-gamma pressure from leveraged ETF flows, and a shift back toward single-name participation.
ETF Share of Volume vs. SPX
One-Year Lookback
Source: Bloomberg as compiled by Citadel Securities, GMI, as of December 5th, 2025. Figures are for illustrative purposes only. Past performance figures do not guarantee future results.
6. Liquidity conditions are improving
E-mini top-of-book depth is bouncing back as vol resets lower. At the lows, ES1 futures liquidity ranked in the 5th percentile of the past three years, with only about $2M available at the inside market. Depth has since improved meaningfully as conditions normalize.
ES1 Liquidity Improving
Three-Year Lookback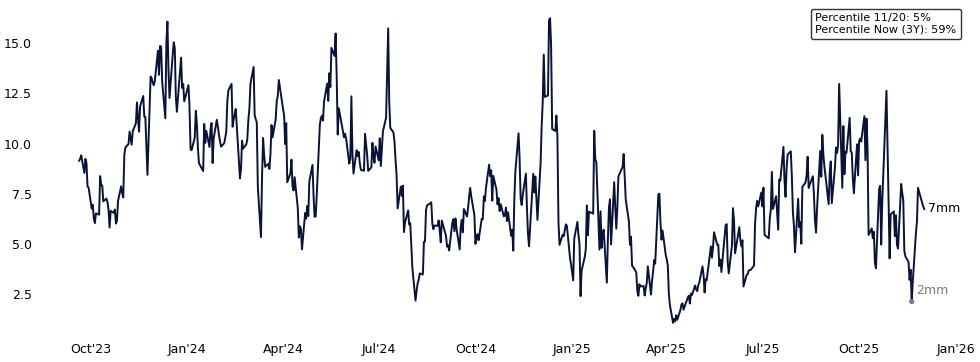
Source: Bloomberg as compiled by Citadel Securities, GMI, as of December 5th, 2025. Figures are for illustrative purposes only. Past performance figures do not guarantee future results.
7. Correlation is declining – single-stock alpha returning
Correlations are finally breaking lower. After ranking in the 86th percentile two weeks ago, 1-month implied correlations have now fallen back to roughly the 50th percentile on a one-year lookback. 3-month correlations have also rolled over meaningfully, down to the 34th percentile after sitting in the 82nd earlier this month.
Lower correlations typically signal healthier market structure and more room for idiosyncratic alpha to re-emerge.
1-Month Implied Correlation
One-Year Lookback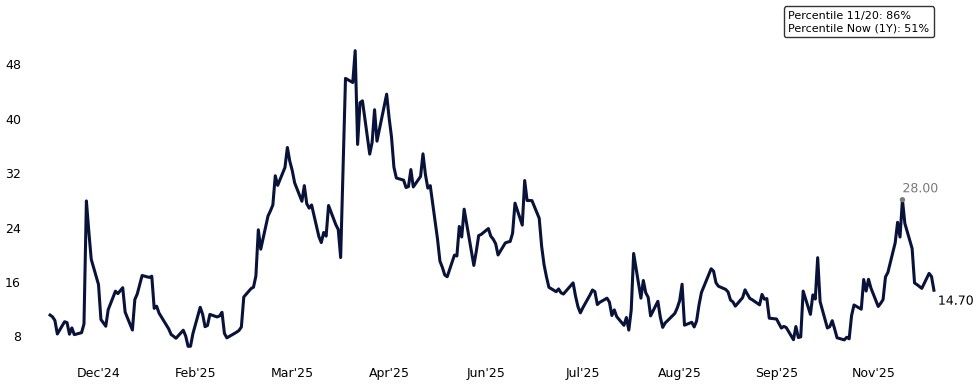
Source: Bloomberg as compiled by Citadel Securities, GMI, as of December 5th, 2025. Figures are for illustrative purposes only. Past performance figures do not guarantee future results.
3-Month Implied Correlation
One-Year Lookback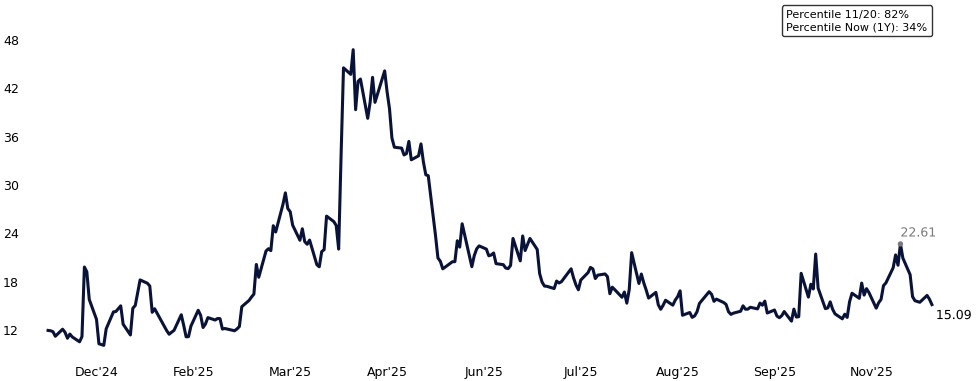
Source: Bloomberg as compiled by Citadel Securities, GMI, as of December 5th, 2025. Figures are for illustrative purposes only. Past performance figures do not guarantee future results.
8. Systematic re-leveraging has started
The wave of systematic selling has faded, and vol-targeting strategies are starting to re-lever. Global equity futures are trading above key short-term and medium-term CTA trigger levels, removing much of last week’s mechanical de-risking.
After two weeks of steady non-fundamental supply, CTA, Vol-Control, and Risk-Parity strategies have begun to re-add exposure as realized volatility declines. Do you get the same emails modelling simulations to buy in an Up-Tape?
SPX Exposure of Vol-Targeting with 10% Risk
One-Year Lookback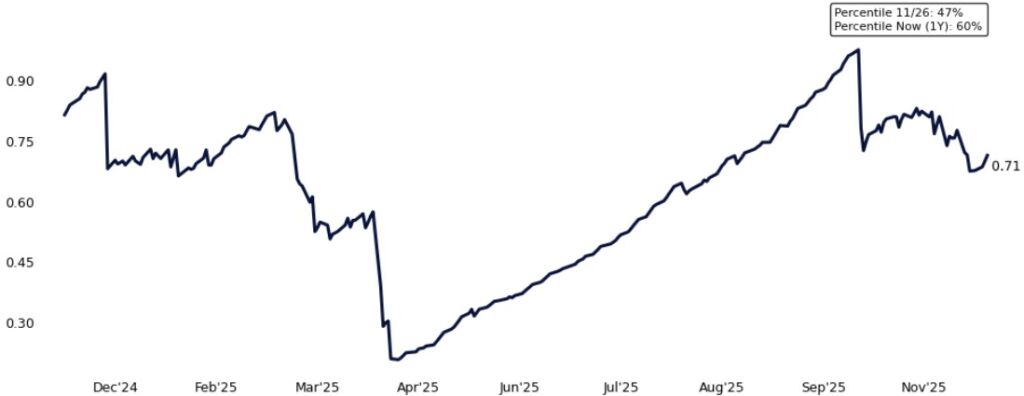
Source: Bloomberg as compiled by Citadel Securities, GMI, as of December 5th, 2025. Figures are for illustrative purposes only. Past performance figures do not guarantee future results.
9. Seasonal tailwinds are finally in play and Volumes decline
We are entering one of the strongest seasonal periods of the year. The second half of December has one of the best hit rates of any 2-week period of the year. SPX has traded higher 75% of the time, with an average return of +1.3% (average positive return = +2.1%). Volumes are typically lower in the last two weeks of the year.
SPX Half-Month Seasonality
Since 1928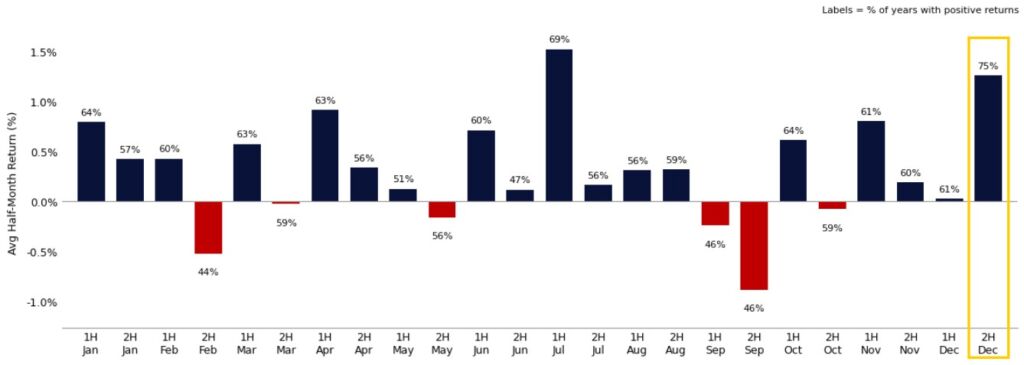
Source: Bloomberg as compiled by Citadel Securities, GMI, as of December 5th, 2025. Figures are for illustrative purposes only. Past performance figures do not guarantee future results.
NDX Half-Month Seasonality
Since 1985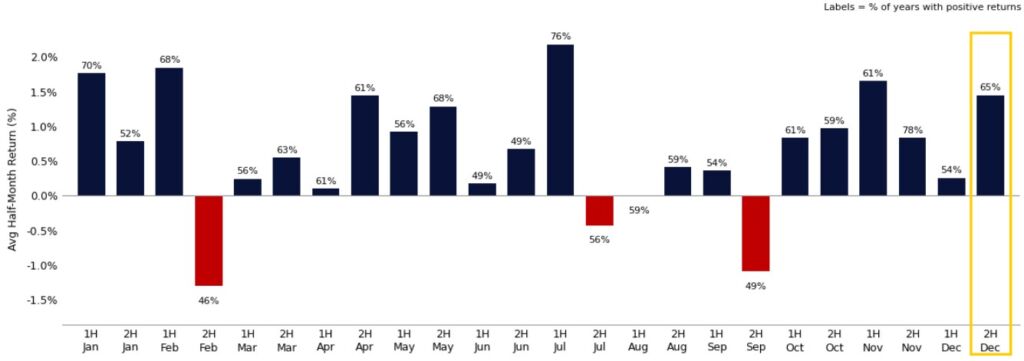
Source: Bloomberg as compiled by Citadel Securities, GMI, as of December 5th, 2025. Figures are for illustrative purposes only. Past performance figures do not guarantee future results
RTY Half-Month Seasonality
Since 1978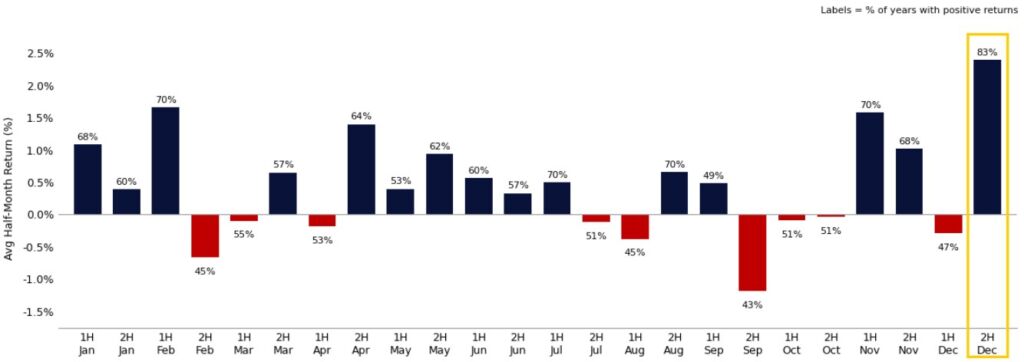
Source: Bloomberg as compiled by Citadel Securities, GMI, as of December 5th, 2025. Figures are for illustrative purposes only. Past performance figures do not guarantee future results.
Weekly Equities Trading Volume vs. Average
Calendar Weeks, 2004 – Present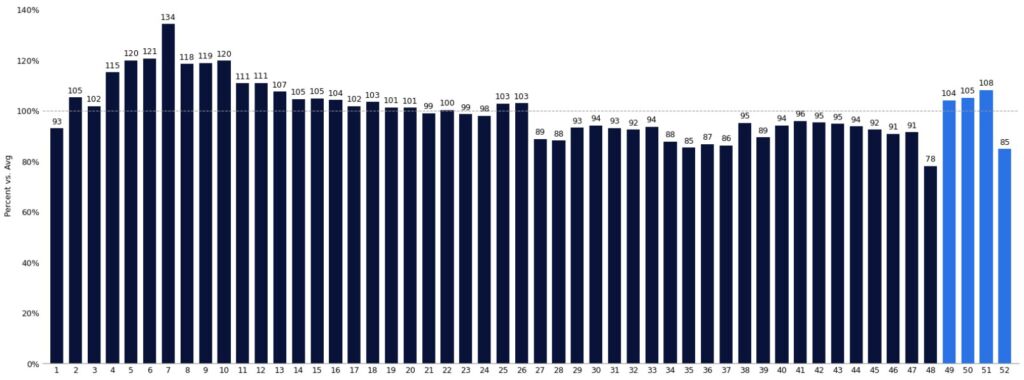
Source: Bloomberg as compiled by Citadel Securities, GMI, as of December 5th, 2025. Figures are for illustrative purposes only. Past performance figures do not guarantee future results.
10. Corporate Buyback Window Open
Now that Q3 reporting is nearly complete, the buyback window has reopened, and year-end corporate demand is set to increase. With U.S. companies on pace to authorize a record $1.3 trillion in buybacks this year, we project about $5.3 billion of daily VWAP demand into the close of the calendar year.
II. Citadel Securities Client Flows
Client engagement across equities and derivatives remains robust.
Retail flows:
As highlighted by Allie Becher in the November Retail Detail, retail options traders had been net buyers for 30 consecutive weeks – the longest bullish-sentiment streak on record. Last week saw the first pause, with retail turning 4% net better for sale, locking in sizable year-to-date gains.
Vol has reset sharply: 1-month ATM vols in retail’s 20 most active stocks now sit in the 15th percentile vs. the past year, creating an attractive setup for tactical upside expressions.
Institutional flows:
Institutions were 3% net better buyers last week, with strength in Staples, Utilities, and Discretionary. This week has broadened further:
- Retail: 2% net better to buy
- Institutions: 9% net better to buy (one of the strongest demand skews in weeks)
Retail Options – Put / Call Direction Ratio by Week
January – November 2025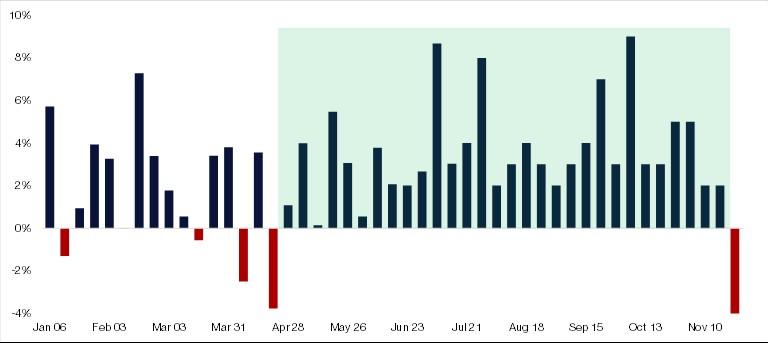
Source: Citadel Securities, as of December 5th, 2025. Figures are for illustrative purposes only. Past performance figures do not guarantee future results.
Institutional Options – Put / Call Direction Ratio by Week
January – November 2025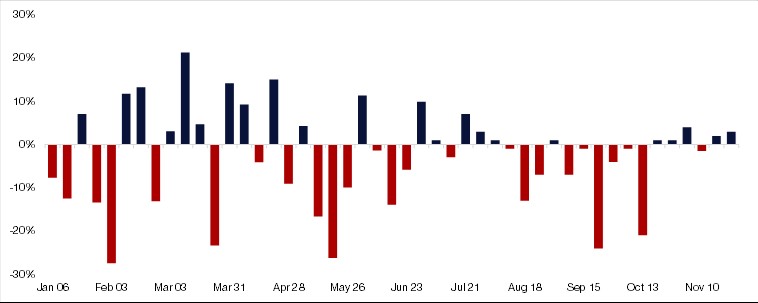
Source: Citadel Securities, as of December 5th, 2025. Figures are for illustrative purposes only. Past performance figures do not guarantee future results.
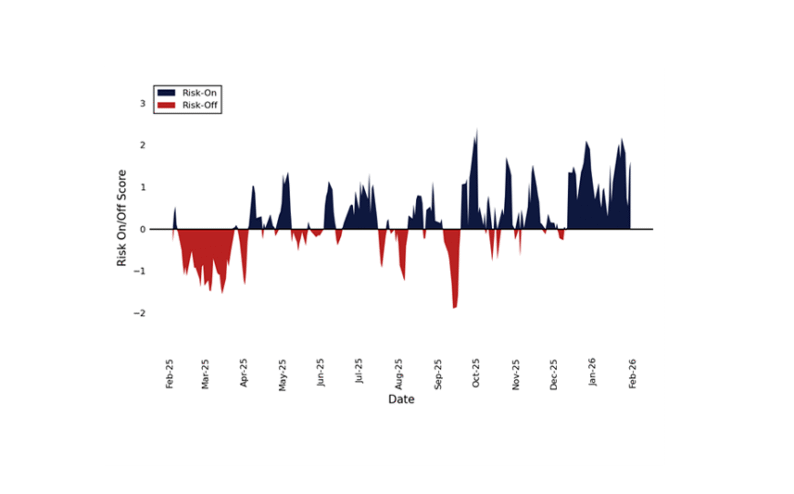
Retail RORO Indicator – 50 Most Liquid (generally rotating)
Positive = Risk On | Negative = Risk Off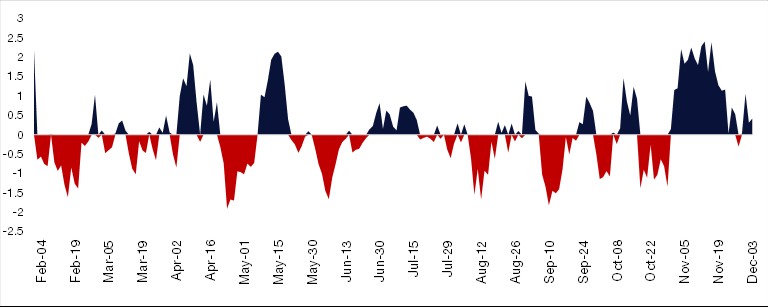
Source: Citadel Securities, as of December 5th, 2025. Figures are for illustrative purposes only. Past performance figures do not guarantee future results.
Retail RORO Indicator – Magnificent 7 (generally selling)
Positive = Risk On | Negative = Risk Off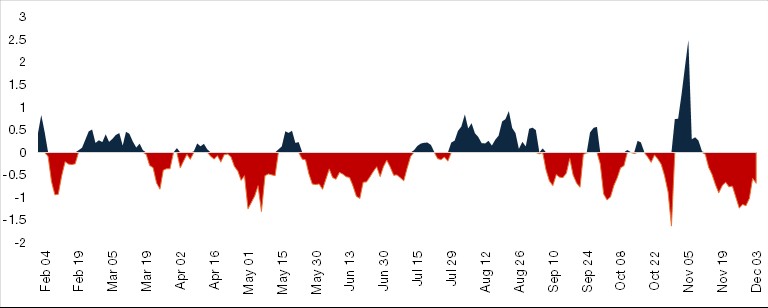
Source: Citadel Securities, as of December 5th, 2025. Figures are for illustrative purposes only. Past performance figures do not guarantee future results.
III. Broadening and Rotation
Market participation is broadening meaningfully. Last week produced some of the strongest and most widespread advances of the year, and sessions with the best breadth since May. Rotations remain active beneath the surface, with RTY notably outperforming SPX and NDX on several days.
A key debate has emerged within tech: TPU vs. GPU leadership, prompting investors to reassess durable AI advantage. This is a fundamental repositioning, not a momentum-only rotation.
The most powerful catalyst behind recent breadth has been the reset in FOMC expectations. Fed-funds futures now price a 91% probability of a December 25bp cut (up from 29% two weeks ago), following a coordinated shift in Fed communication despite blackout rules. Upside demand has surged across Small Caps, Regional Financials, and Homebuilders – sectors highly levered to a friendlier policy path.
FOMC – WIRP Estimated Probability of a December Cut
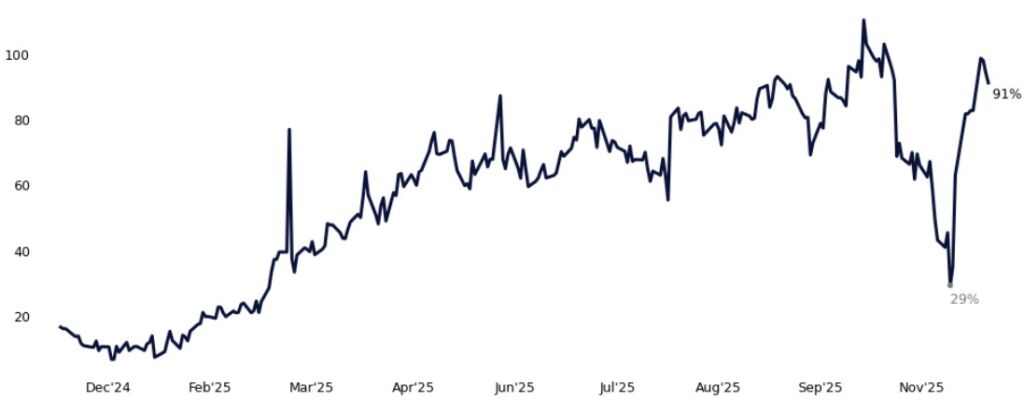
Source: Citadel Securities, as of December 5th, 2025. Figures are for illustrative purposes only. Past performance figures do not guarantee future results.
S&P 500 Breadth – 10 Day Moving Average of Daily Advancers
One Year Lookback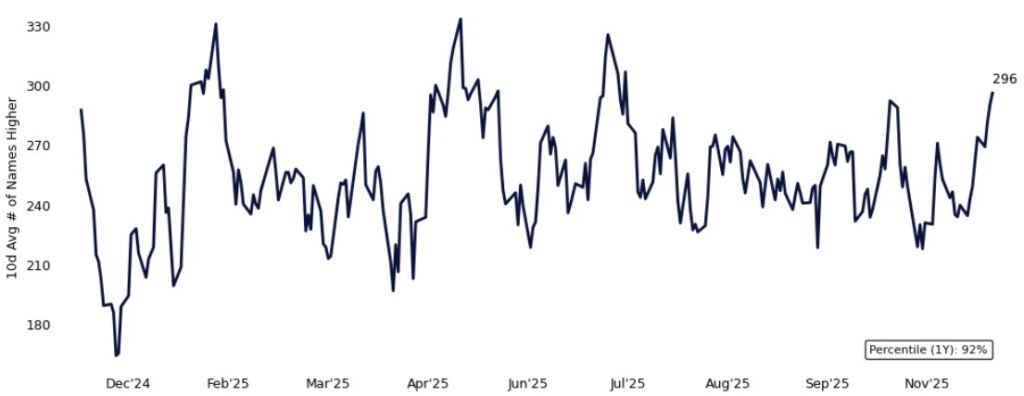
Source: Citadel Securities, as of December 5th, 2025. Figures are for illustrative purposes only. Past performance figures do not guarantee future results.
GMI – BOTTOM LINE
The non-fundamental technical pressure that defined November has meaningfully healed.
Key indicators are turning decisively constructive:
- Realized vol is compressing
- Skew is flattening
- ETF flow pressure is moderating
- Correlations are drifting lower
- Systematic buyers are re-levering
Tech, momentum, and Bitcoin have stabilized. Breadth is improving. The Fed is leaning dovish. Rotation is broad, active, and durable. The path forward will not be linear, but the tape is clearly stabilizing.
High-quality AI leadership and broadening/Fed-torque expressions continue to screen cleanly into the strongest seasonal window of the year.
We remain constructive on the macro backdrop into year-end and early 2026.
Copyright © Citadel Enterprise Americas LLC or one of its affiliates. All rights reserved.
Legal Entities Disseminating this Material: This material is disseminated in the United Kingdom by Citadel Securities (Europe) Limited (“CDGE”) authorized and regulated by the Financial Conduct Authority (“FCA”) (Registered company number: 05462867); in the European Union by Citadel Securities GCS (Ireland) Limited (“CSGI”) and its Paris Branch authorized and regulated by the Central Bank of Ireland (“CBI”) (Registration Number: C173437); in Hong Kong by Citadel Securities (Hong Kong) Limited (“CDHK”) licensed by the Securities and Futures Commission of Hong Kong (“SFC”), in Japan by Citadel Securities Japan Co., Ltd (“CSJC”) registered as a Type 1 financial instruments business operator with the Japan Financial Services Agency (“JFSA”); and in the United States of America by Citadel Securities LLC (“CDRG”) registered with the Securities Exchange Commission (“SEC”), Financial Industry Regulatory Authority (“FINRA”), and Securities Investor Protection Corporation (“SIPC”), Citadel Securities Institutional LLC (“CSIN”) registered with the SEC, FINRA, and SIPC, or Citadel Securities Swap Dealer LLC (“CSSD”) registered with the SEC, Commodities Futures Trading Commission (“CFTC”), and National Futures Association (“NFA”). Unless governing law permits otherwise, you must contact a Citadel Securities entity in your home jurisdiction if you want to use our services in effecting a transaction in any financial instruments or securities, including derivatives.
FOR INSTITUTIONAL USE ONLY; FOR PROFESSIONAL CLIENTS AND ELIGIBLE COUNTERPARTIES ONLY. This material is not intended as and does not constitute investment research. Contents of this material will be strictly limited to non-specific, generic information (i.e. macro events/topics) and are not subject to the Markets in Financial Instruments directive (MiFID II) or FINRA research rules. This material does not constitute an offer, solicitation, invitation, or inducement to purchase, acquire, subscribe to, provide, or sell any financial instrument or otherwise engage in investment activity. Please see additional important disclosures, including disclosures that may be relevant to your country of residence or business at www.citadelsecurities.com/GlobalSalesTrading.
Explore
Market Insights - What We Do