-
Who We Are
- What We Do
Series: Global Market IntelligenceEquity Pulse
By Scott Rubner
Global equities and fixed income markets are set to open weaker today. Please lean on Citadel Securities throughout the session for equity, options, and ETF market color, along with real-time insight into what we’re seeing and hearing from our rates and credit colleagues as headline-driven, cross-asset volatility remains elevated. We expect to have differentiated flows and liquidity.
—
Ahead of this morning’s move, equity markets enter Q1 with momentum, as leadership continues to rotate away from a narrow group of mega-cap stocks and toward a reflationary regime defined by accelerating growth and real-asset outperformance. Market signals are already reflecting this shift: breadth is improving, participation is expanding, and cyclicals and commodities are re-emerging as sources of relative strength.
Against this backdrop, we revisit our Q1 GMI framework – Retail, Rotation, Policy, Positioning, and Profits – as these dynamics begin to define early-year market behavior. I do not expect to see any material changes to this framework today.
It is time for a thread.
🧵
I. Retail: Already a Force in Early Q1. Buyers of the weakness today?
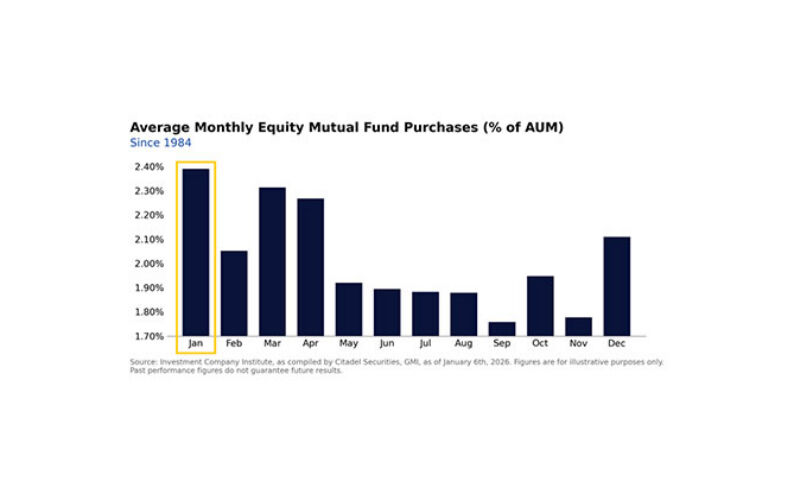
Retail remains an important driver of flows and short-term price action as Q1 gets underway, especially during January.
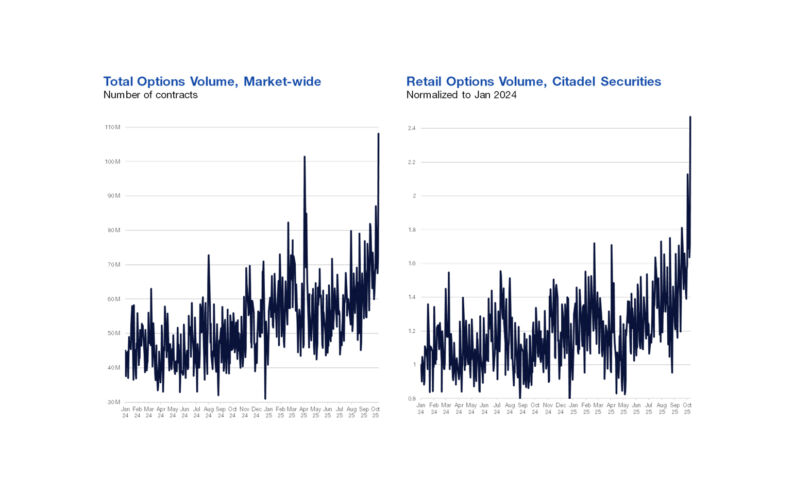
As the leading U.S. retail market maker, executing roughly 35% of all U.S.-listed retail volume, Citadel Securities has a unique vantage point into retail investor behavior and the forces shaping market impact. Activity on our retail platform remains elevated to start the year – average daily shares and average daily options contracts are tracking more than 40% above the 2020-2025 January average.
January Retail Options Volumes – Open Q1 at Record Levels
January Average Daily Options Contracts, Indexed to 2020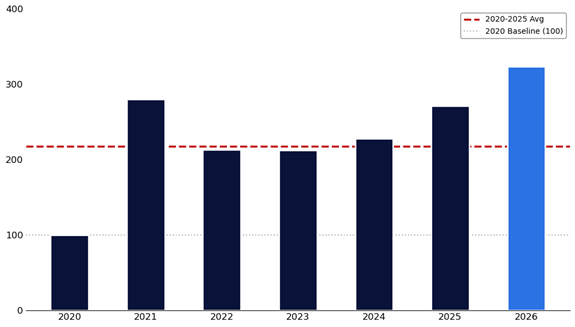
Source: Citadel Securities, GMI, as of January 20th, 2026. Figures are for illustrative purposes only. Past performance figures do not guarantee future results.
January Retail Cash Volumes – Highest Level Since 2021
January Average Daily Shares, Indexed to 2020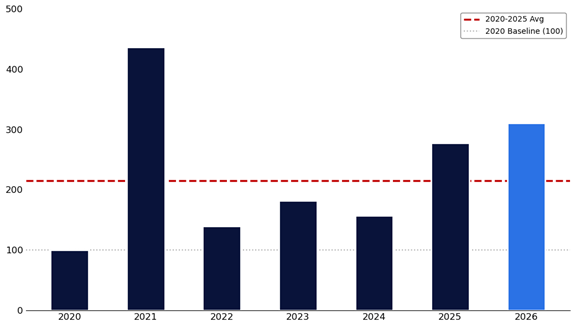
Source: Citadel Securities, GMI, as of January 20th, 2026. Figures are for illustrative purposes only. Past performance figures do not guarantee future results.
Alongside these elevated volumes, retail-favored themes have outperformed sharply to start the year. Year-to-date, the strongest areas are Rare Earths, Drones, Nuclear Power, and Crypto-sensitive equities – the same themes identified in our Top Themes into 2026: Retail Conviction at Scale note and where activity continues to build. These themes share structural characteristics that consistently attract retail participation: elevated short interest, low absolute share prices, and deep options liquidity – alongside clear, event-driven catalysts such as AI infrastructure buildouts, space commercialization milestones, and regulatory inflection points.
Market structure developments are reinforcing this trend. We also flagged Nasdaq’s proposal to introduce Monday and Wednesday single-stock options expiries as a key development to monitor. That proposal was approved on Friday (January 16th) and represents another important step toward increased access and flexibility for retail traders. Similar to the introduction of 0DTE options on select index and ETF products in 2022, this change has the potential to meaningfully accelerate retail trading volume.
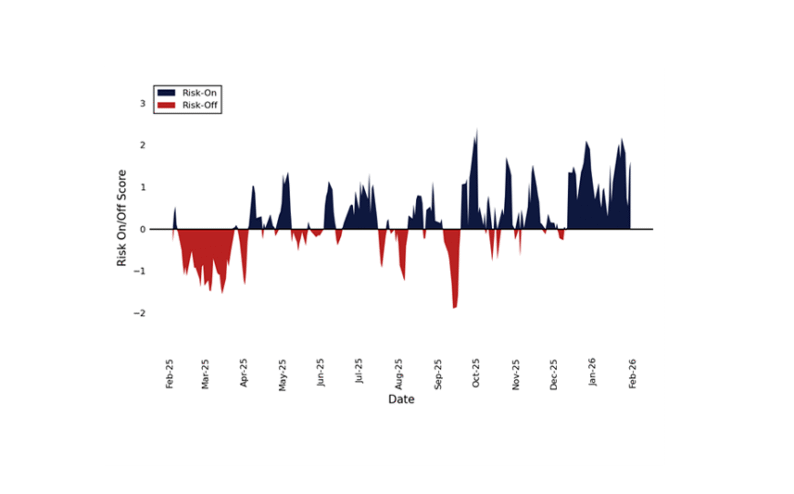
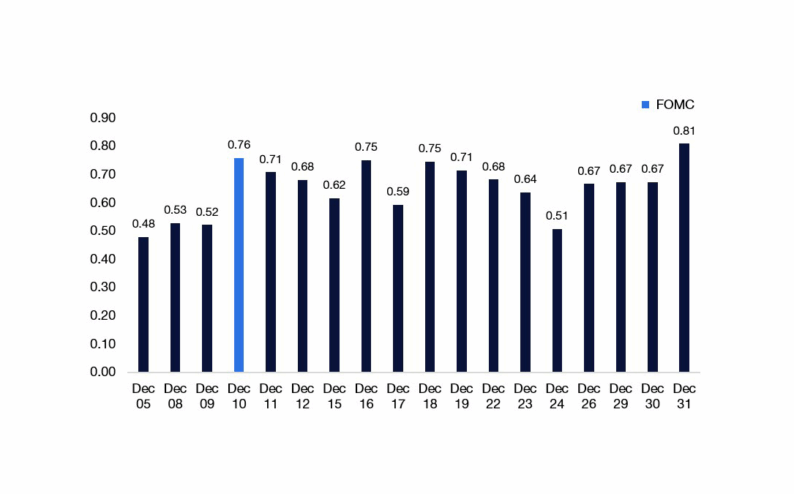
Directionally, retail behavior remains consistently bullish. Last Tuesday marked the largest single day of net equity buying by retail at Citadel Securities since the volatility around April’s “Liberation Day.” In options, retail has been skewed better to buy for seven consecutive weeks, and in 37 of the past 38 weeks.
Retail Risk-On/Risk-off Indicator
Since January 2025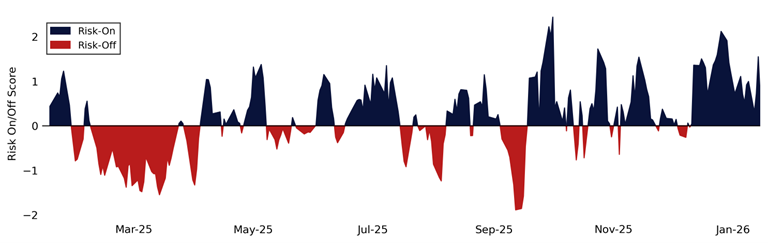
Source: Citadel Securities, GMI, as of January 20th, 2026. Figures are for illustrative purposes only. Past performance figures do not guarantee future results.
Retail Call/Put Direction Ratio
Weekly, Since January 2025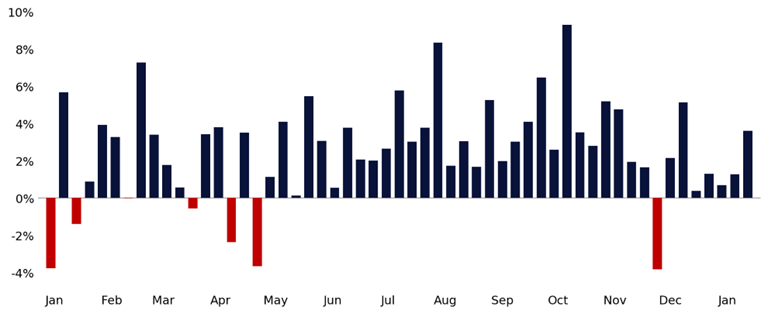
Source: Citadel Securities, GMI, as of January 20th, 2026. Figures are for illustrative purposes only. Past performance figures do not guarantee future results.
II. Rotation: Leadership Continues to Broaden
Leadership is continuing to broaden beneath the surface, with market performance increasingly favoring cyclicals and real assets over narrow, long-duration growth. While headline indices remain supported, relative performance across sectors points to a meaningful shift in leadership.
Equal-weight exposure continues to gain ground versus cap-weighted benchmarks, reflecting improving breadth and a more balanced contribution to returns. This trend suggests that market gains are being driven by a wider set of constituents rather than a small group of mega-cap names.
SPW vs. SPX Performance – Remains in the 7th Percentile Despite Recent Gains
Five-Year Lookback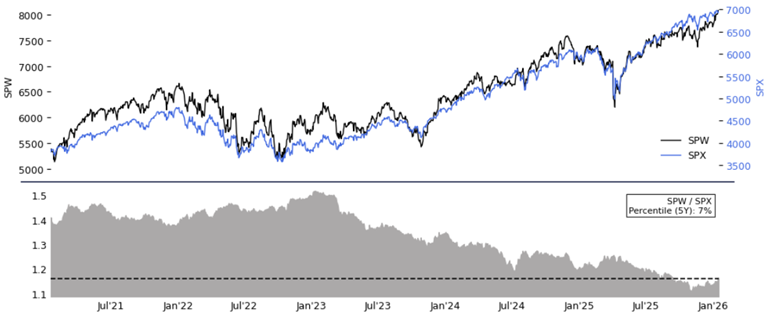
Source: Bloomberg as compiled by Citadel Securities, GMI, as of January 20th, 2026. Figures are for illustrative purposes only. Past performance figures do not guarantee future results.
Performance across real-economy assets continues to diverge from growth-heavy benchmarks. Industrials and materials equities are outperforming, while commodity-linked exposures are breaking out, pointing to renewed demand for assets tied to physical supply, industrial activity, and global re-acceleration.
Metals and Miners vs. NDX – One-Year Ratio Breaking Out
One-Year Lookback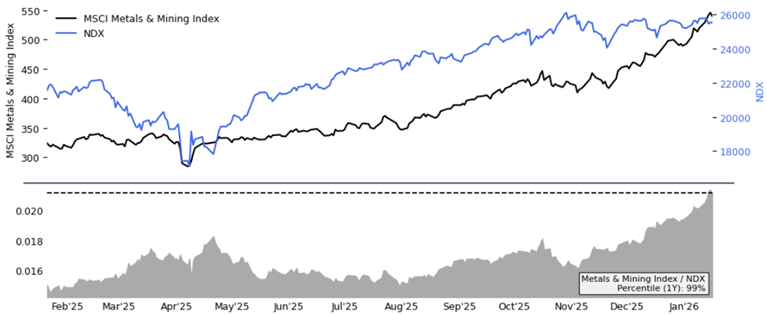
Source: Bloomberg as compiled by Citadel Securities, GMI, as of January 20th, 2026. Figures are for illustrative purposes only. Past performance figures do not guarantee future results.
Metals and Miners vs. NDX – Still has Room to Run
Fifteen-Year Lookback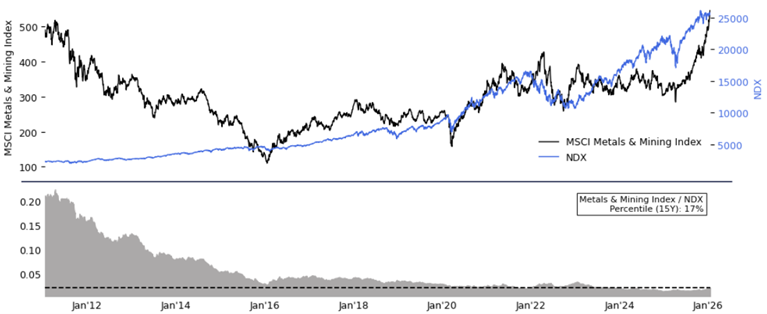
Source: Bloomberg as compiled by Citadel Securities, GMI, as of January 20th, 2026. Figures are for illustrative purposes only. Past performance figures do not guarantee future results.
Notably, this rotation is taking place even as overall index performance remains strong, underscoring an improving market composition rather than a move toward defensiveness. Markets are increasingly rewarding breadth, cyclicality, and real-asset exposure, signaling an early but meaningful rotation away from the most crowded growth trades.
Sector Performance – 2025 Laggards (Cyclicals) are the New Leaders
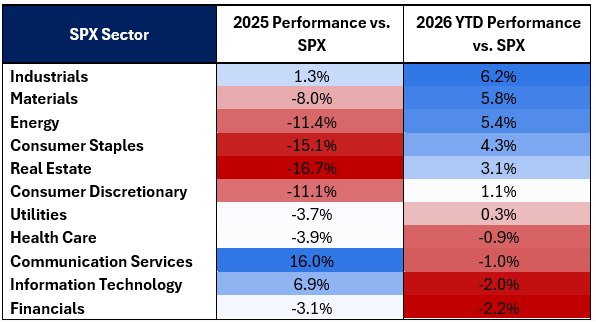
Source: Bloomberg as compiled by Citadel Securities, GMI, as of January 20th, 2026. Figures are for illustrative purposes only. Past performance figures do not guarantee future results.
III. Policy: Affordability Takes Center Stage
Policy direction is increasingly reinforcing the shift underway in markets. Messaging has moved decisively toward affordability, with a growing emphasis on boosting after-tax income, easing household cost pressures, and redirecting capital toward real economic activity.
Mentions of “AFFORDABILITY”
Quarterly, Five-Year Lookback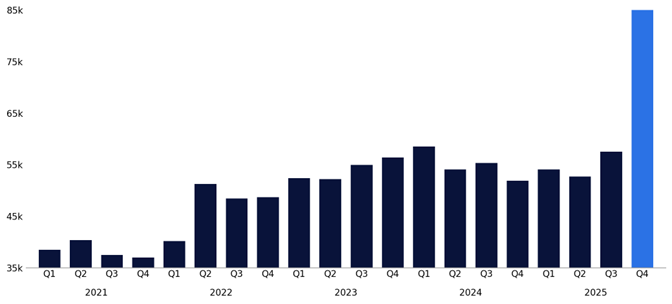
Source: Bloomberg as compiled by Citadel Securities, GMI, as of January 20th, 2026. Figures are for illustrative purposes only. Past performance figures do not guarantee future results.
Over the past two weeks, proposals have included capping credit card interest rates, reforms on prescription drug prices, and direct measures to provide mortgage rate relief – as ways to improve affordability for households. In addition, $100-150 billion in tax refunds could be directed to working Americans, underscoring the scale of potential near-term fiscal support.
Broader fiscal dynamics are also turning more supportive. The fiscal impulse is set to flip from a meaningful drag in Q4 to a tailwind in early 2026, as provisions of the One Big Beautiful Bill Act begin to take effect.
Total Change in After-Tax Income by Income Group
OBBBA Tax Changes, Excludes Effect of TCJA Extension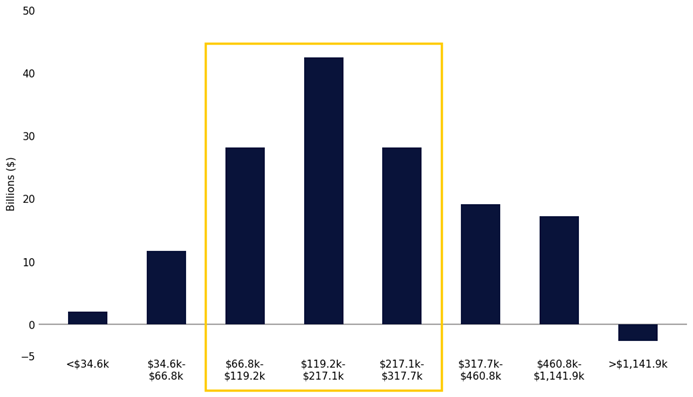
Source: Urban Institute, Brookings Institution, Tax Policy Center as compiled by Citadel Securities, GMI as of January 20th, 2026. Figures are for illustrative purposes only. Past performance figures do not guarantee future results.
Improved affordability also expands the pool of retail cash available to deploy, reinforcing participation as Q1 progresses.
Citadel Securities’ clients are using optionality to position around policy messaging and event risk. Activity has picked up ahead of upcoming milestones – including Davos this week – as markets gauge the extent to which affordability-focused messaging translates into policy outcomes.
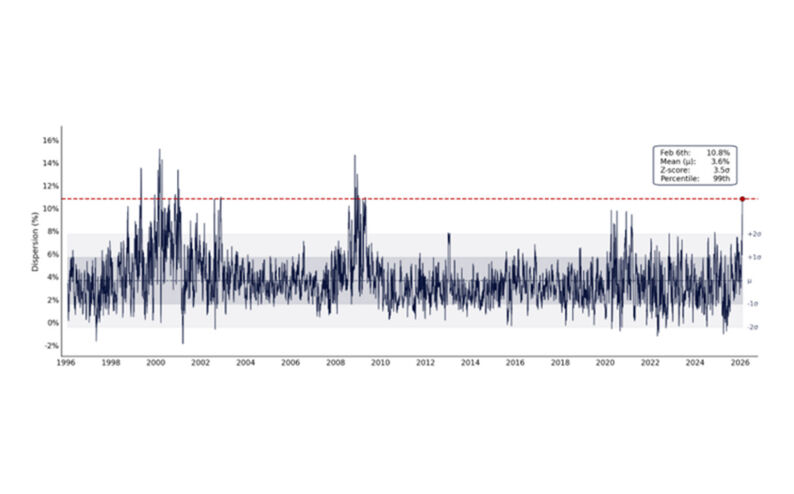
IV. Positioning: Tactical, Low Vol, High Dispersion
Client positioning into early Q1 remains tactical, with exposure increasingly expressed through near-dated options around macro events and the opening phase of earnings season. Rather than committing capital outright, positioning reflects a focus on dispersion and event-driven outcomes, particularly across sectors tied to the real economy (e.g., energy, industrials, homebuilders, and consumer discretionary names).
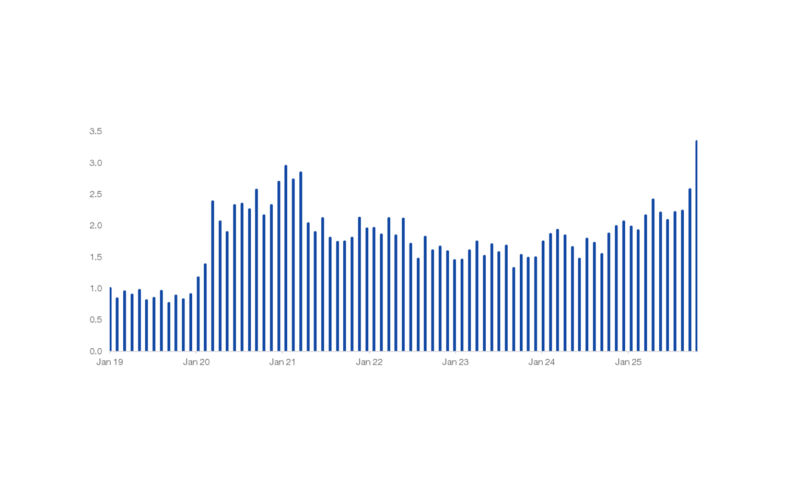
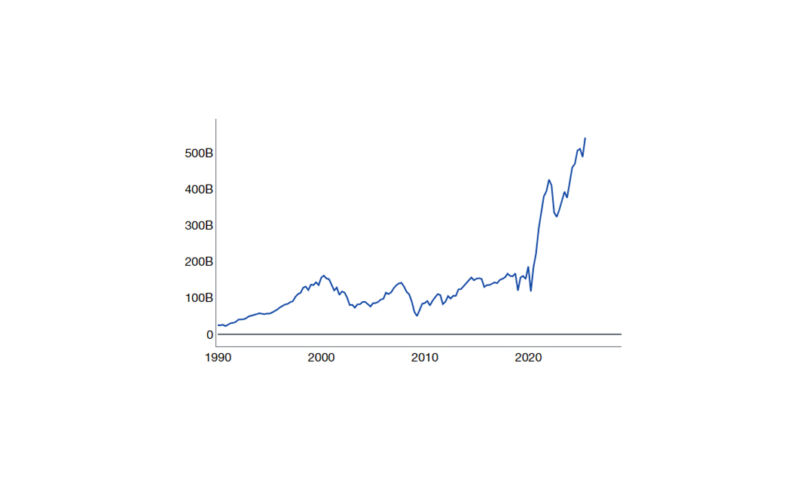
Liquidity conditions remain highly supportive. Money market fund assets entered January at all-time highs, and the first week of the year recorded the largest weekly inflow since COVID and the fourth-largest increase on record. Importantly, the second week of January then saw the largest weekly outflow since “Liberation Day”, signaling that sidelined cash is already beginning to be redeployed into risk assets to start 2026.
Money Market Funds Assets
Weekly, Since 1989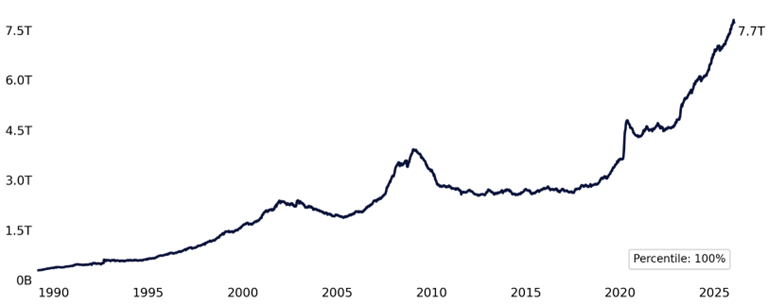
Source: Bloomberg as compiled by Citadel Securities, GMI, as of January 20th, 2026. Figures are for illustrative purposes only. Past performance figures do not guarantee future results.
Money Market Funds Assets
Weekly Change, January 2020 – January 2026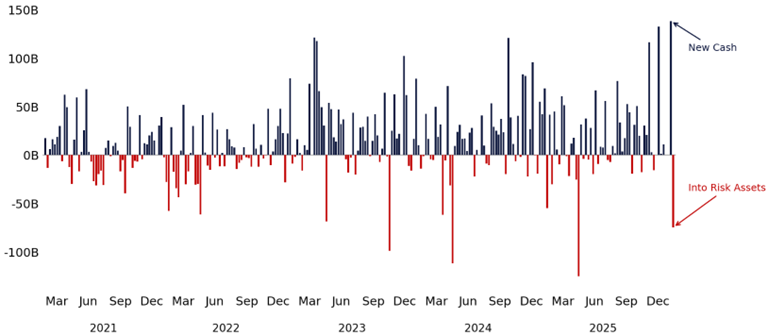
Source: Bloomberg as compiled by Citadel Securities, GMI, as of January 20th, 2026. Figures are for illustrative purposes only. Past performance figures do not guarantee future results.
As capital rotates back into risk assets, the AAII Bull-Bear Spread has risen to its highest level since November 2024, signaling improving investor confidence.
AAII Bull-Bear Spread – Highest Level in More than a Year
One-Year Lookback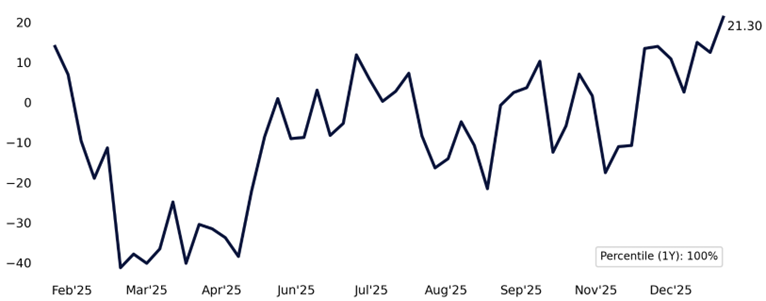
Source: Bloomberg as compiled by Citadel Securities, GMI, as of January 20th, 2026. Figures are for illustrative purposes only. Past performance figures do not guarantee future results.
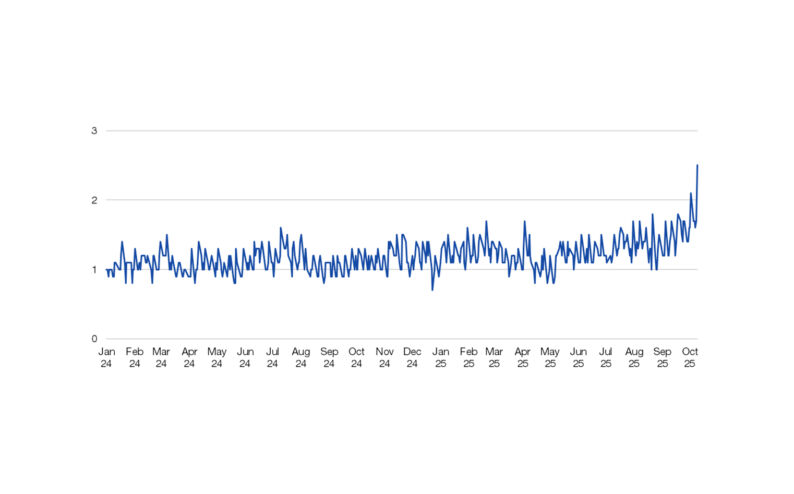
Volatility conditions continue to reinforce this behavior. One-month implied volatility remains compressed, and one-month implied correlations are near one-year lows, pointing to a market increasingly driven by single-name and sector-specific outcomes rather than synchronized index moves.
SPX Implied Volatility
One Month At-the-Money, One-Year Lookback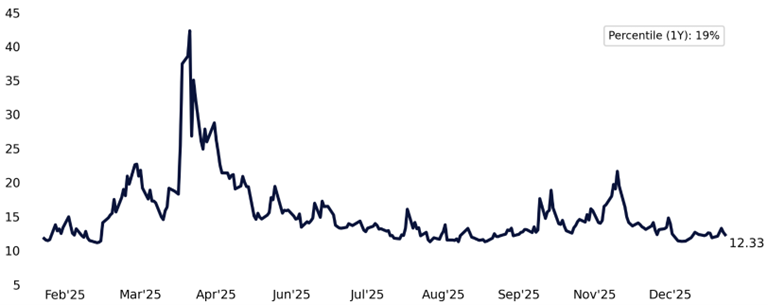
Source: Bloomberg as compiled by Citadel Securities, GMI, as of January 20th, 2026. Figures are for illustrative purposes only. Past performance figures do not guarantee future results.
Alpha > Beta. This remains a stock picker’s market.
One-Month Implied Correlation
One-Year Lookback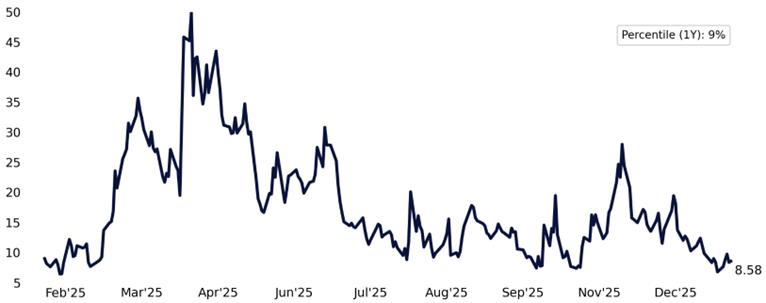
Source: Bloomberg as compiled by Citadel Securities, GMI, as of January 20th, 2026. Figures are for illustrative purposes only. Past performance figures do not guarantee future results.
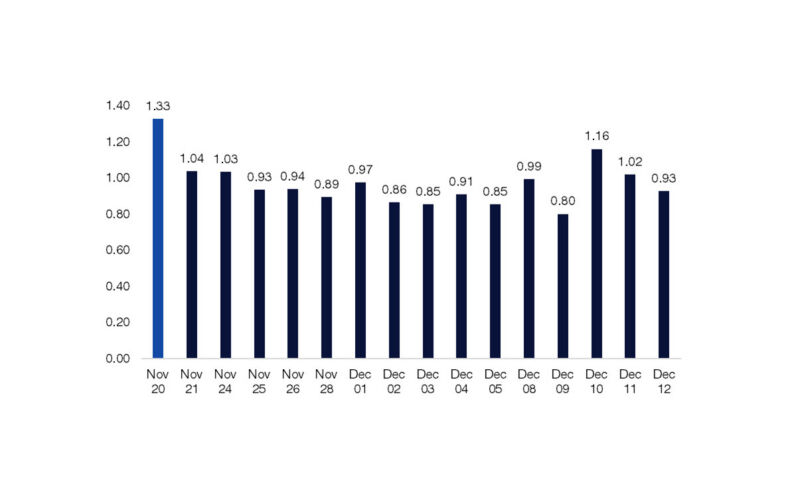
Against this backdrop, institutional client behavior has remained disciplined. Last week, institutional options flow at Citadel Securities was skewed better for sale, led by Energy and Utilities. Energy has remained topical, posting four consecutive weeks of gains, and after two weeks of prior buying, clients on the desk leaned into overwrites and hedging as skew flattened meaningfully across the sector.
Institutional Call/Put Direction Ratio
Weekly, Since January 2025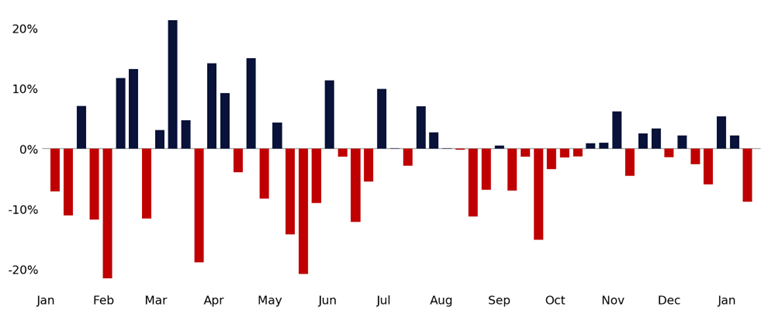
Source: Citadel Securities, GMI, as of January 20th, 2026. Figures are for illustrative purposes only. Past performance figures do not guarantee future results.
Institutional Call/Put Direction Ratio by Sector
January 12 – January 16, 2026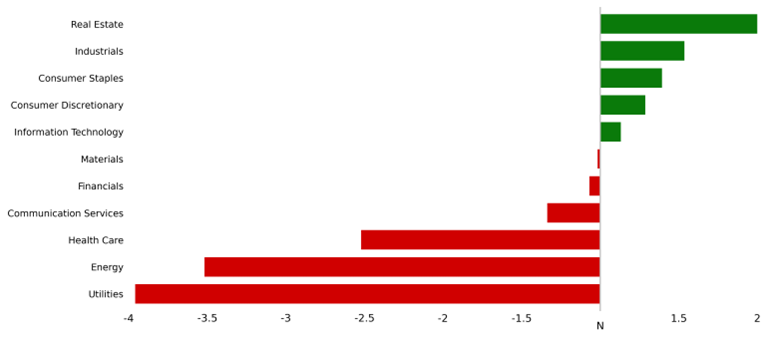
Source: Citadel Securities, GMI, as of January 20th, 2026. Figures are for illustrative purposes only. Past performance figures do not guarantee future results.
At the same time, the near-term calendar is robust. Macro releases, the peak of earnings season, and policy announcements emerging in real time are creating frequent, discrete catalysts. In this environment, optionality remains an efficient way to position into potential outcomes, particularly when headline volatility remains compressed.
SPX Implied Daily Moves (%)
January 20 – February 20, 2026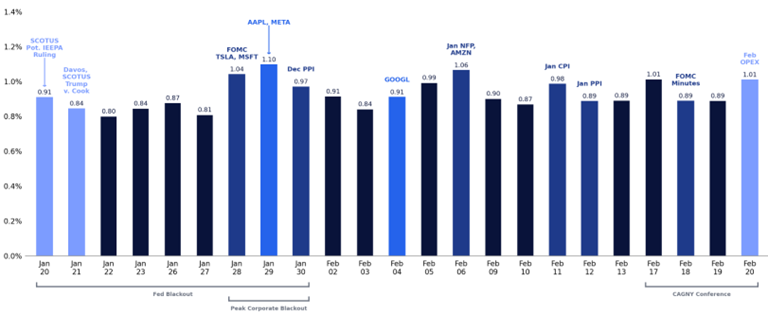
Source: Citadel Securities, GMI, as of January 20th, 2026. Figures are for illustrative purposes only. Past performance figures do not guarantee future results.
V. Profits: Earnings are in Full Swing and the Bar is Low
The earnings backdrop remains constructive, and profits continue to provide support as Q1 unfolds. Importantly, earnings are not the limiting factor for market leadership at this stage of the cycle. The S&P 500 is on track to deliver its tenth consecutive quarter of positive year-over-year earnings growth, reinforcing a stable fundamental base as markets transition toward reacceleration. The bar for Q4 earnings remains low.
SPX EPS (% YoY)
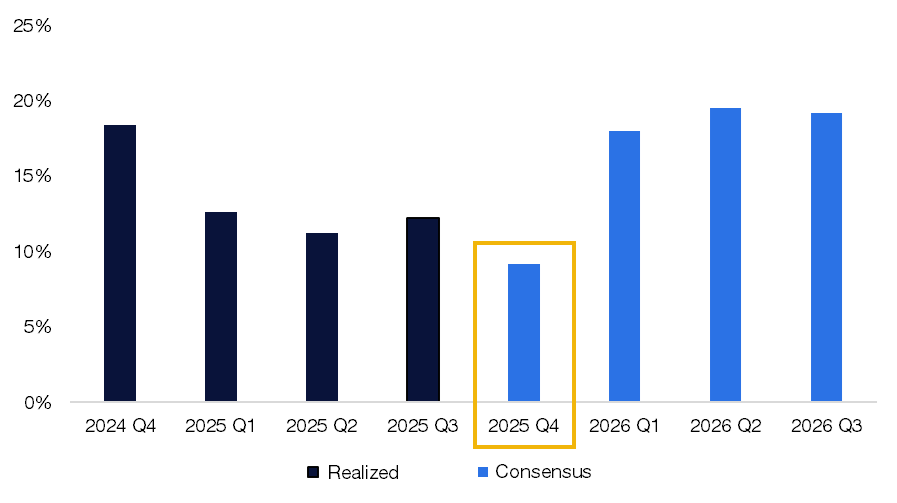
Source: Bloomberg as compiled by Citadel Securities, GMI, as of January 20th, 2026. Figures are for illustrative purposes only. Past performance figures do not guarantee future results.
The Superbowl of Q4 earnings is now moving into its busiest phase, with another 40% of SPX, 37% of NDX, and 16% of RTY set to report over the next two weeks. As results and guidance come into focus, sector-level differentiation is expected to increase further. We are also entering the peak corporate repurchase blackout window.
S&P 500 Q4 Reporting Season
Projected Blackout Window (% of Index Weight)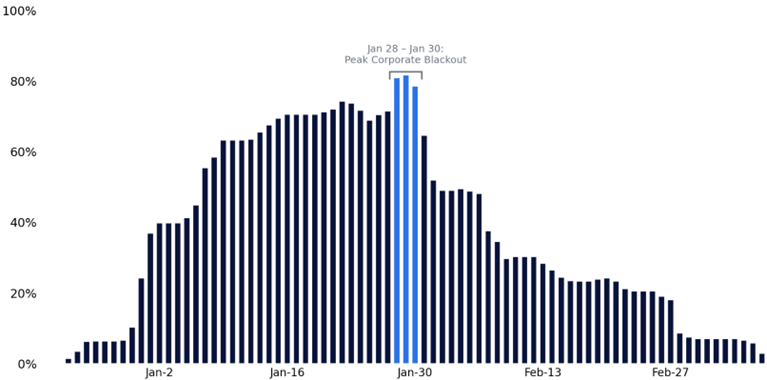
Source: Bloomberg as compiled by Citadel Securities, GMI, as of January 20th, 2026. Figures are for illustrative purposes only. Past performance figures do not guarantee future results.
What stands out is the disconnect between profits and positioning. Earnings growth has stabilized and improved across economically sensitive sectors, while index concentration remains heavily skewed toward a narrow set of mega-cap leaders. With sector weights still reflecting years of concentration, incremental improvements in earnings outside mega-cap technology have greater potential to influence relative performance. This is a key catalyst for the week of January 30th, when 33.5% of the S&P reports earnings.
Earnings by Sector – SPX Weight Reporting per Week (%)
January 20 – February 27, 2026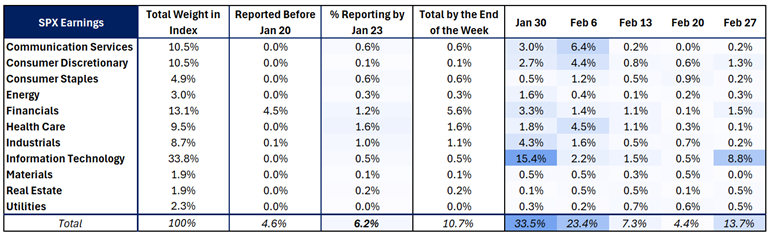
Source: Bloomberg as compiled by Citadel Securities, GMI, as of January 20th, 2026. Figures are for illustrative purposes only. Past performance figures do not guarantee future results.
Earnings by Sector – NDX Weight Reporting per Week (%)
January 20 – February 27, 2026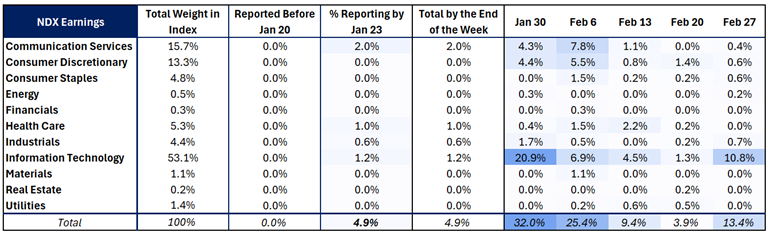
Source: Bloomberg as compiled by Citadel Securities, GMI, as of January 20th, 2026. Figures are for illustrative purposes only. Past performance figures do not guarantee future results.
Earnings by Sector – RTY Weight Reporting per Week (%)
January 20 – February 27, 2026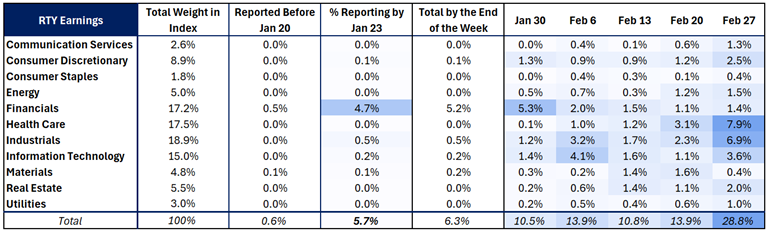
Source: Bloomberg as compiled by Citadel Securities, GMI, as of January 20th, 2026. Figures are for illustrative purposes only. Past performance figures do not guarantee future results.
VI. GMI BOTTOM LINE ⬇️
2026 GMI Framework: Recap
- Retail: conviction buying persists
- Rotation: leadership broadening
- Policy: supporting nominal growth
- Positioning: cash redeploying
- Profits: earnings supportive
New January flows are being put to work, but not indiscriminately. Retail activity remains elevated, leadership continues to broaden, and policy messaging is increasingly centered on affordability, growth, and accommodative financial conditions. At the same time, earnings provide a stable backdrop as reporting accelerates and expectations remain measured.
Liquidity is abundant, implied volatility and correlations are low, and client behavior is increasingly tactical – favoring optionality, dispersion, and selective exposure over broad index beta.
As Q1 progresses, breadth and real-economy exposure remain key drivers.
Looking ahead, the possibility of a February correction is on my radar, as early-year deployment often gives way to February weakness and can create opportunities to re-enter risk at more attractive levels. We will revisit this February flow-of-funds dynamic as it develops and we see how risk markets trade today.
SPX January Performance by Day
Since 1928 (HERE = January 20th)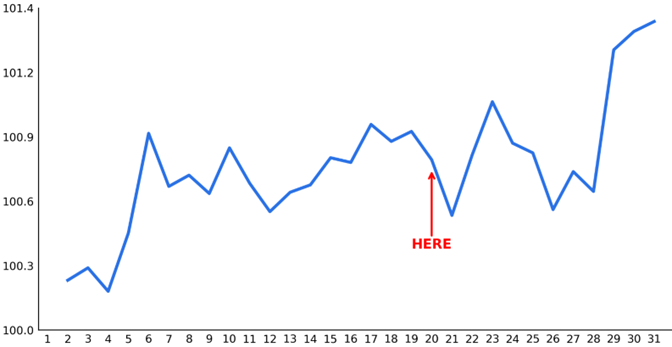
Source: Bloomberg as compiled by Citadel Securities, GMI, as of January 20th, 2026. Figures are for illustrative purposes only. Past performance figures do not guarantee future results.
Copyright © Citadel Enterprise Americas LLC or one of its affiliates. All rights reserved.
Legal Entities Disseminating this Material: This material is disseminated in the United Kingdom by Citadel Securities (Europe) Limited (“CDGE”) authorized and regulated by the Financial Conduct Authority (“FCA”) (Registered company number: 05462867); in the European Union by Citadel Securities GCS (Ireland) Limited (“CSGI”) and its Paris Branch authorized and regulated by the Central Bank of Ireland (“CBI”) (Registration Number: C173437); in Hong Kong by Citadel Securities (Hong Kong) Limited (“CDHK”) licensed by the Securities and Futures Commission of Hong Kong (“SFC”), in Japan by Citadel Securities Japan Co., Ltd (“CSJC”) registered as a Type 1 financial instruments business operator with the Japan Financial Services Agency (“JFSA”); and in the United States of America by Citadel Securities LLC (“CDRG”) registered with the Securities Exchange Commission (“SEC”), Financial Industry Regulatory Authority (“FINRA”), and Securities Investor Protection Corporation (“SIPC”), Citadel Securities Institutional LLC (“CSIN”) registered with the SEC, FINRA, and SIPC, or Citadel Securities Swap Dealer LLC (“CSSD”) registered with the SEC, Commodities Futures Trading Commission (“CFTC”), and National Futures Association (“NFA”). Unless governing law permits otherwise, you must contact a Citadel Securities entity in your home jurisdiction if you want to use our services in effecting a transaction in any financial instruments or securities, including derivatives.
FOR INSTITUTIONAL USE ONLY; FOR PROFESSIONAL CLIENTS AND ELIGIBLE COUNTERPARTIES ONLY. This material is not intended as and does not constitute investment research. Contents of this material will be strictly limited to non-specific, generic information (i.e. macro events/topics) and are not subject to the Markets in Financial Instruments directive (MiFID II) or FINRA research rules. This material does not constitute an offer, solicitation, invitation, or inducement to purchase, acquire, subscribe to, provide, or sell any financial instrument or otherwise engage in investment activity. Please see additional important disclosures, including disclosures that may be relevant to your country of residence or business at www.citadelsecurities.com/GlobalSalesTrading.
Explore
Global Market Intelligence - What We Do