-
Who We Are
- What We Do
Series: Global Market IntelligenceEquity Snapshot
By Scott Rubner
Last week brought the highest volume of inbound calls, IB chats, and post-market Zooms since I joined Citadel Securities. My message was simple: the holiday party isn’t cancelled — just delayed. The non-fundamental liquidity dynamics that have driven markets over the past two weeks can now cut both ways.
Institutional positioning has been sharply reduced heading into Thanksgiving, while retail demand has remained remarkably resilient. Seasonals kick in today.
This is the most important macro week left in 2025 — the next few sessions will set the tone for the year ahead. NVIDIA is up 5% pre-market — we’re back. Seasonals to resume. With 28 days left to trade…
It is time for a thread. 🧵
SPX – Implied Daily Move (%)
November 20 – December 12, 2025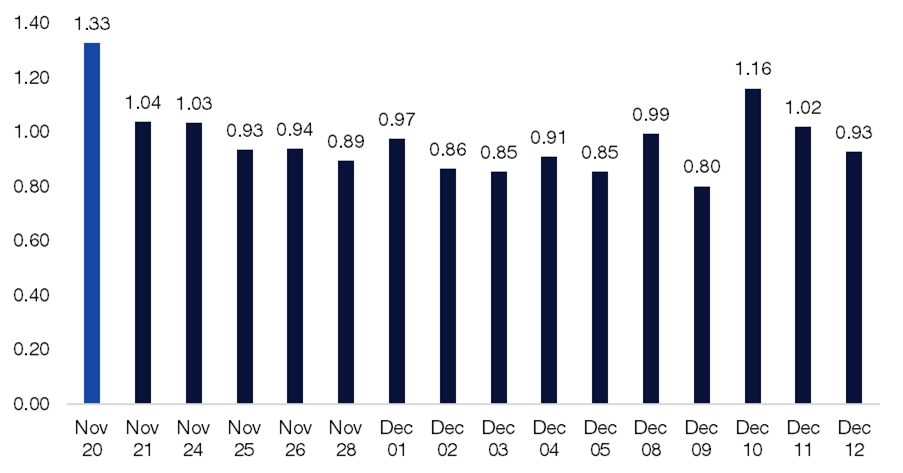
Source: Bloomberg as compiled by Citadel Securities, GMI, as of November 19th, 2025. Figures are for illustrative purposes only. Past performance figures do not guarantee future results.
SPX – Implied Weekly Move (%)
November 21 – December 19, 2025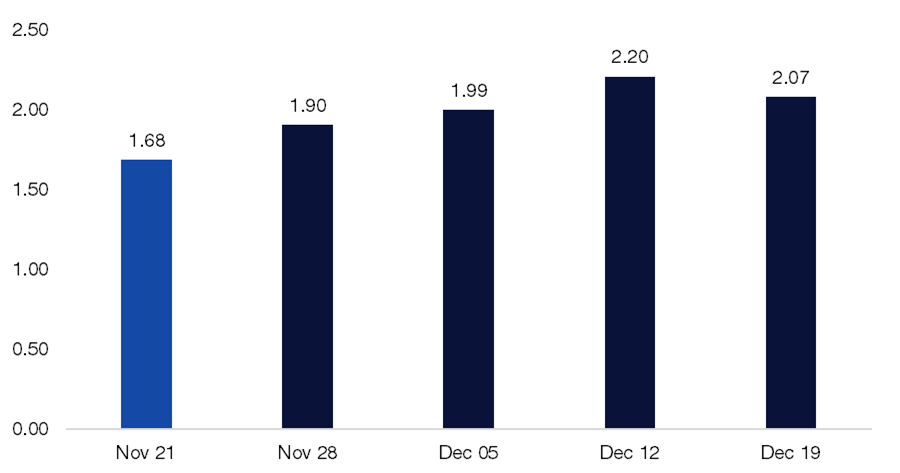
Source: Bloomberg as compiled by Citadel Securities, GMI, as of November 19th, 2025. Figures are for illustrative purposes only. Past performance figures do not guarantee future results.
I. Flow of Funds: Liquidity Dynamics (Works Both Ways)
There’s a clear supply-demand imbalance in U.S. equities, and the market has just absorbed a heavy wave of selling.
Recent price action has been driven by three dominant forces: (1) hawkish Fed rhetoric (2) reduced illiquidity tied to the government shutdown and (3) heightened position correlation linked to the hyperscaler capex and credit boom. With nearly six weeks of missing data, uncertainty has filled the vacuum, allowing competing narratives to take hold.Big picture: the S&P 500 typically experiences four 5%+ drawdowns per year. We’re currently less than 4% off all-time highs (~2% as I type this note) — and still up 34% from the April lows.
There are a few technical drivers of recent price action:
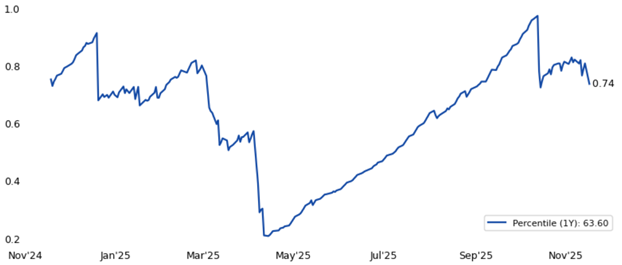
1. ETF Trading given our market execution presence: On Tuesday, ETFs represented 41% of total equity volumes — well above the 28% YTD daily average and approaching levels last seen on April 7th (~42%). Elevated ETF activity suggests active hedging of both gross and net exposures. This ranks in the 98th percentile over the past 1-year.
While gross exposure remains near all-time highs, net exposure has been meaningfully reduced through these hedges — positioning that could unwind quickly if markets stabilize this morning.
This comes after broad selling across prime desks, a notable dynamic given the scale of levered ETF activity and the synthetic short-gamma effects generated by their rebalance flows.
ETF Share of Volume vs. SPX – Near 1-Year Highs
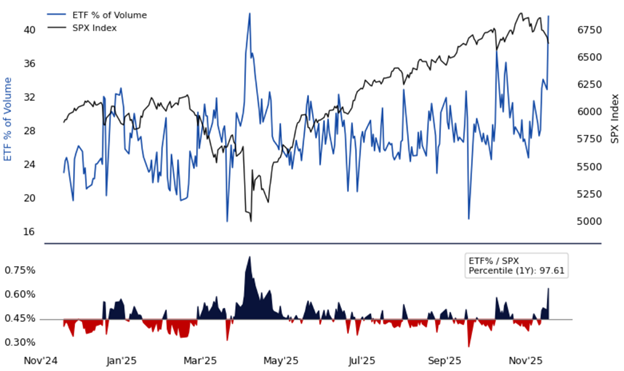
Source: Citadel Securities, GMI, as of November 20th, 2025. Figures are for illustrative purposes only. Past performance figures do not guarantee future results.
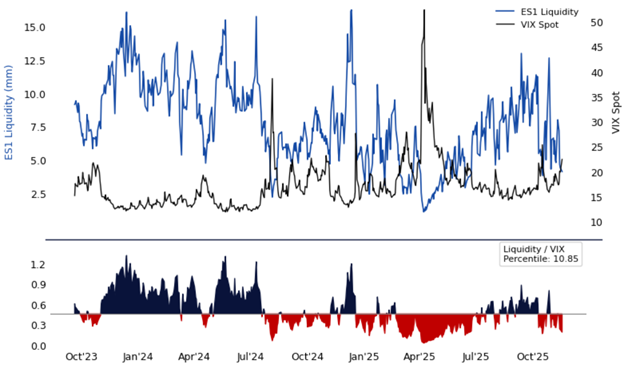
2. Risk Transfer: E-mini top-of-book depth has deteriorated sharply on Tuesday, now around $4 million versus a 1-year average of $10 million — a 60% decline. The thinner book underscores reduced market depth and lower risk transfer, leaving price action more volatile and flow-driven.
Liquidity or “Center Book” hedging tool ranked in the 10th percentile in the past 1-year and is highly correlated to moves in volatility.
ES1 Liquidity Collapsing as Volatility Rises
Source: Citadel Securities, GMI, as of November 20th, 2025. Figures are for illustrative purposes only. Past performance figures do not guarantee future results.
3. Systematic Supply: Re-Levering Potential?
Systematic Supply: If you were an ORCL 5-year CDS specialist last week, you’re a CTA specialist this week. This has been peak CTA question week by any measure. As futures trade higher this morning, we’re now well above every trigger level I’ve been tracking — meaning systematic supply is fading for now.
The market has clearly entered a de-risking phase, with CTA, Vol-Control, and Risk Parity funds all cutting exposure. These mechanical outflows are likely to stay heavy over the next few days, then fade away completely. Our 10% vol-targeting model has already reduced exposure by more than 20%.
SPX Exposure of Vol-Targeting with 10% Risk
Source: Bloomberg as compiled by Citadel Securities, GMI, as of November 20th, 2025. Figures are for illustrative purposes only. Past performance figures do not guarantee future results.
4. Demand for Protection and VIX Inversion Signal
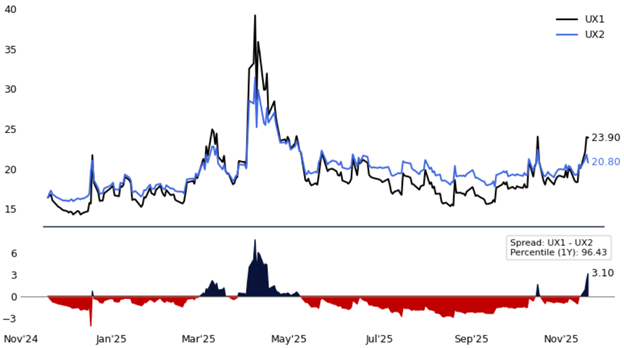
The VIX curve has inverted, now deeper than at any point since Liberation Day, reflecting intense demand for downside protection.
- There have been 23 prior instances where UX1 > UX2.
- Average duration of inversion: ~10 days.
- Vols → Lower: No surprise here — VIX spot typically reverts lower on a T+1, T+5, T+10, and T+30 basis following an inversion.
- Spot → Higher: SPX and NDX historically move higher on average by the end of the inversion.
We’re already starting to see this pattern emerge — VIX Index is down -13% as I type.
I expect downside hedges to be quickly unwound (i.e. delta to buy) as this plays through.
VIX Backwardation – Most Extreme Since Liberation Day
Source: Bloomberg as compiled by Citadel Securities, GMI, as of November 20th, 2025. Figures are for illustrative purposes only. Past performance figures do not guarantee future results.
5. Bearish Investor Sentiment
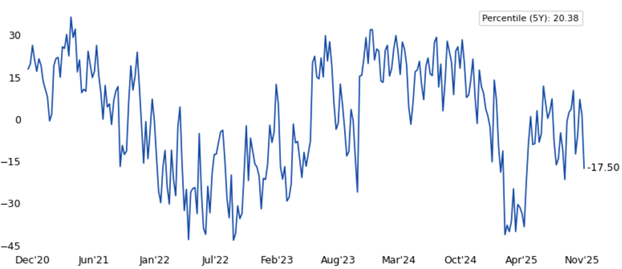
Market Sentiment: Indicators continue to flash fear across the board. CNN’s Fear & Greed Index has dropped to 9, its lowest level since April and was firmly in extreme fear territory. The AAII Bull-Bear Spread has also flipped back into negative territory. The sentiment feedback loop turned sharply negative — and fast.
AAII Bull-Bear Index – Back Near October Lows
Source: Bloomberg as compiled by Citadel Securities, GMI, as of November 20th, 2025. Figures are for illustrative purposes only. Past performance figures do not guarantee future results.
6. 2025 Calendar (One of the Most Important Parts of the Story)
There are just 28 trading days left in the year — with next week shortened to 3.5 sessions ahead of Thanksgiving — and no one wants to give back any performance after grinding higher since Liberation Day.
The larger story is already in motion: few investors were positioned to play offense into a potential unwind this late in the year.
II. Factor Rotation and Momentum Unwinds
Market Rotation – Momentum Unwind Nearing Completion
There’s been real rotation beneath the surface — we’re likely in the eighth inning of a nine-inning momentum unwind. Long/short momentum strategies are down roughly 10% over the past week, as leadership continues to shift away from the year’s winners. Citadel Securities clients have rotated into broadening-out trades (493 > 7).
Across the 11 S&P sectors, Tech, Communication Services, and Utilities still lead year-to-date, but month-to-date tells a very different story. The YTD laggards — Healthcare, Energy, and Consumer Staples — have taken the lead, and the SPX vs. SPW spread underscores that shift (SPX -2.9% MTD vs. SPW -1.7%).
Value and active managers have had a great few weeks compared to the index: only 19% of mutual funds were outperforming their benchmarks a month ago, but performance has improved sharply as market breadth widened.
Meanwhile, thematic and speculative names have been hit hard — Rare Earths, Quantum, Nuclear Power, Crypto, and Drones are down 20%+ over the past month, while Refiners, Pharma, Energy, and Commodities are up roughly 5%. I’d expect a near-term reversal, with momentum likely to rally sharply today.
This week wraps up Q3 corporate earnings, and the second “P” of profits has been exceptional and earnings revisions strong.
The buyback desk goes BRR with >$5B worth of daily demand until December.
Earnings by Sector – SPX Weight Reporting per Week (%)
November 21 – December 26, 2025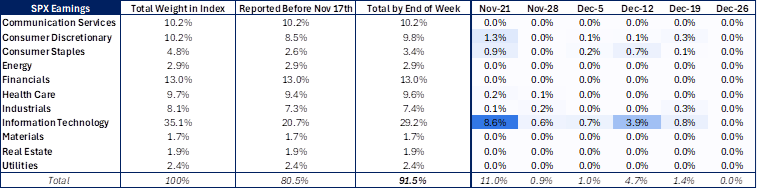
Source: Bloomberg as compiled by Citadel Securities, GMI, as of November 20th, 2025. Figures are for illustrative purposes only. Past performance figures do not guarantee future results.
Earnings by Sector – NDX Weight Reporting per Week (%)
November 21 – December 26, 2025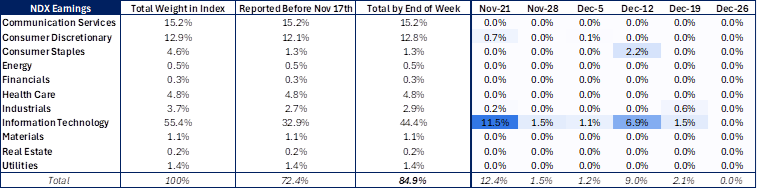
Source: Bloomberg as compiled by Citadel Securities, GMI, as of November 20th, 2025. Figures are for illustrative purposes only. Past performance figures do not guarantee future results.
Earnings by Sector – RTY Weight Reporting per Week (%)
November 21 – December 26, 2025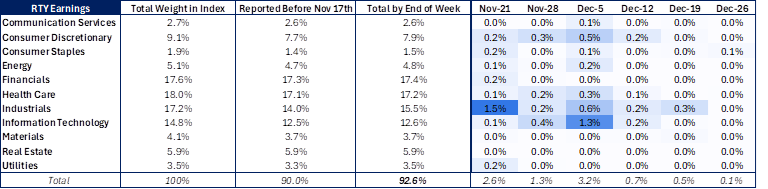
Source: Bloomberg as compiled by Citadel Securities, GMI, as of November 20th, 2025. Figures are for illustrative purposes only. Past performance figures do not guarantee future results.
III. Citadel Securities Client Flows
We continue to see strong client engagement across markets, consistent with our market-leading retail presence.
Retail flow has been decisively skewed to the buy side — both over the past four weeks and consistently since Liberation Day. Retail investors did not panic through recent volatility and remain one of the most important sources of demand in 2025. They have absorbed mechanical, non-fundamental supply and continue to hold constructive positioning.This cohort also remains the primary driver of call demand — we’ve now recorded 29 consecutive weeks of net call buying, including every day this week.
I saw several “retail is selling” from global wall street, we did not see this across our trading desks.
Retail Options – Call / Put Direction Ratio
January – November 2025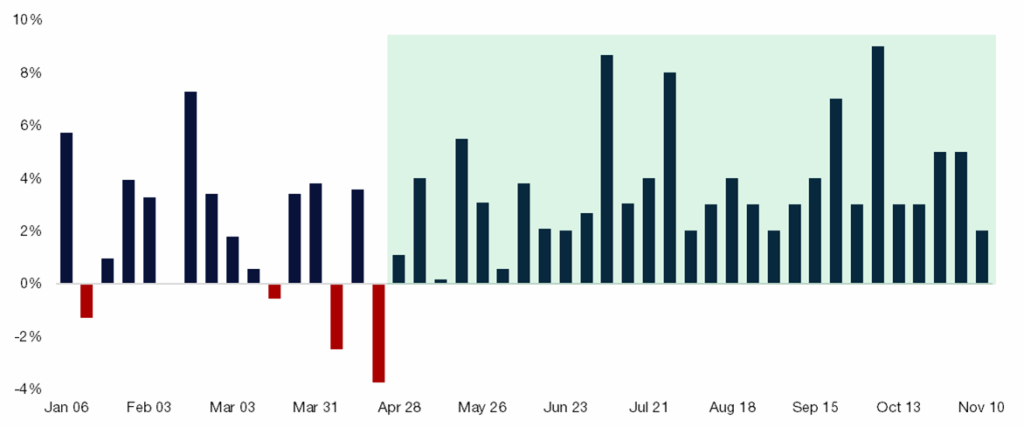
Source: Citadel Securities, as of November 20th, 2025. Figures are for illustrative purposes only. Past performance figures do not guarantee future results.
Retail Cash Equities – Net Notional (Std Dev)
January – November 2025
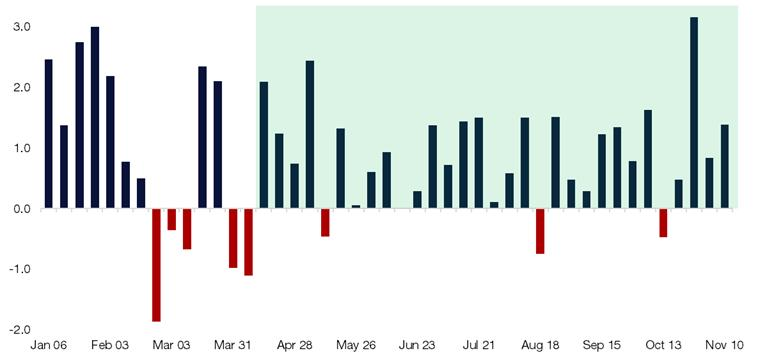
Source: Citadel Securities, as of November 20th, 2025. Figures are for illustrative purposes only. Past performance figures do not guarantee future results.Institutional Options – Call/Put Direction Ratio
January – November 2025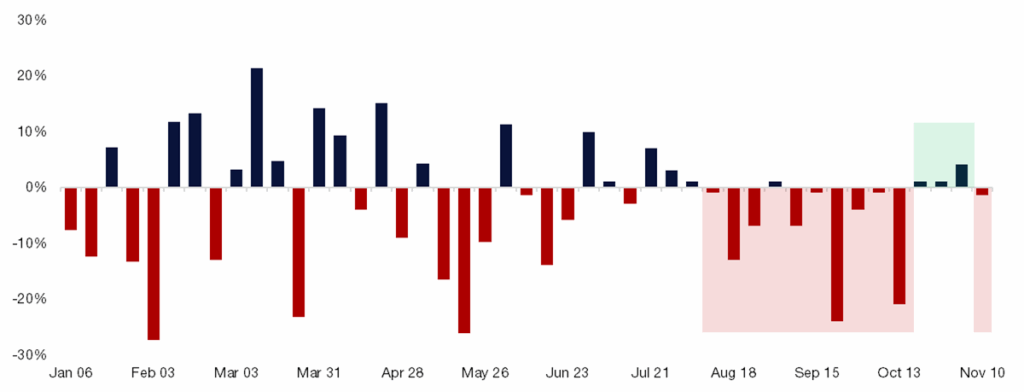
Source: Citadel Securities, as of November 20th, 2025. Figures are for illustrative purposes only. Past performance figures do not guarantee future results.
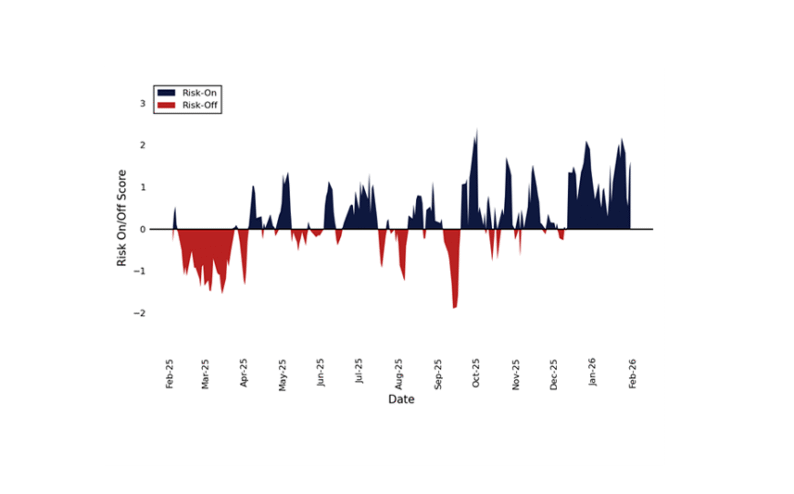
Our Citadel Securities Retail RORO Indicator flipped to sell on the Mag7, but better to buy across the 50 most liquid names.
Retail RORO Indicator – 50 Most Liquid
Positive = Risk On | Negative = Risk Off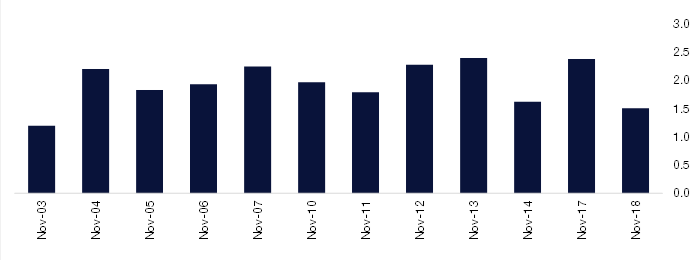
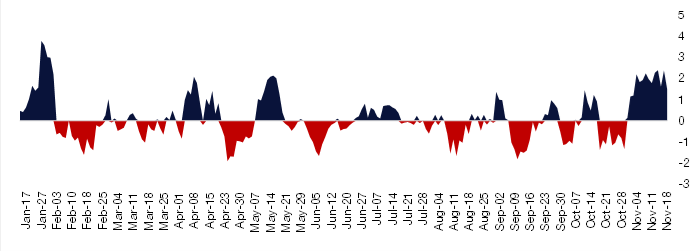
Source: Citadel Securities, as of November 18th, 2025. Figures are for illustrative purposes only. Past performance figures do not guarantee future results.
IV. AI Sentiment Shift
NVDA Earnings: A Macro Event, Not Just a Stock Story
Heading into the print, NVDA was down 12% from its all-time high — a $630 billion market-cap drawdown — with options pricing a ~7% move, implying nearly $315 billion in potential market-cap swing, larger than 476 S&P 500 constituents. Shares are now up 5% post-earnings after another strong quarter and solid guidance.
Given NVDA’s weight — 8% of the SPX and 10% of the NDX — this was never just one company’s report; it was the macro event of the week.
With this print, the AI capex narrative remains firmly intact, capping a stellar Q3 earnings season defined by 13% EPS growth (vs. 9% expected) and an 85% beat rate. NVDA cleared the bar — but the question now is whether AI leadership can sustain into year-end, or if rotation continues to broaden market participation.
The Mag7 Effect: The Mag7 now accounts for over 35% of the S&P 500, and the top 10 names comprise 40% of the index — concentration risk remains at historic highs.
SPX – Weighting of Mag7 Holdings
Weekly, 1995-2025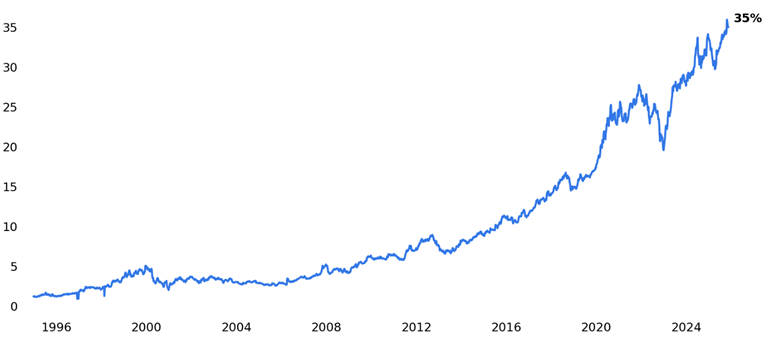
Source: Bloomberg as compiled by Citadel Securities, GMI, as of November 19th, 2025. Figures are for illustrative purposes only. Past performance figures do not guarantee future results.
SPX – Weighting of Top 10 Holdings
Weekly, 1995-2025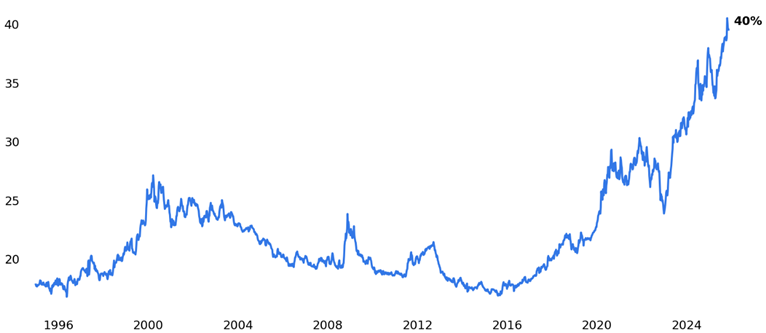
Source: Bloomberg as compiled by Citadel Securities, GMI, as of November 19th, 2025. Figures are for illustrative purposes only. Past performance figures do not guarantee future results.
SPX – Weighting of Non- Mag7 Holdings
Weekly, 1995-2025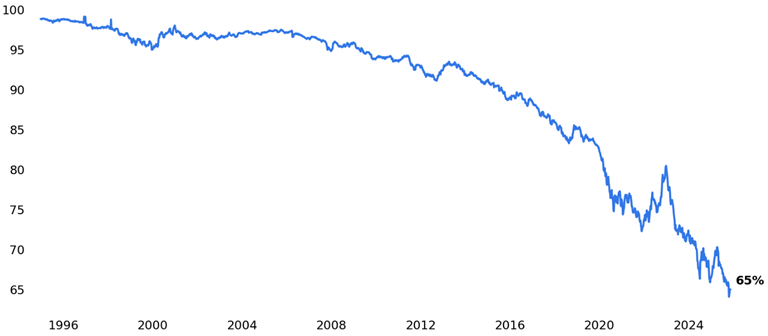
Source: Bloomberg as compiled by Citadel Securities, GMI, as of November 19th, 2025. Figures are for illustrative purposes only. Past performance figures do not guarantee future results.
V. Economic Data this morning: NFP is Back
Policy Watch: Data Returns, But Not Cleanly
Equities have just absorbed a major shift in December WIRP, now pricing a ~30% probability of interest rate cut. (Listen to Frank Flight discuss the final “P” — Policy — on our call.)
After weeks of data blackout and delays, today’s September NFP report finally gives markets something tangible — though hardly clean. With missing October inputs and delayed survey data, this print will be more about tone than precision, consistent with recent BLS releases.
Timing matters: the Fed’s next meeting is December 10, and as of today’s update, the October jobs report has been officially canceled, with November’s rescheduled to December 16. That leaves October JOLTS (Dec 9) as the only labor datapoint before the FOMC.
Good data = good for stocks.
Bad data = … still good for stocks?Consensus: scattered. Estimates range from +25k to +105k, clustering between +37k and +75k, with a mean of +56k. Keep an eye on revisions, which have been as market-moving as the headline in recent months.
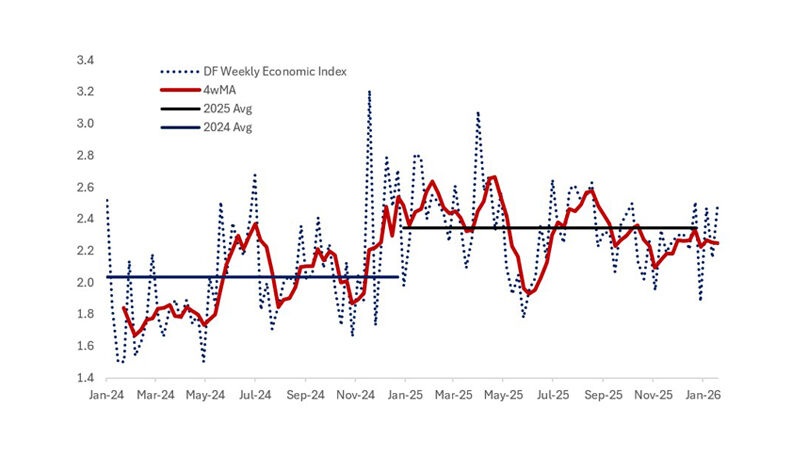
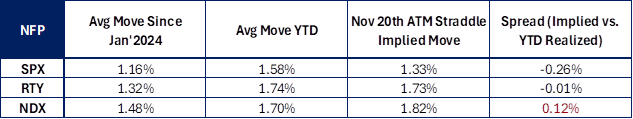
NFP Implied Moves – NDX Screening Rich vs. YTD Average Realized with NVDA
Source: Bloomberg as compiled by Citadel Securities, GMI, as of November 19th, 2025. Figures are for illustrative purposes only. Past performance figures do not guarantee future results.
VI. Wall of Worry: Which Worry Do Equities Overcome First?
This is the wall of worry currently on investors’ minds. The key question: which concerns are tactical, and which are structural as we look toward 2026?
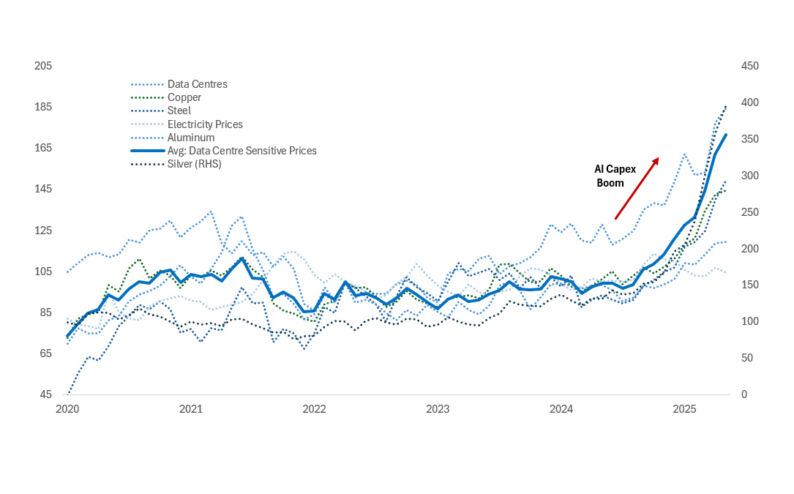
- AI CapEx Mania and the Credit Undercurrent: AI investment narratives have reached saturation, bordering on self-parody. A cooling period in sentiment could ultimately favor industry leaders. Meanwhile, tighter funding conditions are quietly surfacing beneath the credit market’s calm exterior.
- Valuations Remain Stretched: Equity valuations look expensive by nearly every measure, and executives are increasingly acknowledging this. Markets remain priced for perfection amid fading earnings momentum.
- Fed Still Leaning Hawkish: Fed Funds Futures imply a 29% probability of a 25bp cut at the December meeting (down from >100% one month ago). The key debate: how much further can rate-cut expectations decline before data justify a genuine policy pivot?
- Repo Market Stress, Liquidity Tightens: Liquidity is emerging as the unspoken risk factor. The Treasury General Account drain continues to pressure funding markets, with repo stress now a daily talking point on trading desks.
- U.S. Election Watch – Sentiment Risk Ahead: The upcoming election remains a secondary concern, but political noise has a way of creeping into markets. Expect rising volatility as rhetoric heats up.
- Crypto Deleveraging, Positioning for Rebound: Crypto assets have started to recover from the overnight lows. This is what I have been watching every night to determine risk sentiment.
- Private Credit and Early Signs of Strain: Private credit markets are showing early cracks. Any deterioration could have broader implications for corporate funding.
- Breadth Breakdown – Concentration at Extremes: SPX has effectively become a concentration trade: roughly 40% of flows are directed toward the top 10 names on both the buy and sell side. This narrowing breadth underscores fragility beneath surface stability.
- The K-Shaped Economy and Divergent Consumers: The divide between high- and low-income consumers continues to widen. Long SPX vs. short low-end retail remains a clean macro trade capturing consumer bifurcation.
- Data Blackout and Policy Blind Spots: While the data blackout is ending as the government reopens, key releases like October CPI and jobs data may never be published, leaving the Fed without a clean read on the economy heading into December. With FOMC members divided, even a December 10th rate cut could come with more hawkish guidance.
GMI Bottom Line: The Week That Decides the Year
The holiday party isn’t cancelled — it’s just been moved to a bar.
What we’re seeing looks like a healthy technical correction, setting the stage for an eventual S&P 500 push toward 7,000.NVIDIA delivered — a beat, defend, and guide higher — likely sparking a rush to cover hedges and rebuild exposure into year-end. The AI trade remains intact, even as rotation and broadening leadership continue beneath the surface.
Flow-of-funds dynamics begin to improve next week as we head into Thanksgiving and thinner liquidity. If markets stabilize, there’s substantial covering still to come across futures and options, and the corporate buyback window reopens fully — roughly $6 billion in daily demand through the turn.
Looking ahead to 2026, the macro backdrop is increasingly supportive of equities, underpinned by an expected reacceleration in global growth.
SPX November and December, Performance by Day.
Since 1928 (HERE = November 20th)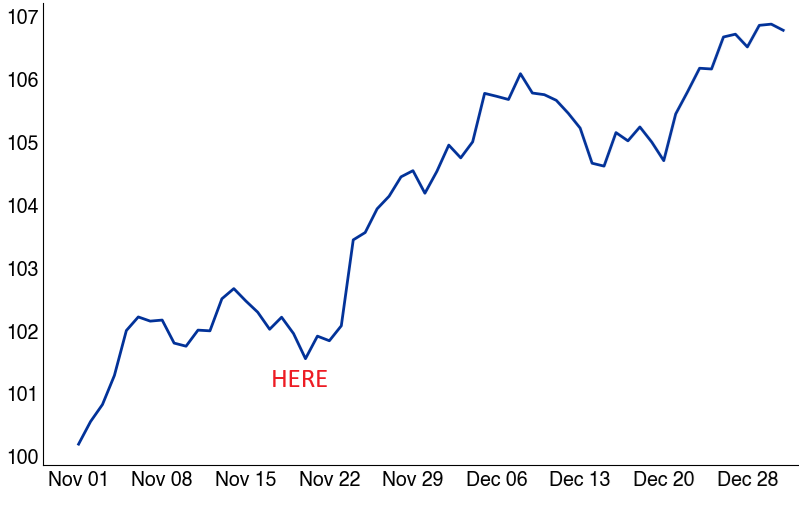
Source: Bloomberg as compiled by Citadel Securities, GMI, as of November 19th, 2025. Figures are for illustrative purposes only. Past performance figures do not guarantee future results.
Copyright © Citadel Enterprise Americas LLC or one of its affiliates. All rights reserved.
Legal Entities Disseminating this Material: This material is disseminated in the United Kingdom by Citadel Securities (Europe) Limited (“CDGE”) authorized and regulated by the Financial Conduct Authority (“FCA”) (Registered company number: 05462867); in the European Union by Citadel Securities GCS (Ireland) Limited (“CSGI”) and its Paris Branch authorized and regulated by the Central Bank of Ireland (“CBI”) (Registration Number: C173437); in Hong Kong by Citadel Securities (Hong Kong) Limited (“CDHK”) licensed by the Securities and Futures Commission of Hong Kong (“SFC”), in Japan by Citadel Securities Japan Co., Ltd (“CSJC”) registered as a Type 1 financial instruments business operator with the Japan Financial Services Agency (“JFSA”); and in the United States of America by Citadel Securities LLC (“CDRG”) registered with the Securities Exchange Commission (“SEC”), Financial Industry Regulatory Authority (“FINRA”), and Securities Investor Protection Corporation (“SIPC”), Citadel Securities Institutional LLC (“CSIN”) registered with the SEC, FINRA, and SIPC, or Citadel Securities Swap Dealer LLC (“CSSD”) registered with the SEC, Commodities Futures Trading Commission (“CFTC”), and National Futures Association (“NFA”). Unless governing law permits otherwise, you must contact a Citadel Securities entity in your home jurisdiction if you want to use our services in effecting a transaction in any financial instruments or securities, including derivatives.
FOR INSTITUTIONAL USE ONLY; FOR PROFESSIONAL CLIENTS AND ELIGIBLE COUNTERPARTIES ONLY. This material is not intended as and does not constitute investment research. Contents of this material will be strictly limited to non-specific, generic information (i.e. macro events/topics) and are not subject to the Markets in Financial Instruments directive (MiFID II) or FINRA research rules. This material does not constitute an offer, solicitation, invitation, or inducement to purchase, acquire, subscribe to, provide, or sell any financial instrument or otherwise engage in investment activity. Please see additional important disclosures, including disclosures that may be relevant to your country of residence or business at www.citadelsecurities.com/GlobalSalesTrading.
Explore
Market Insights - What We Do