-
Who We Are
- What We Do
Series: Global Market IntelligenceFebruary
By Scott Rubner
The January Effect saw robust demand across both retail and institutional channels at Citadel Securities. Heavy capital deployment, active rotation, and elevated participation provided strong early-year support for risk assets, allowing markets to absorb headline volatility without meaningful drawdowns. US equities are at an all-time high today and Citadel securities client flows are hitting records. Citadel Securities retail net cash flows to start the year are off to a record start, running just about 50% higher YTD than the next highest year (2021).
February marks a transition to a more nuanced technical regime. As the initial deployment impulse fades, market focus shifts from the speed of inflows to the durability of support. Selectivity rises, positioning matters more, and flow dynamics become increasingly decisive as the month progresses. I have higher first, then lower vibes for US equities.
2R’s and 3P’s are the main drivers of US equities: Updated GMI framework below.
It is time for a thread.
🧵
I. Retail: Demand Remains Elevated
Retail activity in January was exceptional. Demand at Citadel Securities across both cash equities and options reached record January levels, with average daily net inflows and contracts well above historical norms. Demand was highly directional and concentrated in a narrow set of high-beta, thematic exposures – including Rare Earths, Nuclear Power, Drones, Crypto-sensitive equities, and Precious Metals – which emerged among the strongest performers year-to-date.
Retail behavior was not just active, but persistent. Retail traders at Citadel Securities were net buyers of cash equities and directionally skewed better to buy in options each week so far this year. Cumulatively, January net inflows grew more than 50% versus January 2025, underscoring the scale of early-year demand. Options activity also reached new January highs, with retail traders on our platform transacting 22% more options on average each day vs. January 2025, more than 50% above the January 2020-2025 average. Together, these flows reinforced early-year momentum and amplified price moves in favored names.
January Retail Cash Net Inflows – Highest on Record
January Average Daily Net Inflows, Indexed to 2020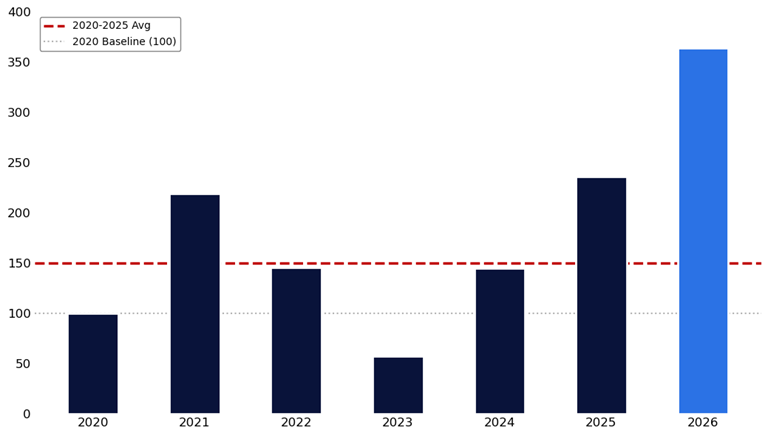
Source: Citadel Securities, GMI, as of February 3rd, 2026. Figures are for illustrative purposes only. Past performance figures do not guarantee future results.
January Retail Options Volumes – Highest on Record
January Average Daily Contracts, Indexed to 2020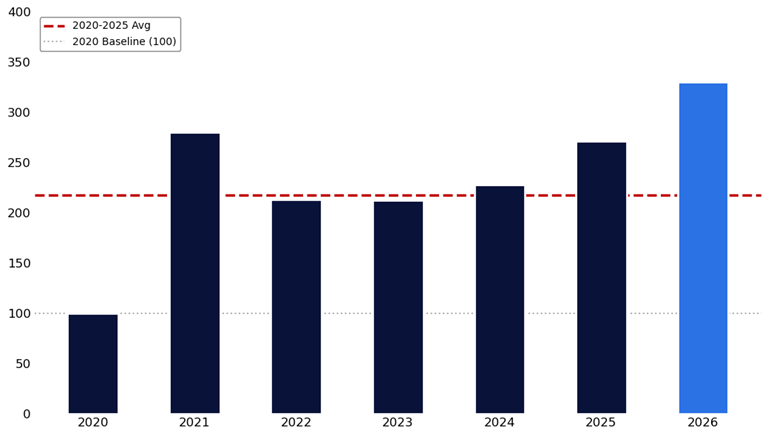
Source: Citadel Securities, GMI, as of February 3rd, 2026. Figures are for illustrative purposes only. Past performance figures do not guarantee future results.
Retail Risk-On/Risk-off Indicator – 95th percentile today.
One-Year Lookback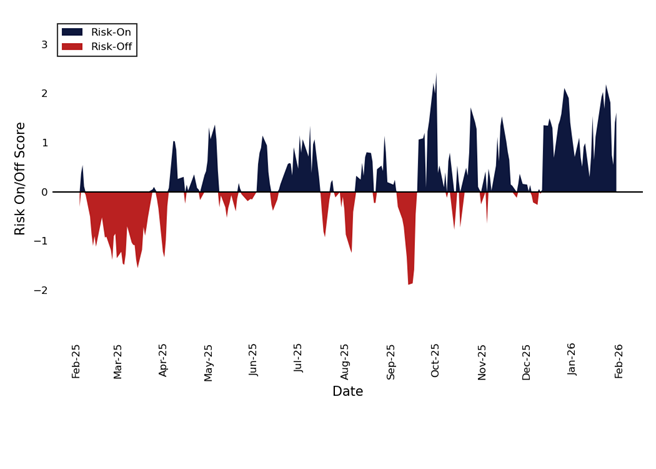
Citadel Securities’ Proprietary Retail Risk-On/Risk-Off Indicator based on Retail Flow Dynamics over the Past Year
Source: Citadel Securities, as of February 3rd, 2026. Figures are for illustrative purposes only. Past performance figures do not guarantee future results.
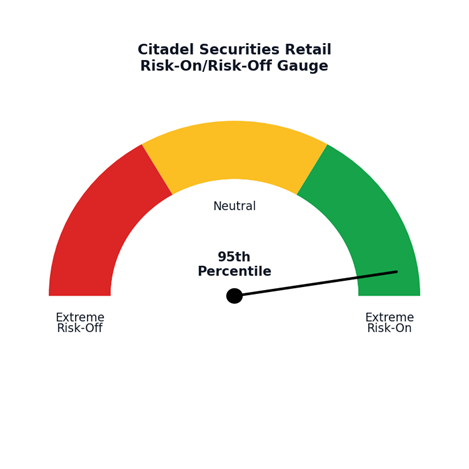
Citadel Securities’ Proprietary Retail Risk-On/Risk-Off Gauge based on Score’s Distribution Percentile
Source: Citadel Securities, as of February 3rd, 2026. Figures are for illustrative purposes only. Past performance figures do not guarantee future results.
Retail Call/Put Direction Ratio – Skewed Better to Buy in 39 of the Past 40 Weeks
Weekly, Since January 2025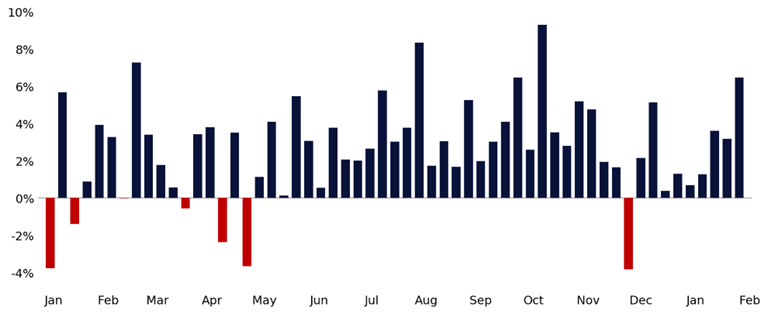
Source: Citadel Securities, GMI, as of February 3rd, 2026. Figures are for illustrative purposes only. Past performance figures do not guarantee future results.
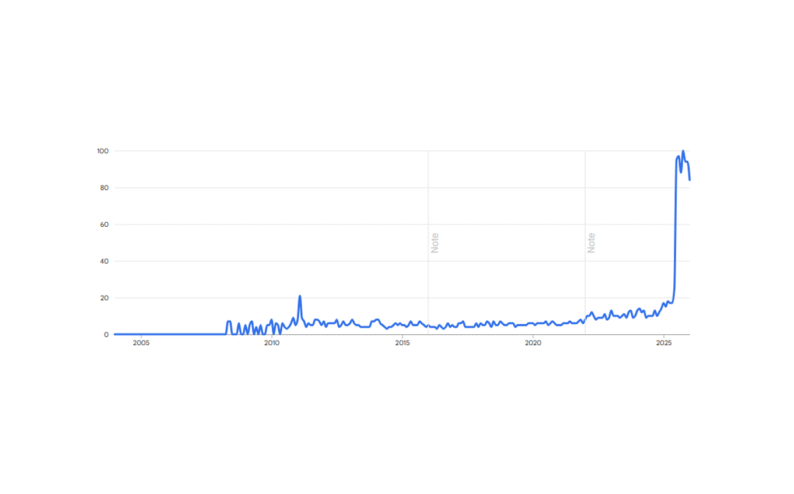
One area where retail participation stood out was precious metals. Retail activity in the space was extremely elevated relative to historical norms, coinciding with a period of exceptional volatility. From January 2nd through January 29th, gold rallied roughly 25% and silver surged approximately 61%, before reversing sharply on Friday (January 30th), with gold falling 9% and silver declining 26% – the latter marking silver spot’s largest one-day selloff on record.
This surge in activity was most visible in the options market, with average daily retail volume in precious metals options on our platform running at nearly 7x the 2023 baseline.
Precious Metals Retail Options ADV
Yearly, Normalized to 2023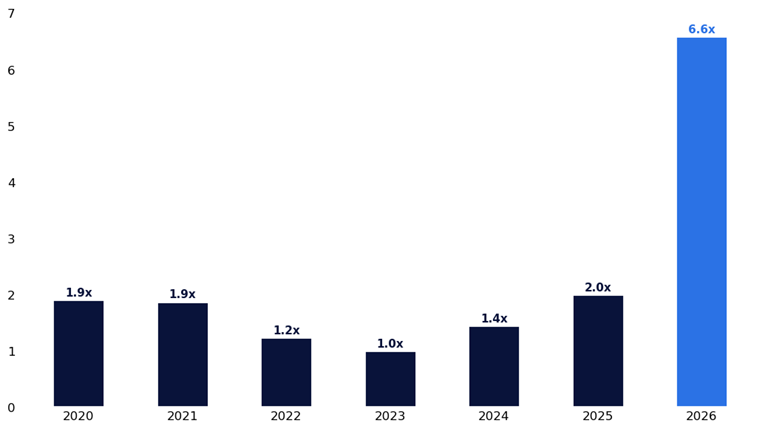
Source: Citadel Securities, GMI, as of February 3rd, 2026. Figures are for illustrative purposes only. Past performance figures do not guarantee future results.
As February begins, the key question is not whether retail demand disappears, but whether it can sustain January’s record pace. Many of the themes that led in January are now extended and increasingly crowded, making them more sensitive to any moderation in flows or shifts in sentiment.
Historically, retail cash activity at Citadel Securities has tended to moderate from January into February, with seasonal patterns since 2017 showing a consistent decline in net notional following the early-year surge.
Recent price action suggests this risk is becoming more relevant. Periods of rotation back toward large-cap growth and defensives have coincided with pressure in retail-led themes, underscoring their vulnerability if incremental buying slows.
The equity and options market structure is changing. Yesterday was a good example.
On the options side, it is worth noting that retail activity may remain elevated as Monday and Wednesday expiries in Mag7 names, AVGO, and IBIT began trading yesterday (February 2nd) as true 0DTE options, extending a product set where retail participation has historically been most concentrated. For example, after just ONE day with 0DTEs trading in TSLA (one of the most active stocks in the options market), more than 44% of yesterday’s options volume was in February 2nd (0DTE) expiry.
As highlighted in yesterday’s Retail Detail: January 2026 Overview, we anticipate the addition of Monday/Wednesday expiries will broaden the window for tactical single-stock trading by retail, redistribute activity across the week, and provide a major tailwind for volume growth starting in February.
Retail Cash – Proportion of Net Notional by Month
January 2017 – December 2025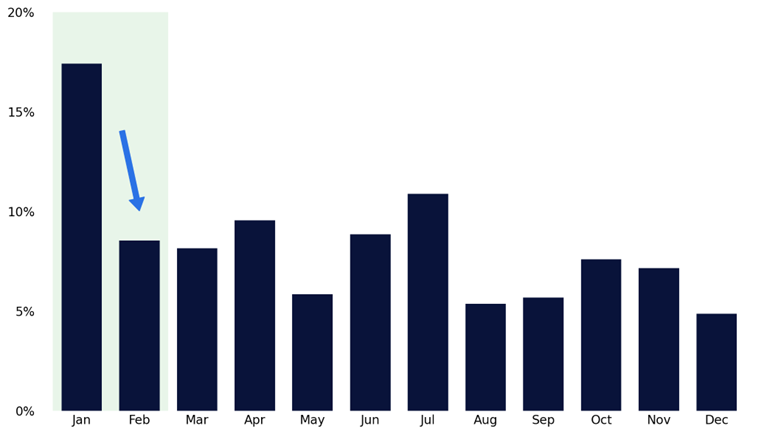
Source: Citadel Securities, GMI, as of February 3rd, 2026. Figures are for illustrative purposes only. Past performance figures do not guarantee future results.
Single-Stock 0DTEs Already Represent a Meaningful Share of Options Volume
February 2nd Expiry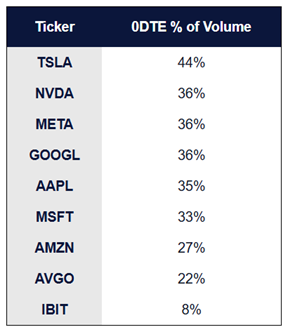
Source: Bloomberg as compiled by Citadel Securities, GMI, as of February 3rd, 2026. Figures are for illustrative purposes only. Past performance figures do not guarantee future results.
II. Rotation: January Leaders Face a February Test
Rotation was a defining feature of January and I think this dynamic will continue into the mid-term elections.
Market leadership shifted away from narrow, long-duration growth and toward cyclicals, real assets, and equal-weight exposure, even as headline indices remained supported.
Energy, Materials, Consumer Staples, and Industrials led performance to start the year, while Technology and Financials lagged. This reflected improving breadth beneath the surface and a broader participation profile to start the year.
SPX Sector Performance
January 2026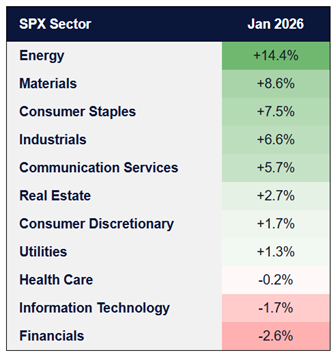
Source: Bloomberg as compiled by Citadel Securities, GMI, as of February 3rd, 2026. Figures are for illustrative purposes only. Past performance figures do not guarantee future results.
Sector Contribution to SPX Move
January 2026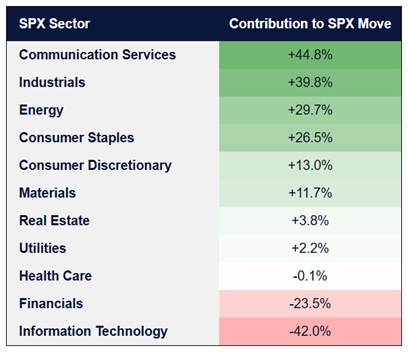
Source: Bloomberg as compiled by Citadel Securities, GMI, as of February 3rd, 2026. Figures are for illustrative purposes only. Past performance figures do not guarantee future results.
As February begins, focus shifts from the breadth of January’s gains to the durability of leadership. While the broader rotation trend remains intact, recent price action suggests early signs of consolidation as incremental flows become more selective.
That shift is evident in small-cap relative performance. The RTY/SPX ratio reached a one-year high on January 22nd, reflecting strong early-year leadership from smaller-cap, higher-beta exposure.
Since then, the ratio has eased back to the 92nd percentile of its one-year range, as investors began to reintroduce exposure to large-cap technology ahead of earnings.
RTY vs. SPX Performance
One-Year Lookback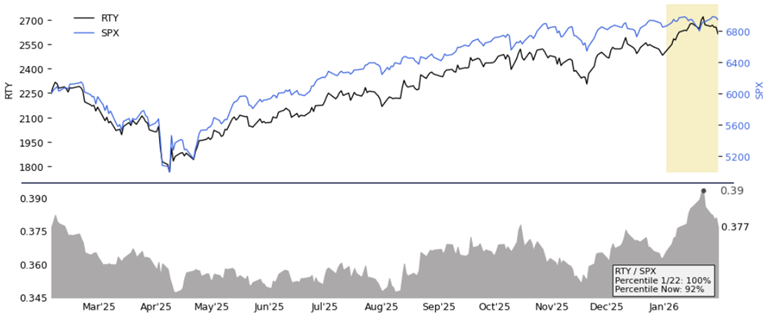
Source: Bloomberg as compiled by Citadel Securities, GMI, as of February 3rd, 2026. Figures are for illustrative purposes only. Past performance figures do not guarantee future results.
This dynamic is particularly relevant given RTY’s heavier exposure to retail-favored, high-beta themes – including drones, robotics, nuclear, space, and other segments that led performance in January. As positioning has adjusted, some of that relative strength has been used as a funding source, reinforcing February as a period where leadership selectivity matters more than breadth alone.
RTY outperformed SPX by 3.9% in January, which has only happened 6 other months in the last five years. Looking back at subsequent performance during those periods, it is possible we see further consolidation in the RTY vs. SPX spread over the next 60 days.
RTY vs. SPX – After a Month with ~4% Outperformance, Trend Could Revert
Five-Year Lookback, GMI Rules and Tools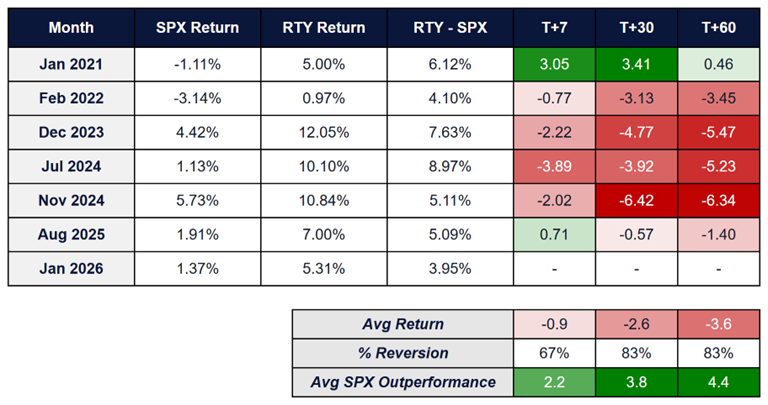
Source: Bloomberg as compiled by Citadel Securities, GMI, as of February 3rd, 2026. Figures are for illustrative purposes only. Past performance figures do not guarantee future results.
III. Positioning: Demand tends to fade in February 2H
Positioning into January was defined by extraordinary demand. Liquidity surged early in the month, volatility and correlations compressed, and flows provided a powerful technical tailwind for risk assets. Both retail and institutional participation reinforced momentum, allowing markets to absorb rotation and volatility without meaningful drawdowns.
As February begins, the technical backdrop is shifting. While liquidity remains ample, the pace of incremental deployment has slowed, and positioning is becoming more selective. With much of January’s demand already expressed, markets are increasingly sensitive to flow normalization rather than flow acceleration.
Money Market Funds Assets
Weekly Change, January 2020 – January 2026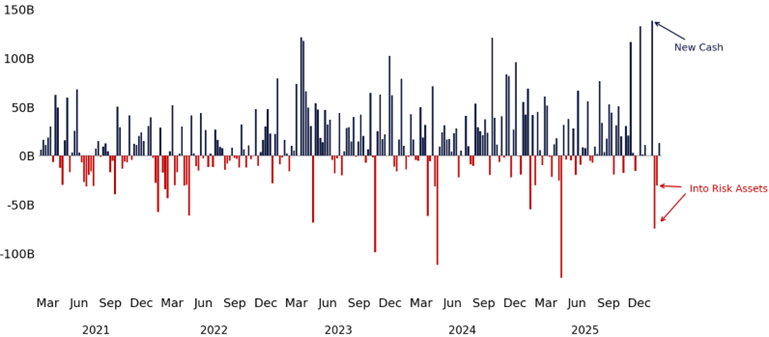
Source: Bloomberg as compiled by Citadel Securities, GMI, as of February 3rd, 2026. Figures are for illustrative purposes only. Past performance figures do not guarantee future results.
Average Monthly Equity Mutual Fund Purchases (% of AUM)
Since 1984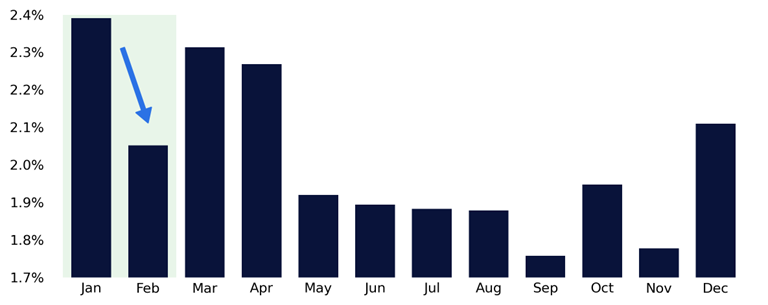
Source: Investment Company Institute, as compiled by Citadel Securities, GMI, as of February 3rd, 2026. Figures are for illustrative purposes only. Past performance figures do not guarantee future results
Volatility and correlations are also beginning to reprice. After spending much of January at depressed levels, one-month implied volatility and implied correlations moved higher last week, now sitting around mid-range levels. The market is starting to price a wider distribution of outcomes as flows normalize, and the calendar turns.
SPX Implied Volatility
One Month At-the-Money, One-Year Lookback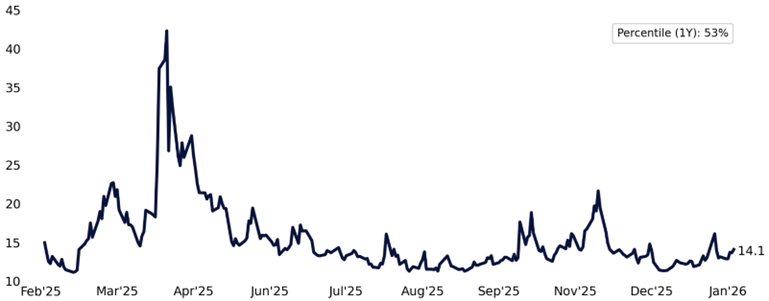
Source: Bloomberg as compiled by Citadel Securities, GMI, as of February 3rd, 2026. Figures are for illustrative purposes only. Past performance figures do not guarantee future results.
One-Month Implied Correlation
One-Year Lookback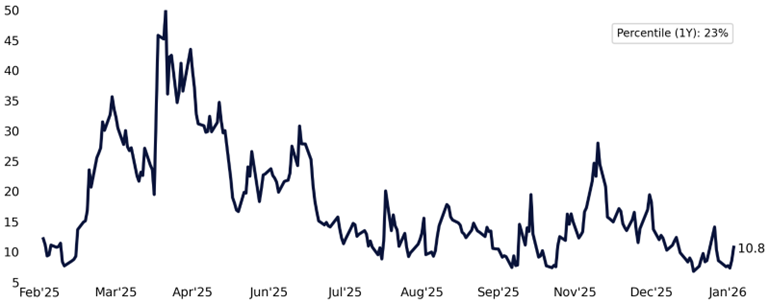
Source: Bloomberg as compiled by Citadel Securities, GMI, as of February 3rd, 2026. Figures are for illustrative purposes only. Past performance figures do not guarantee future results.
Why does the equity market tend to correct in February?
February seasonality is best viewed as a reflection of this mechanical shift in demand. Historically, February has been the second weakest month of the year, with the S&P 500 averaging -9bps since 1928 and posting the second-lowest hit rate of any calendar month.
Intramonth dynamics reinforce this pattern. 2H February has historically seen more uneven price action, with early gains often giving way to consolidation or pullbacks as early-year positioning settles.
SPX Monthly Seasonality
Average Monthly Return, Since 1928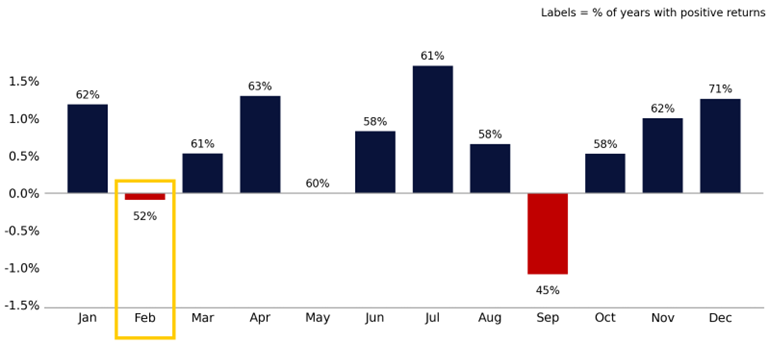
Source: Bloomberg as compiled by Citadel Securities, GMI, as of February 3rd, 2026. Figures are for illustrative purposes only. Past performance figures do not guarantee future results.
SPX February Performance by Day ~ 100 years.
Since 1928, excluding Leap Day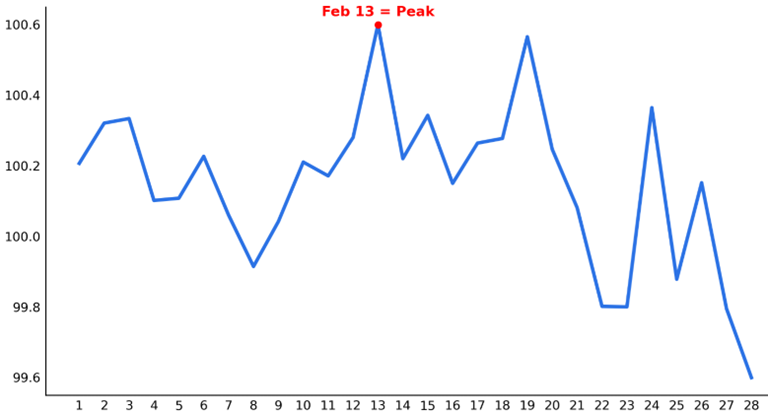
Source: Bloomberg as compiled by Citadel Securities, GMI, as of February 3rd, 2026. Figures are for illustrative purposes only. Past performance figures do not guarantee future results.
Institutional client behavior reflects this shift as well. Institutional clients at Citadel Securities continue to use options as the primary vehicle to position into upcoming catalysts – most notably earnings – either to add targeted length into specific reports or to selectively hedge names and sectors where outcomes may be more binary. Tenors remain very near dated, underscoring the tactical nature of this positioning.
The coming weeks are defined by a high density of macro, earnings, and policy catalysts, reinforcing the role of options in navigating event-driven risk.
Institutional Call/Put Direction Ratio
Weekly, Since January 2025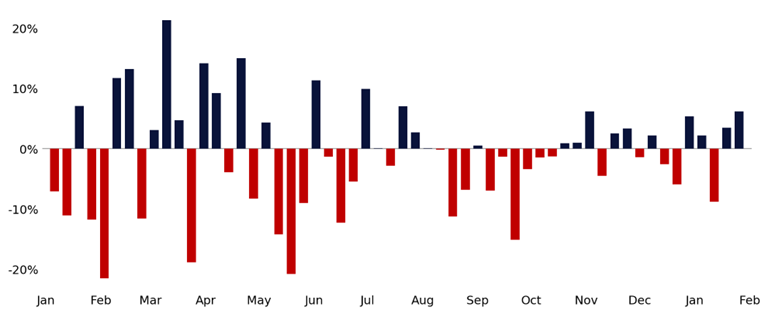
Source: Citadel Securities, GMI, as of February 3rd, 2026. Figures are for illustrative purposes only. Past performance figures do not guarantee future results
SPX Implied Daily Moves (%)
February 3 – February 27, 2026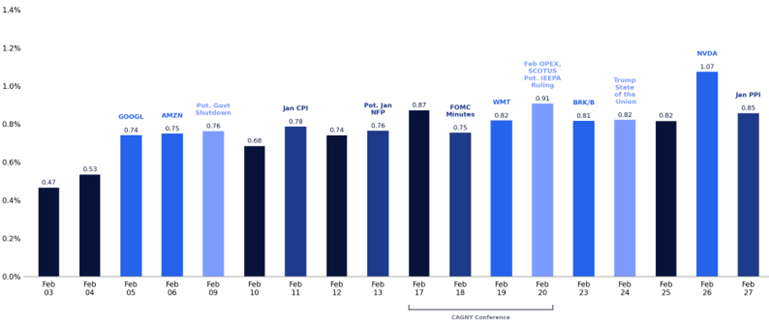
Source: Bloomberg as compiled by Citadel Securities, GMI, as of February 3rd, 2026. Figures are for illustrative purposes only. Past performance figures do not guarantee future results.
We have observed a modest uptick in hedging activity relative to the start of the year. This has not been accompanied by signs of stress or panic. Instead, clients appear to be layering into proactive protection, primarily at the index level, with small caps and the Russell (which have outperformed YTD) serving as the preferred hedging vehicle.
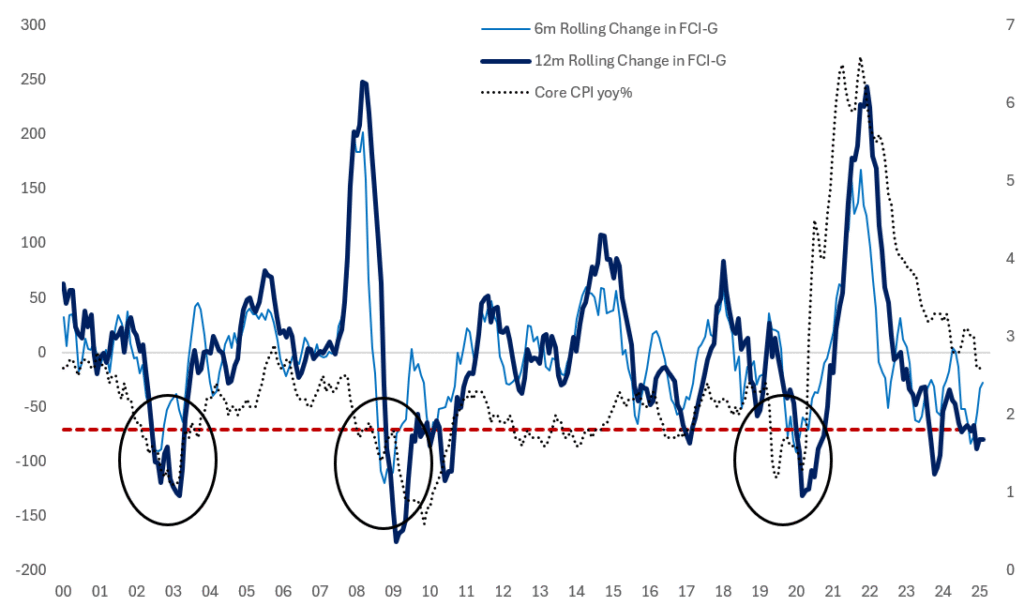
IV. Policy: Still a Tailwind
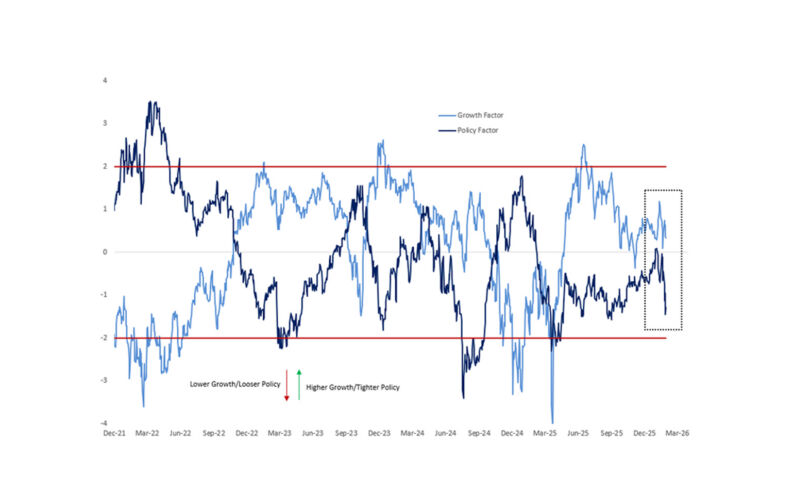
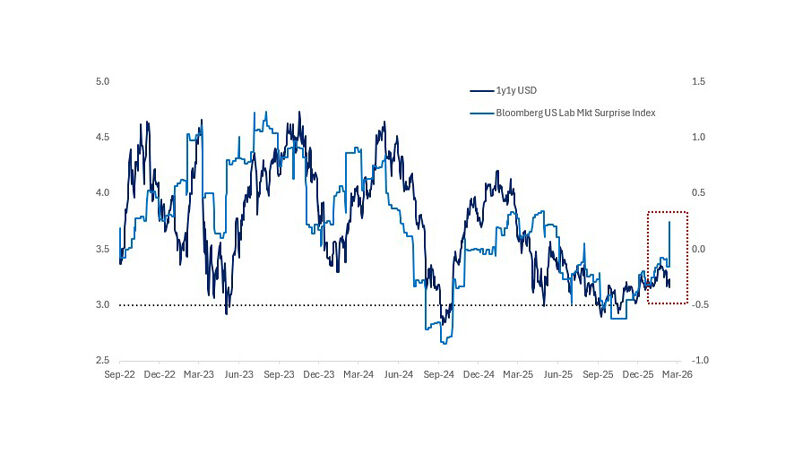
I asked macro strategist, Frank Flight for his updated views on policy. US Financial Conditions are at the lowest level since March 2022 and remain accommodative. The change in FCI matters the most, that means you capture the easing impulse. The 12-month rolling change in FCI is also historically large.
The data continues to come in better than expected. Administration officials are increasingly signaling confidence in a materially stronger growth trajectory, with real GDP growth of 4%+ in 2026, well above the prevailing 2% consensus.
The macro policy backdrop is further reinforced by the nomination of Kevin Warsh as Chairman of the Federal Reserve. A former member of the Federal Reserve Board of Governors, Warsh is viewed as a consequential appointment, with sentiment among the macro investment community turning increasingly constructive.
Fiscal policy remains an incremental tailwind. The effects of the One Big Beautiful Bill Act continue to pass through to households, supporting affordability at the margin. Historically, equity market participation has shown a high correlation with the seasonal influx of tax refund checks, with refunds set to reach accounts by April.
Source: Bloomberg as compiled by Citadel Securities, Frank Flight, as of February 3rd, 2026. Figures are for illustrative purposes only. Past performance figures do not guarantee future results.
V. Profits: US Earnings: Clearing the Window
Earnings season began constructively, with early reports – particularly from the banks – setting a supportive tone and expectations remaining manageable, Q4 beat rate has been 77% so far.
This week represents the final heavy stretch, with another 24% of the S&P 500 by index weight set to report, before the calendar begins to clear (67% of SPX will have reported by the end of the week).
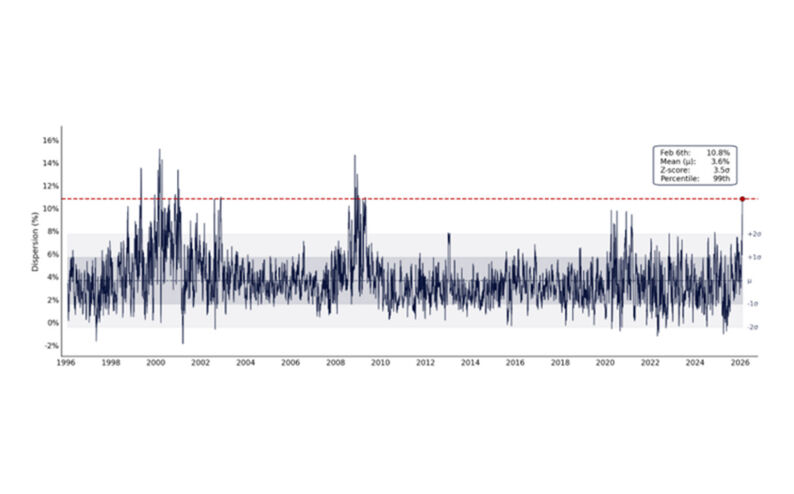
As results have come through, we have seen several notably outsized moves, especially across Energy, Communication Services, and Consumer-facing sectors, reinforcing a backdrop of elevated dispersion. Importantly, earnings are providing fundamental support, but they are unlikely to fully offset flow- and positioning-driven volatility as February unfolds.
S&P 500 Q4 Reporting Season – Buybacks Set to Pick Up into Feb
Projected Index Weight Outside Blackout Window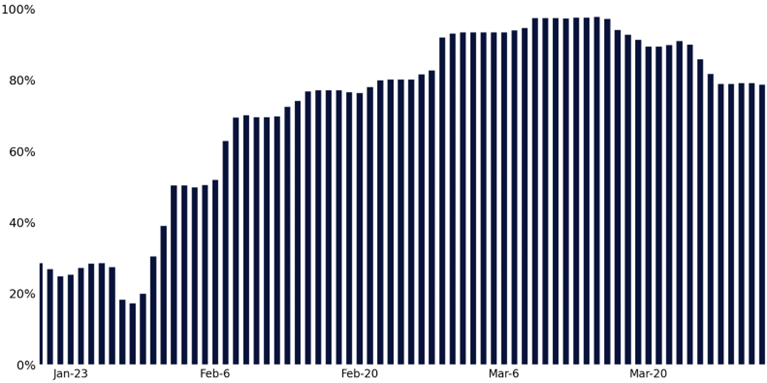
Source: Bloomberg as compiled by Citadel Securities, GMI, as of February 3rd, 2026. Figures are for illustrative purposes only. Past performance figures do not guarantee future results.
Earnings by Sector – SPX Weight Reporting per Week (%)
February 2 – March 13, 2026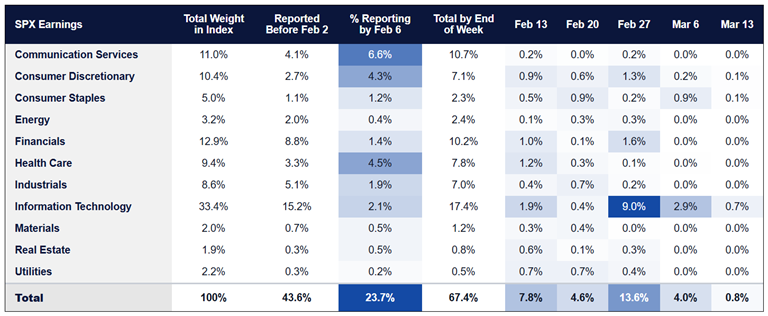
Source: Bloomberg as compiled by Citadel Securities, GMI, as of February 3rd, 2026. Figures are for illustrative purposes only. Past performance figures do not guarantee future results.
Earnings by Sector – NDX Weight Reporting per Week (%)
February 2 – March 13, 2026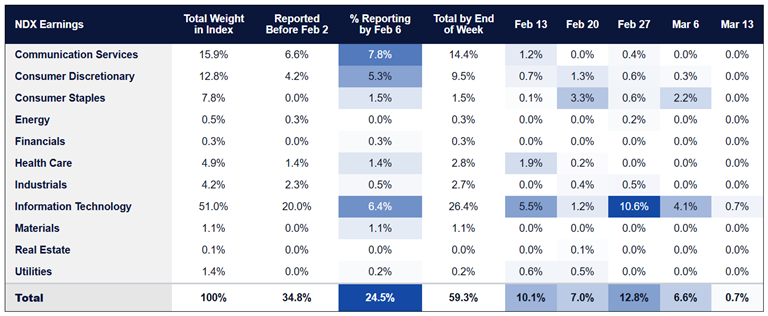
Source: Bloomberg as compiled by Citadel Securities, GMI, as of February 3rd, 2026. Figures are for illustrative purposes only. Past performance figures do not guarantee future results.
Earnings by Sector – RTY Weight Reporting per Week (%)
February 2 – March 13, 2026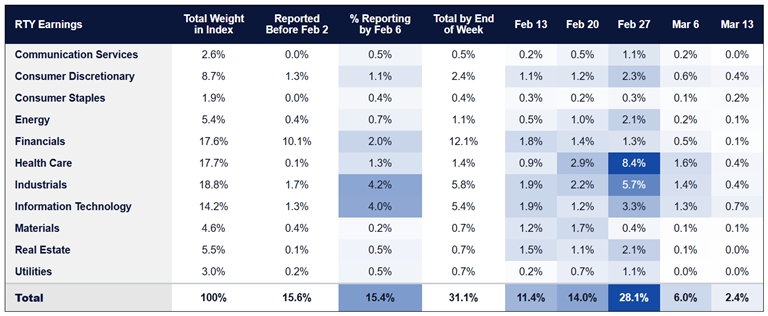
Source: Bloomberg as compiled by Citadel Securities, GMI, as of February 3rd, 2026. Figures are for illustrative purposes only. Past performance figures do not guarantee future results.
VI. GMI BOTTOM LINE ⬇️
January was characterized by heavy capital deployment into risk assets. Strong retail and institutional participation, broadening rotation, and compressed volatility created a favorable technical backdrop that supported risk assets broadly.
Late February into early March presents a different setup. As early-year flows normalize, leadership becomes more selective, seasonality less supportive, and markets increasingly sensitive to positioning and sentiment. While fundamentals and policy remain constructive, the most extended, high-beta segments face a higher bar as leadership is tested.
We are monitoring closely for signs of consolidation or correction as the month unfolds. In this environment, selectivity matters more than scale, and flexibility is critical as markets transition from deployment-driven strength to a test of durability. For now, GMI 2026 framework remains in check:
Retail: Record January demand
Rotation: Accelerating, T-I-N-A driven behavior persists
Positioning: Becoming increasingly fuller
Policy: Remains broadly accommodative
Profits: Broadening across sectors and stylesCopyright © Citadel Enterprise Americas LLC or one of its affiliates. All rights reserved.
Legal Entities Disseminating this Material: This material is disseminated in the United Kingdom by Citadel Securities (Europe) Limited (“CDGE”) authorized and regulated by the Financial Conduct Authority (“FCA”) (Registered company number: 05462867); in the European Union by Citadel Securities GCS (Ireland) Limited (“CSGI”) and its Paris Branch authorized and regulated by the Central Bank of Ireland (“CBI”) (Registration Number: C173437); in Hong Kong by Citadel Securities (Hong Kong) Limited (“CDHK”) licensed by the Securities and Futures Commission of Hong Kong (“SFC”), in Japan by Citadel Securities Japan Co., Ltd (“CSJC”) registered as a Type 1 financial instruments business operator with the Japan Financial Services Agency (“JFSA”); and in the United States of America by Citadel Securities LLC (“CDRG”) registered with the Securities Exchange Commission (“SEC”), Financial Industry Regulatory Authority (“FINRA”), and Securities Investor Protection Corporation (“SIPC”), Citadel Securities Institutional LLC (“CSIN”) registered with the SEC, FINRA, and SIPC, or Citadel Securities Swap Dealer LLC (“CSSD”) registered with the SEC, Commodities Futures Trading Commission (“CFTC”), and National Futures Association (“NFA”). Unless governing law permits otherwise, you must contact a Citadel Securities entity in your home jurisdiction if you want to use our services in effecting a transaction in any financial instruments or securities, including derivatives.
FOR INSTITUTIONAL USE ONLY; FOR PROFESSIONAL CLIENTS AND ELIGIBLE COUNTERPARTIES ONLY. This material is not intended as and does not constitute investment research. Contents of this material will be strictly limited to non-specific, generic information (i.e. macro events/topics) and are not subject to the Markets in Financial Instruments directive (MiFID II) or FINRA research rules. This material does not constitute an offer, solicitation, invitation, or inducement to purchase, acquire, subscribe to, provide, or sell any financial instrument or otherwise engage in investment activity. Please see additional important disclosures, including disclosures that may be relevant to your country of residence or business at www.citadelsecurities.com/GlobalSalesTrading.
Explore
Market Insights - What We Do