-
Who We Are
- What We Do
Series: Global Market IntelligenceAugust Views
By Scott Rubner
I’m back!
I look forward to working with you again and thank you for your support!
- Since joining Citadel Securities, I’ve received numerous client inquiries about the same daily markets question: “Is it time to fade the equity market rally?” My response: “We are not there yet.”
- Retail “buy the dip” behavior in equities and options represents an important dynamic in the U.S. equity market.
- Low institutional positioning and the return of the corporate buyback bid are important market technicals. I put the current set up in baseball terms – inning 7 out of 9. Institutional investors have some FOMU “Fear of Materially Underperforming” the benchmark indices if earnings come remotely in line and equities rally higher.
- For the next one month, I am bullish on US equities led by fundamental earnings and positive flow dynamics. I see the pain trade higher for the next few weeks as US companies may beat the low earnings expectations (+4% Q2/Q2 y/y per Haver) and positive translation effects from weaker USD especially as it relates to the US technology sector. This is a low bar for “fundamental investors” waiting for these earnings reports to become “forced-in”.
- During mid-August, I am recommending investors add equity index hedges for September month-end. This may take advantage of lower implied volatility to hedge any macro events. September 2nd (post Labor Day) typically marks the highest point for the month over the past 100 years.
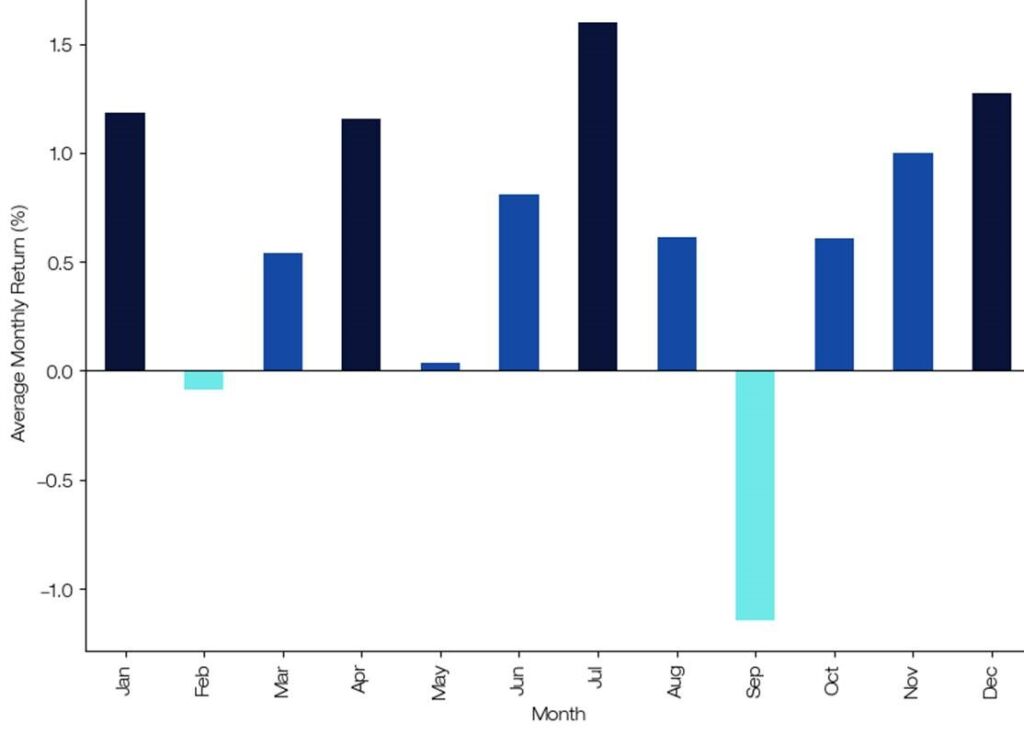
- July seasonals are exceptional for US stocks. Since 1928, July is the best performing month of the year for the S&P 500, while September is the worst performing month of the year as investors go “back to school”. S&P 500 is on pace for its 11th consecutive monthly gain in July. Citadel Securities summer trading activity is consistent with a substantial increase in equity demand, while others are away from their terminal screens.
Citadel Securities: SPX Monthly Returns (Since 1928)
 Source: Citadel Securities, as of 7/16/25. Figures are for illustrative purposes only. Past performance figures do not guarantee future results.
It is time for a thread.

Retail Positioning
1. Citadel Securities retail trading flows have been a net buyer of cash equities for the past 14 straight trading sessions as equities trade near all-time highs. This is the longest daily retail buying streak since December 2024, lasting 16 days.
S&P 500 was down a few bps yesterday and we had our single largest buy skew day since April 10th.
There is a competition for “dip alpha” – who can buy the dip the fastest – during the summer liquidity.
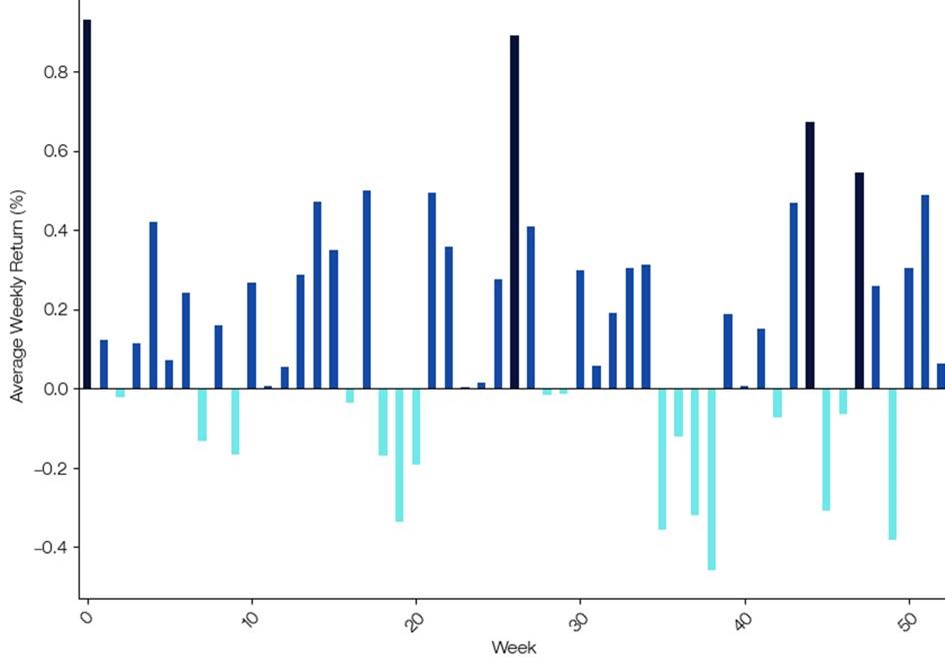
Retail Cash Equities – Net Notional by Week
Std dev January – July 2025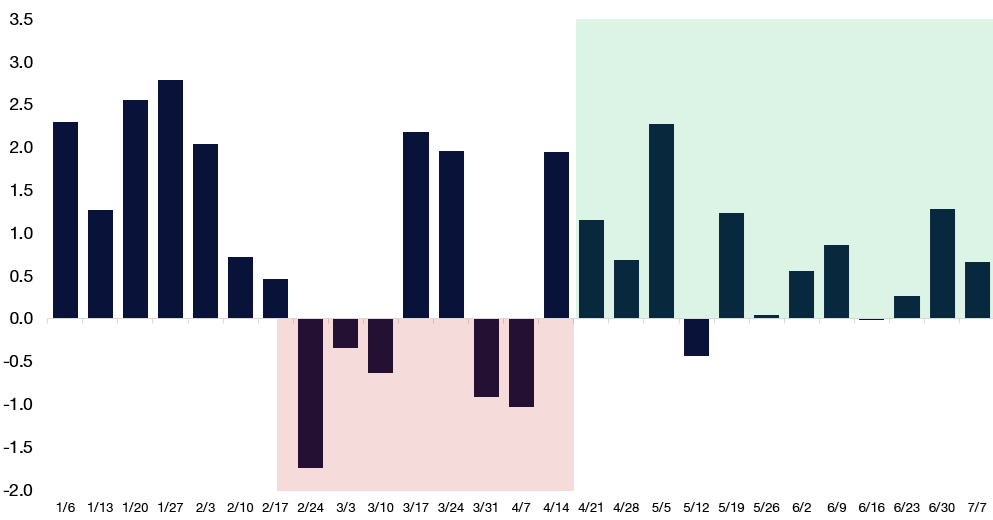 Source: Citadel Securities, as of 7/16/25. Figures are for illustrative purposes only. Past performance figures do not guarantee future results.
2. Citadel Securities retail trading flows have been a net buyer of cash equities for the last 11 of 13 weeks (since early April).
3. Citadel Securities franchise saw one of the largest ever daily outflows from retail trading during Liberation Day on April 7th (as well as outflows on April 4th). This was also one of the largest two-day sell skews that we have ever seen. Ever since April, retail investors have been resilient and fully participating in this rally.
4. Citadel Securities retail trading flows remains robust in the summer months, especially in June and July, before dropping off into September. Retail traders have deployed their largest amount of capital in July over the last two years and 2025 is no different.
Retail Cash – Proportion of Net Notional By Month
Jan. 2023 – Dec. 2024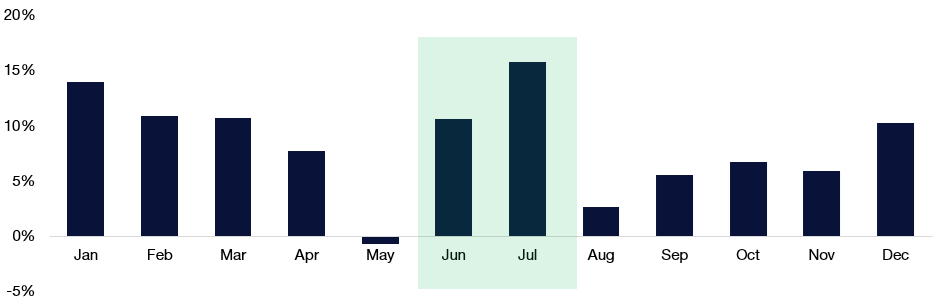 Source: Citadel Securities, as of 7/16/25. Figures are for illustrative purposes only. Past performance figures do not guarantee future results.
5. Citadel Securities estimation of retail as a % of overall shares traded in the market is currently 20%. May 2025 was the highest level of shares traded at 21% since February 2021 (24%) driven by increased and broad-based participation, especially in lower priced shares.
Retail has been better to buy in AI, high volatility, cryptocurrency, IPOs, leveraged ETFs, and anti-momentum equities.
Retail Activity as % of Overall Market Shares Traded
Jan. 2018 – Jul. 2025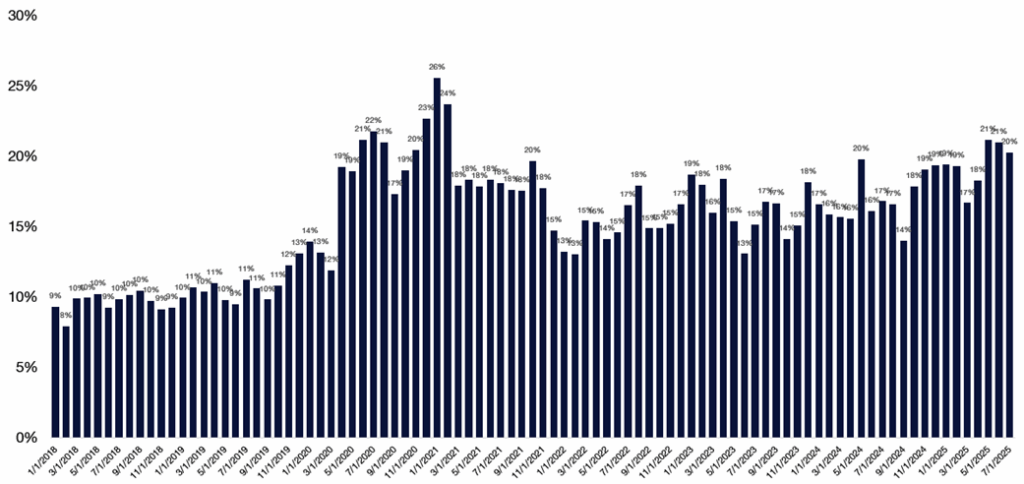 Source: Citadel Securities, as of 7/16/25. Figures are for illustrative purposes only. Past performance figures do not guarantee future results.
6. Citadel Securities has created several ways to help monitor the performance of popular retail trades based on our clients’ aggregate retail flows. Colleague Tom Sozzi has excellent insights in his Retail Roster. We look at this in three ways: a top-30 client buy names, a top-30 client sell names, and top 30 long/short pairs. The names are filtered to remove ETF securities (given the general tendency for retail clients to buy-and-hold ETFs) and are reconstituted on a monthly basis using a daily equal weighted measure.
Institutional Positioning
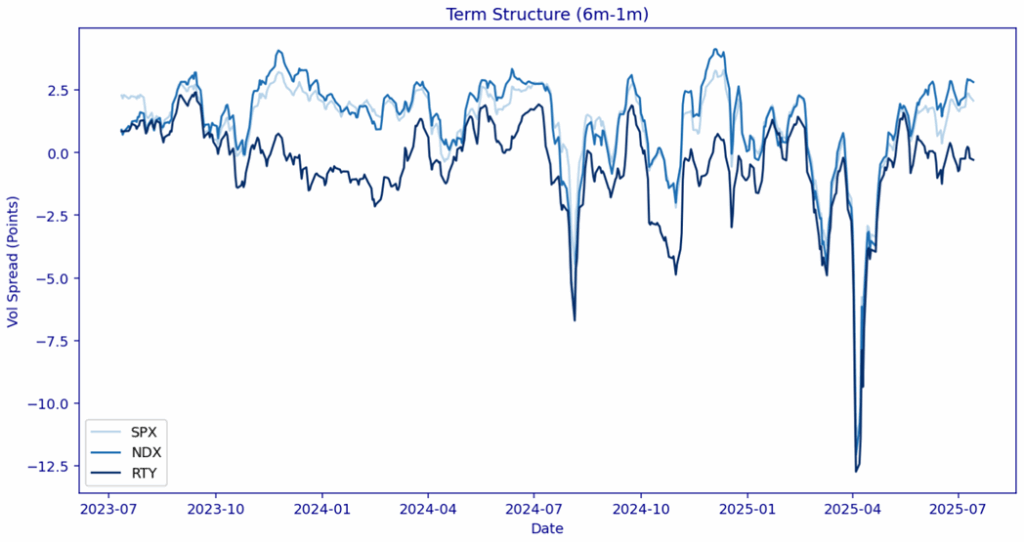
7. Volatility Technicals are improving:
Systematic positioning has increased recently, but still has room to add given the decline in realized volatility.
Volatility gauges of skew and term structure continue to normalize and systematic strategies have potential ammo for the next month. Volatility is no longer the coach directing plays from the sidelines, it is the star quarterback in the middle of huddle.
 Source: Citadel Securities, as of 7/16/25. Figures are for illustrative purposes only. Past performance figures do not guarantee future results.
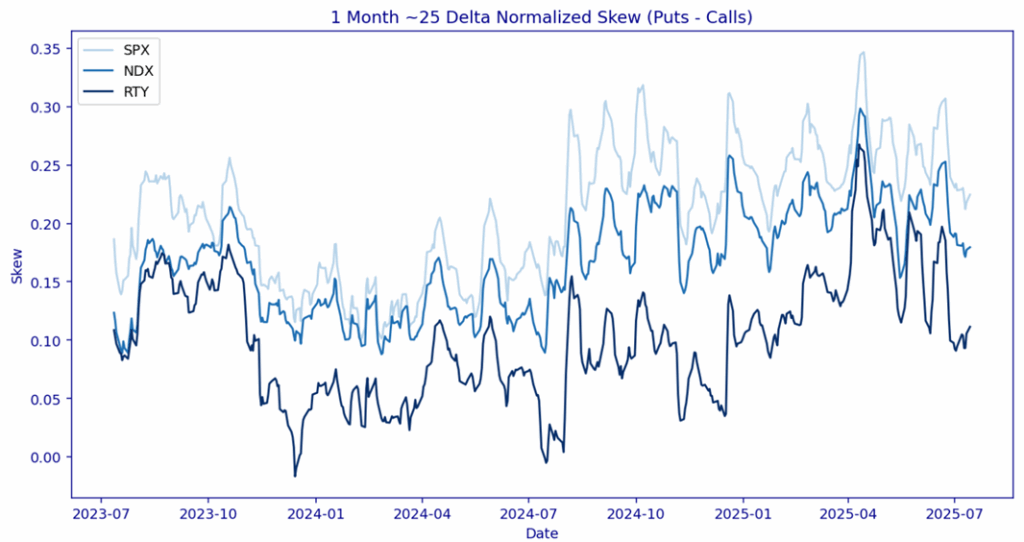 Source: Citadel Securities, as of 7/16/25. Figures are for illustrative purposes only. Past performance figures do not guarantee future results.
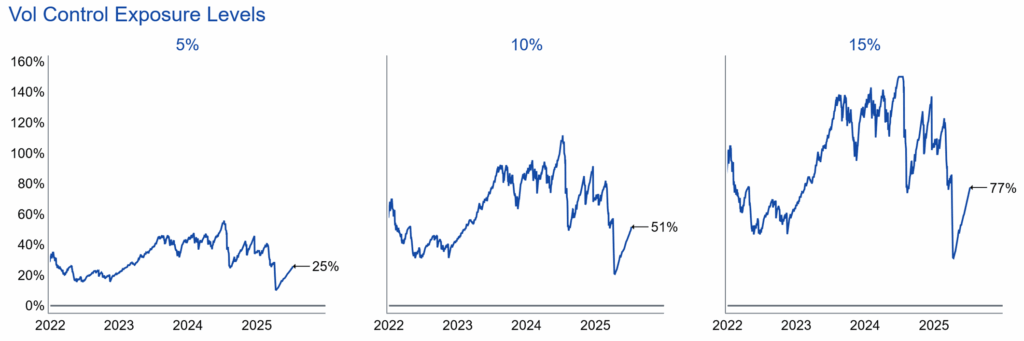
8. Vol Control Strategies
Volatility targeting based strategies continue to add equity risk exposure as high realized volatility periods of April continue to fall off the metric. Vol targeting with a daily risk target of 10% equity exposure is currently 35% below the highs heading into the seasonally slow August. 3-month realized vol is 26.64 and remains elevated when compared to 10-day realized vol of 8.47 and 30-day realized vol of 9.54.
 Source: Citadel Securities, as of 7/16/25. Figures are for illustrative purposes only. Past performance figures do not guarantee future results.
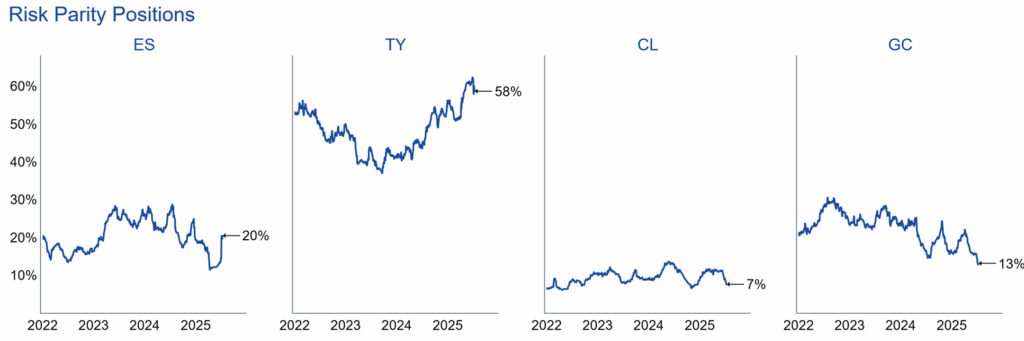
9. Risk Parity Strategies
Risk Parity strategies also take inputs from the longer dated realized volatility market. We estimate that Risk Parity strategies are also running low equity exposure when compared to a historical context. Spot/vol correlation continues to normalize in cross-assets, with our portfolio of assets measured (stocks, treasuries, crude, and gold respectively).
 Source: Citadel Securities, as of 7/16/25. Figures are for illustrative purposes only. Past performance figures do not guarantee future results.
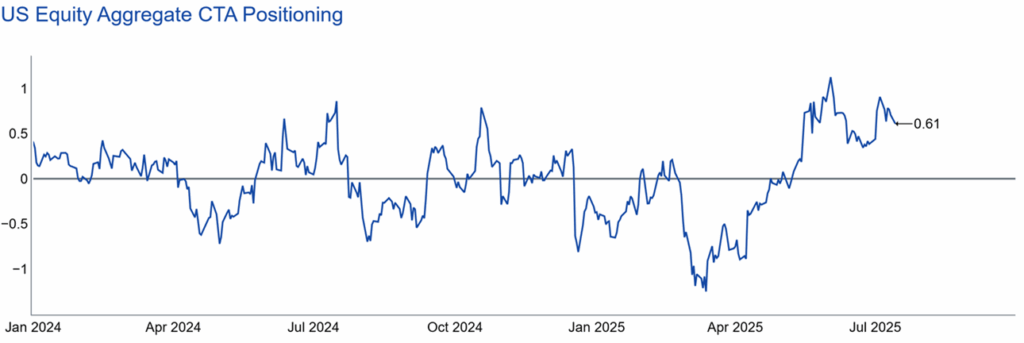
10. US and Global Commodity Trading Advisor (CTA) Positioning
Global (Commodity Trading Advisor) CTA positioning is not stretched. CTA trend-following strategies have been adding exposure during this recent move higher, however exposure does not seem extreme.
 Source: Citadel Securities, as of 7/16/25. Figures are for illustrative purposes only. Past performance figures do not guarantee future results.
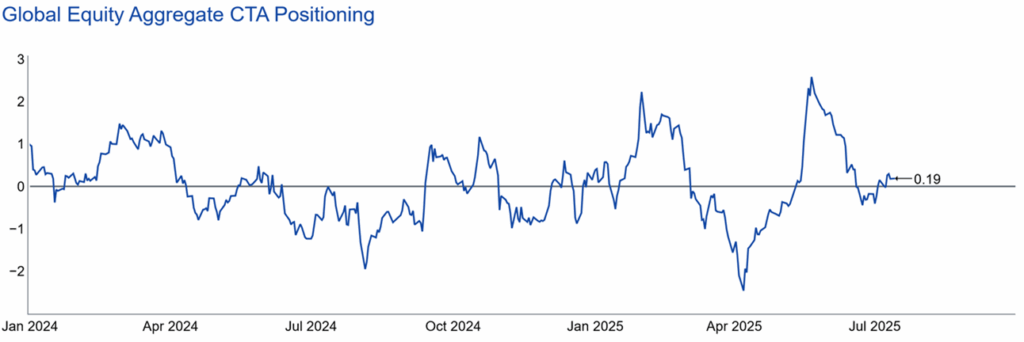 Source: Citadel Securities, as of 7/16/25. Figures are for illustrative purposes only. Past performance figures do not guarantee future results.
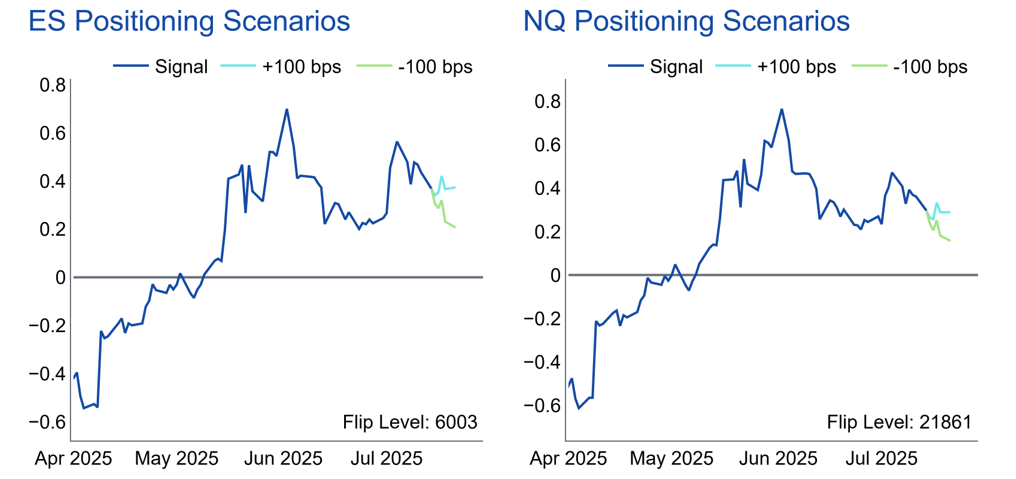
11. CTA Threshold Trigger Levels (SPX and NDX futures)
CTA key trigger levels: Citadel Securities macro strategy team Grant Wilder, estimates the ES1 “Trigger” level to be 6003 compared to current spot of 6280 and NQA “Trigger” level of 21861 compared to current spot of 23006. There is a substantial distance between current spot and medium-term threshold levels that these strategies would be forced to flip to short exposure.
 Source: Citadel Securities, as of 7/16/25. Figures are for illustrative purposes only. Past performance figures do not guarantee future results.
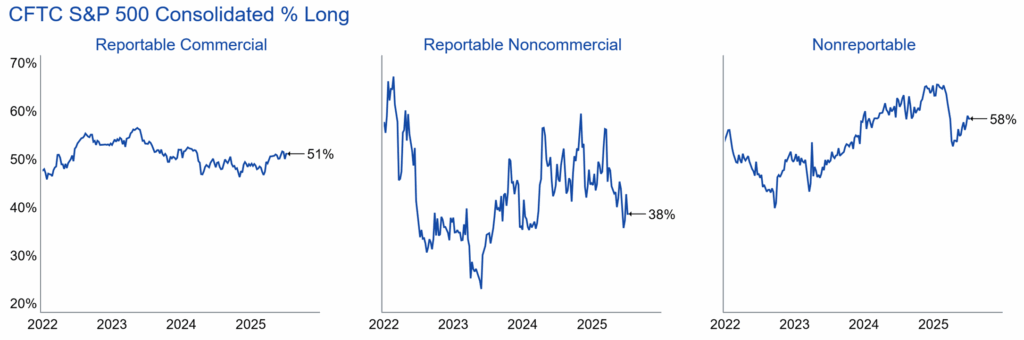
12. Futures PositioningInstitutional futures positioning across reportable commercial, noncommercial, and nonreportable also remain un-stretched.
 Source: Citadel Securities, as of 7/16/25. Figures are for illustrative purposes only. Past performance figures do not guarantee future results.
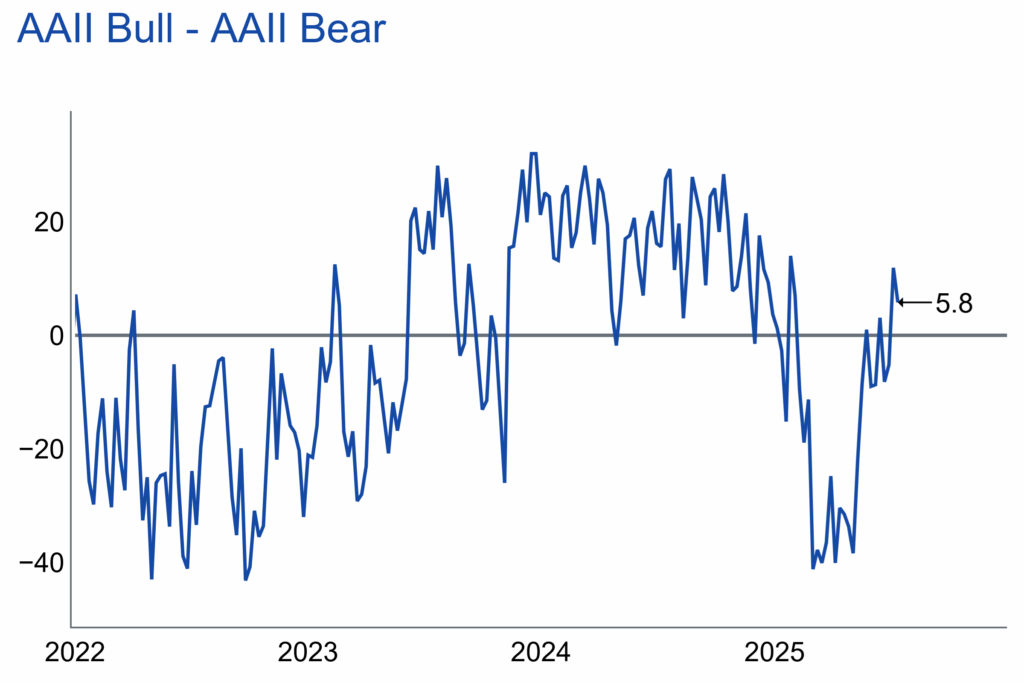
13. Investor SentimentSentiment is not extreme based on my conversations with institutional investors over the past few weeks. This is also witnessed by AAIIBULL (dropped week over week), while AAIIBEAR (increased week over week).
 Source: Citadel Securities, as of 7/16/25. Figures are for illustrative purposes only. Past performance figures do not guarantee future results.
Corporate Buybacks
14. The Return of Corporate Buyback
Today is currently the peak of US corporate earnings blackout period. US corporates will be re-emerging from the blackout window starting this week. Much of the S&P 500 marketcap will have reported by August 1st.
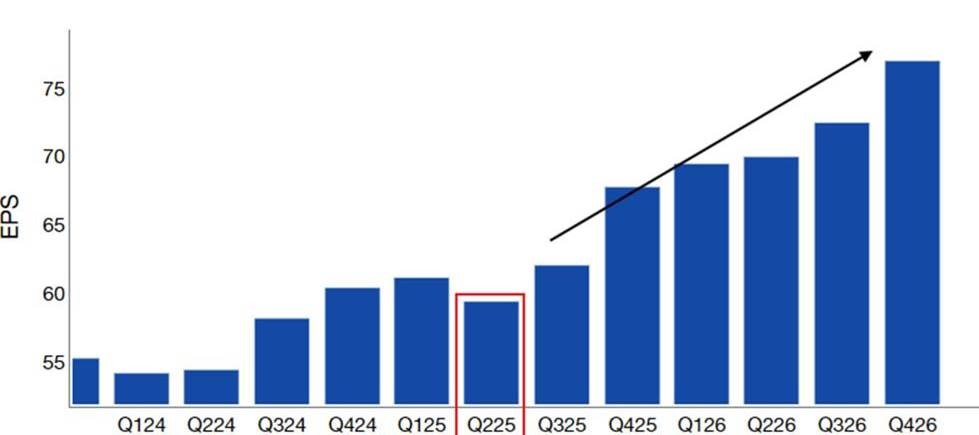
US Corporates are expected to purchase $1 trillion worth of stock in 2025 and remain the largest buyer of US equities. August is typically a positive month for corporate flows.
As flagged by my partner and macro colleague, Nohshad Shah, in his excellent weekly Macro thoughts piece, the bar for earnings this quarter is low. August is one of the best months of the year for corporate share repurchases. This market dynamic adds passive VWAP demand into the largest US corporates.
S&P Earnings Estimates
 Source: Citadel Securities, Haver, as of 7/16/25. Figures are for illustrative purposes only. Past performance figures do not guarantee future results.
Volatility Traders
15. Citadel Securities retail option trading flows have been a net buyer of bullish option flows for 11 straight weeks and have been deploying bullish flow every week since the April market lows. The most recent streak was November 2023, which saw significant equity outperformance.
Retail Options – Put / Call Direction Ratio by Week
January – July 2025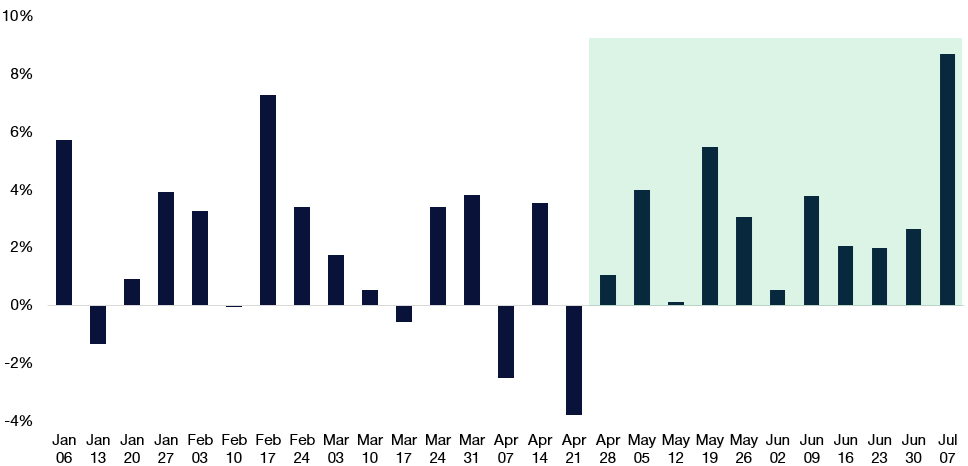 Source: Citadel Securities, as of 7/16/25. Figures are for illustrative purposes only. Past performance figures do not guarantee future results.
16. There have been only 6 other times in the history of our dataset (since January 2020) that the bullish option streak was 11 weeks or longer
Longest Retail Weekly Option Buying Streaks on Record
# of weeks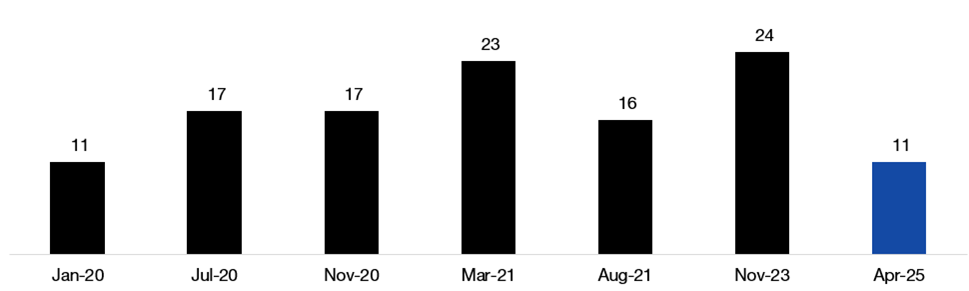 Source: Citadel Securities, as of 7/16/25. Figures are for illustrative purposes only. Past performance figures do not guarantee future results.
17. The average duration of the 6 previous bullish option streaks was 18 weeks, suggesting further potential bullish “YOLO” call option demand. This would imply demand for another 7 weeks. There has been a substantial increase in premium collected during this period.
Colleague Allie Becher has excellent insights on this and other retail flow topics in her Retail Detail.
18. Citadel Securities retail option trading flows also remain strong in the summer months before declining in September. Call option activity is starting change the gamma profile in the market.
Index dealers may become short upside calls and exhibit short gamma exposure if the S&P moves higher through current spot. Long index gamma has been a market buffer feature during this rally, but this changes if fundamental investors start to hedge the right tail earnings events. In addition, levered ETF activity both in options and shares acts as synthetic short gamma for the market.
Retail Options – Proportion of Contract Volume by Month
January 2020 – June 2025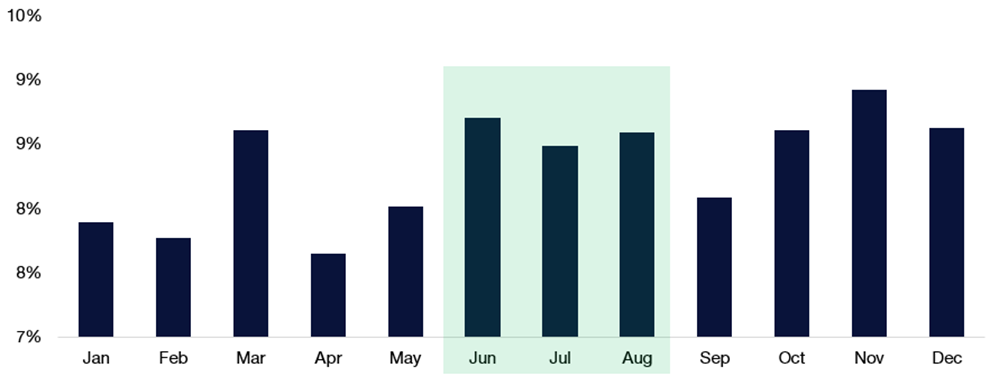 Source: Citadel Securities, as of 7/16/25. Figures are for illustrative purposes only. Past performance figures do not guarantee future results.
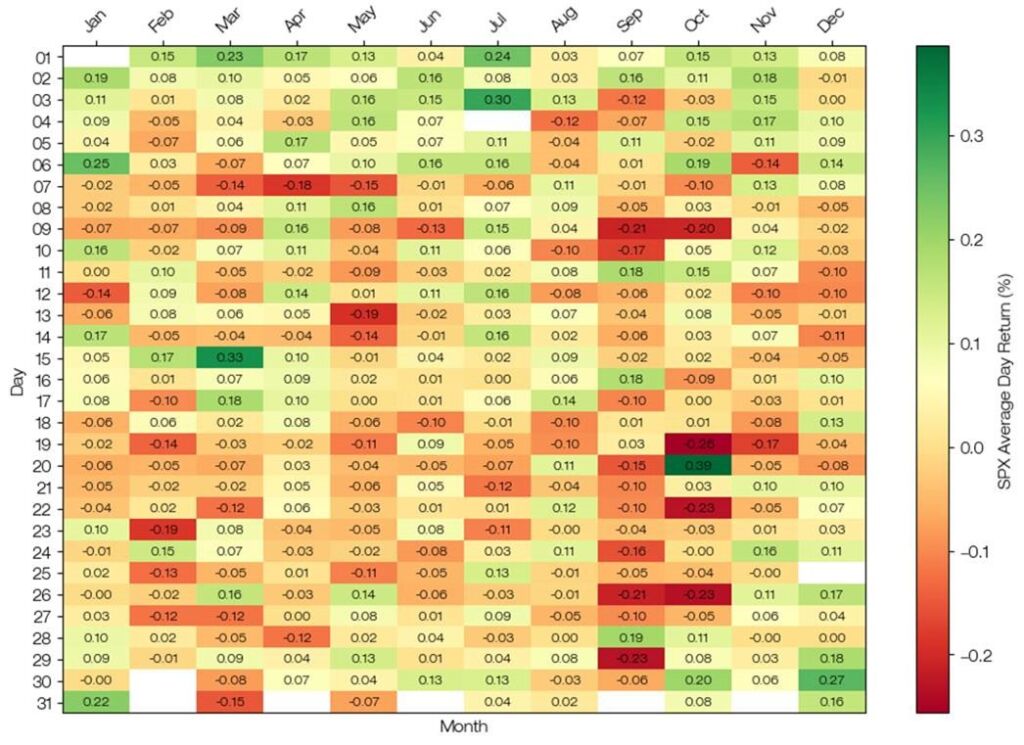
19. Citadel Securities summer client equity cash and call option activity and my heatmap tend to have a high correlation. You will see more from me on this topic heading into Q4.
Citadel Securities: SPX Daily Returns Heatmap (Since 1928)
 Source: Citadel Securities, as of 7/16/25. Figures are for illustrative purposes only. Past performance figures do not guarantee future results.
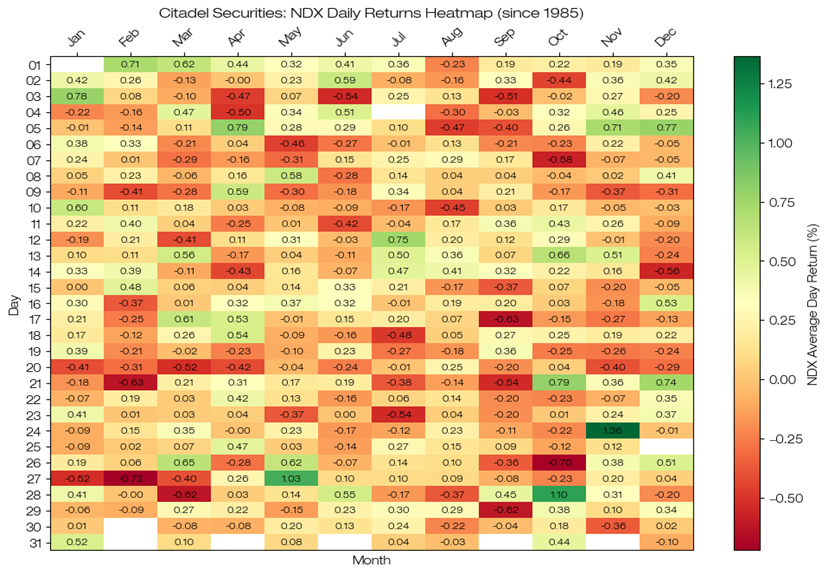
Citadel Securities: NDX Daily Returns Heatmap (Since 1985)
 Source: Citadel Securities, as of 7/16/25. Figures are for illustrative purposes only. Past performance figures do not guarantee future results.
20. Citadel institutional investors have been better to buy downside hedges.
Citadel Securities institutional option flows have been bearish in 8 out of the past 11 weeks, suggesting increased hedging demand at the index level.
Citadel Securities institutional option flow is consistent with the overall positioning from real money investors.
Institutional Options – Put / Call Direction Ratio by Week
January – July 2025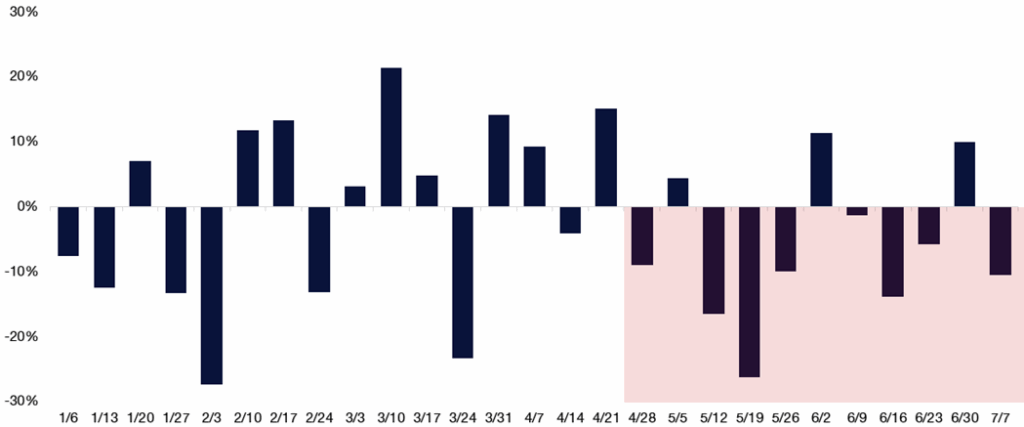 Source: Citadel Securities, as of 7/16/25. Figures are for illustrative purposes only. Past performance figures do not guarantee future results.
Market Direction Bottom Line
21. I am bullish on US equities for the next month led by US Technology, Software, and AI innovators. The Superbowl of Q2 earnings starts this week and may force institutional investors back into the market and into their favorite concentrated core positions.
22. “Higher, then Lower” vibes – I think that equities can rally further from here led by positive seasonal factors, strong flow-of-funds, continued retail support, return of corporates, and final buy-in from fundamental investors.
23. I will recommend hedges for September month-end, as systematic investors become full and investors take their foot off the pedal getting ready for a big Q4.
Citadel Securities: September SPX Daily Returns (Since 1928)
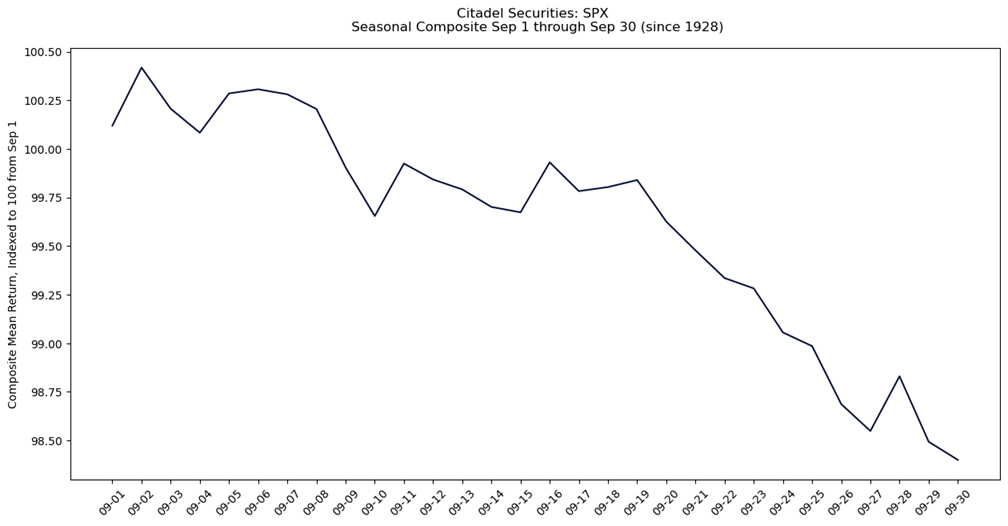 Source: Citadel Securities, as of 7/16/25. Figures are for illustrative purposes only. Past performance figures do not guarantee future results.
Citadel Securities: September NDX Daily Returns (Since 1985)
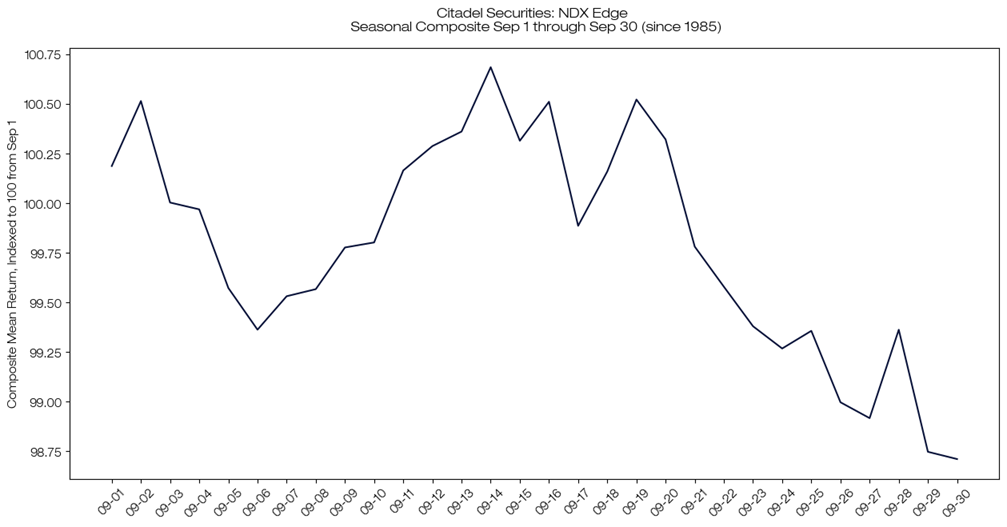 Source: Citadel Securities, as of 7/16/25. Figures are for illustrative purposes only. Past performance figures do not guarantee future results.
Citadel Securities: Q3 SPX Daily Returns (Since 1928)
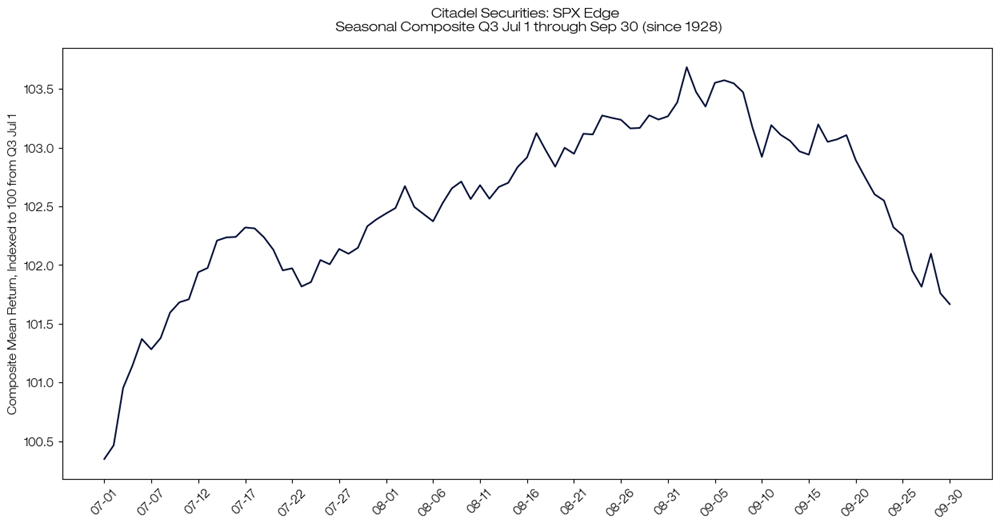 Source: Citadel Securities, as of 7/16/25. Figures are for illustrative purposes only. Past performance figures do not guarantee future results.
Citadel Securities: Q3 NDX Daily Returns (Since 1985)
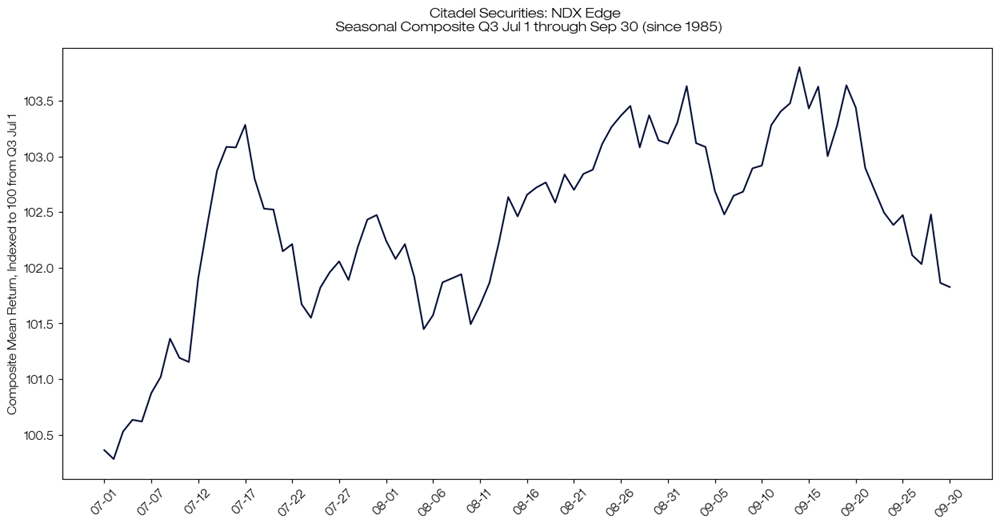 Source: Citadel Securities, as of 7/16/25. Figures are for illustrative purposes only. Past performance figures do not guarantee future results.
Citadel Securities: SPX Weekly Returns (Since 1928)
 Source: Citadel Securities, as of 7/16/25. Figures are for illustrative purposes only. Past performance figures do not guarantee future results.
Copyright © Citadel Enterprise Americas LLC or one of its affiliates. All rights reserved.
Legal Entities Disseminating this Material: This material is disseminated in the United Kingdom by Citadel Securities (Europe) Limited (“CDGE”) authorized and regulated by the Financial Conduct Authority (“FCA”) (Registered company number: 05462867); in the European Union by Citadel Securities GCS (Ireland) Limited (“CSGI”) and its Paris Branch authorized and regulated by the Central Bank of Ireland (“CBI”) (Registration Number: C173437); in Hong Kong by Citadel Securities (Hong Kong) Limited (“CDHK”) licensed by the Securities and Futures Commission of Hong Kong (“SFC”), in Japan by Citadel Securities Japan Co., Ltd (“CSJC”) registered as a Type 1 financial instruments business operator with the Japan Financial Services Agency (“JFSA”); and in the United States of America by Citadel Securities LLC (“CDRG”) registered with the Securities Exchange Commission (“SEC”), Financial Industry Regulatory Authority (“FINRA”), and Securities Investor Protection Corporation (“SIPC”), Citadel Securities Institutional LLC (“CSIN”) registered with the SEC, FINRA, and SIPC, or Citadel Securities Swap Dealer LLC (“CSSD”) registered with the SEC, Commodities Futures Trading Commission (“CFTC”), and National Futures Association (“NFA”). Unless governing law permits otherwise, you must contact a Citadel Securities entity in your home jurisdiction if you want to use our services in effecting a transaction in any financial instruments or securities, including derivatives.
FOR INSTITUTIONAL USE ONLY; FOR PROFESSIONAL CLIENTS AND ELIGIBLE COUNTERPARTIES ONLY. This material is not intended as and does not constitute investment research. Contents of this material will be strictly limited to non-specific, generic information (i.e. macro events/topics) and are not subject to the Markets in Financial Instruments directive (MiFID II) or FINRA research rules. This material does not constitute an offer, solicitation, invitation, or inducement to purchase, acquire, subscribe to, provide, or sell any financial instrument or otherwise engage in investment activity. Please see additional important disclosures, including disclosures that may be relevant to your country of residence or business at www.citadelsecurities.com/GlobalSalesTrading.
Explore
Market Insights - What We Do