-
Who We Are
- What We Do
Series: Global Market IntelligenceBack to School
By Scott Rubner
⬇️ GMI: Bottom Line ⬇️
September is historically the weakest month for equities, with volatility rising into option expiration and retail participation fading. With systematic strategies (CTAs, Vol-Control, Risk Parity) already near peak allocations and corporate demand set to slow, risk/reward skews to the downside. That makes hedges particularly attractive.
Or, to borrow from Drake: “S&P” started from the bottom (in April), now we’re here…30% later.
The longer-term equity trend remains intact and supportive of a Q4 rally.
Q4 Equity Snapshot: Equity Rally Themes
- Equal-weight breadth improving (S&P ‘493’ > ‘Top 7’)
- Value > Growth
- Small/Mid > Large caps
- “The rest” > “The best”
It is time for a thread.

These are the key dynamics we’re tracking.I. On-the-Ground Sentiment (Citadel Securities)
Client activity remains robust even at all-time equity market highs.
- Retail Equities: Net buyers in 17 of the last 20 weeks
- Retail Options: 18-week net buying streak
- Institutional Options: Bullish in 5 of the last 7 weeks
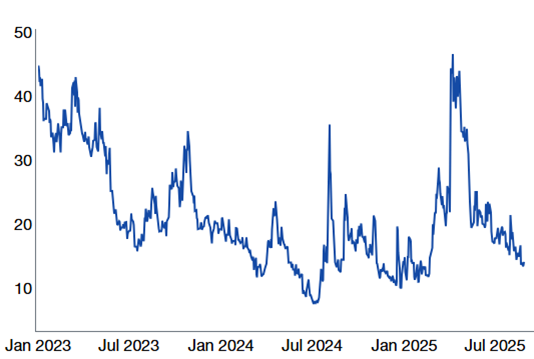
II. Low Implied Correlation: A Stock Picker’s Market
👉 Low implied correlation signals a market where fundamentals matter more than macro—supportive for alpha from security selection.
- Typical of late‑cycle markets with refocus on earnings differentiation
- “Alpha > Beta; Single‑name > Index; 493 > 7”
- Active > Passive
SPX 3-month Implied Correlation
Jan 2023 – Today
Source: Bloomberg as compiled by Citadel Securities, as of September 2nd, 2025. Figures are for illustrative purposes only. Past performance figures do not guarantee future results.III. Seasonality Watch: September Setup
👉 September Setup
- Historically, Sep 3rd (tomorrow) marks the monthly S&P 500 high (since 1928)
- Post–Labor Day FOMO tends to fade
- Quarter-end rebalancing intensifies
- 2025 has closely mirrored historical patterns
SPX September Monthly Performance
1928 – Today
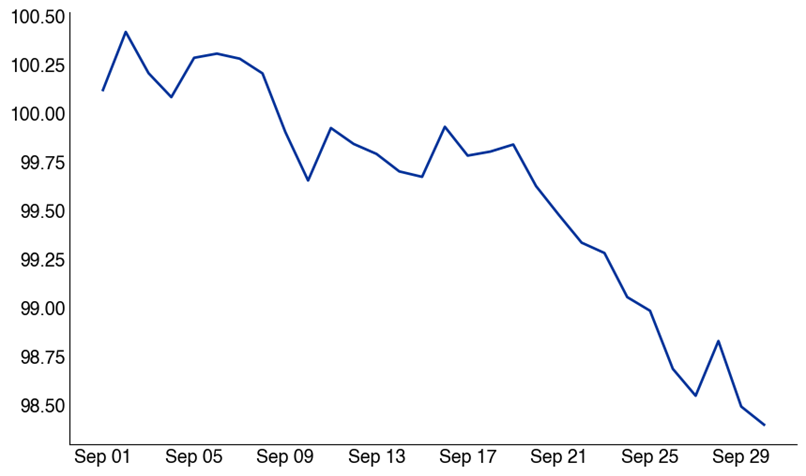
Source: Bloomberg as compiled by Citadel Securities, as of September 2nd, 2025. Figures are for illustrative purposes only. Past performance figures do not guarantee future results.NDX September Monthly Performance
1985 – Today
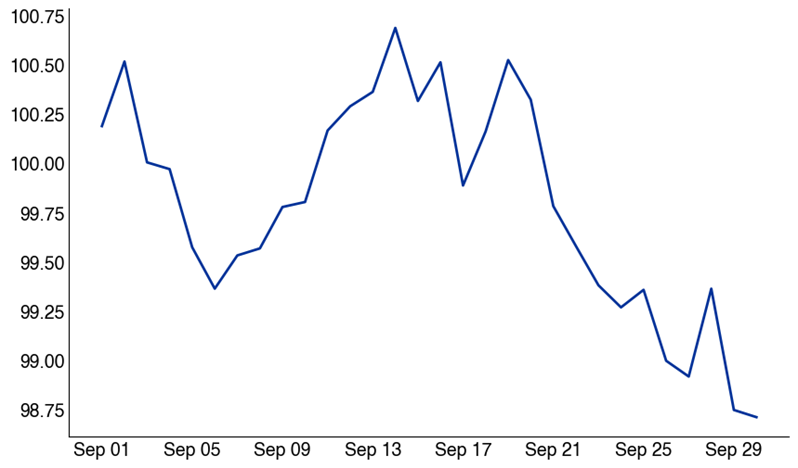
Source: Bloomberg as compiled by Citadel Securities, as of September 2nd, 2025. Figures are for illustrative purposes only. Past performance figures do not guarantee future results.SPX 500 Daily Performance Quilt
1928 – Today
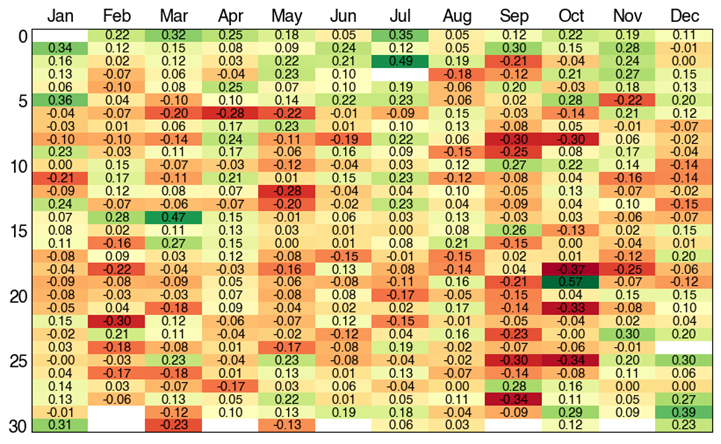
Bloomberg as compiled by Citadel Securities, as of September 2nd, 2025. Figures are for illustrative purposes only. Past performance figures do not guarantee future results.IV. Retail Positioning – Summer Series
1. Citadel Securities’ retail equities: Net buyers in 17 of the last 20 weeks, rebounding after April weakness.
Retail Cash Equities – Net Notional by Week (Std Dev)
January – August 2025
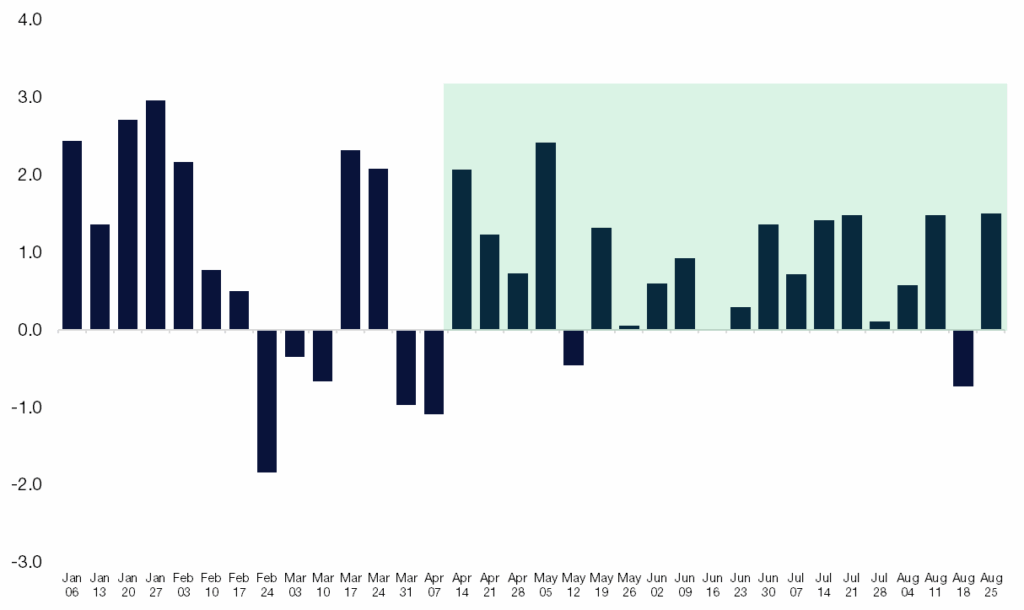
Source: Citadel Securities, as of September 2nd, 2025. Figures are for illustrative purposes only. Past performance figures do not guarantee future results.2. Citadel Securities Retail Trend: Citadel Securities retail clients have been buyers for 20 consecutive months of both net notional and shares.
3. Citadel Securities’ retail cash seasonality demand trends from the last 8 years.
- June & July = Strong
- August = Slower
- September = Weakest
Retail Cash – Proportion of Net Notional By Month
August 1, 2017 – August 31, 2025
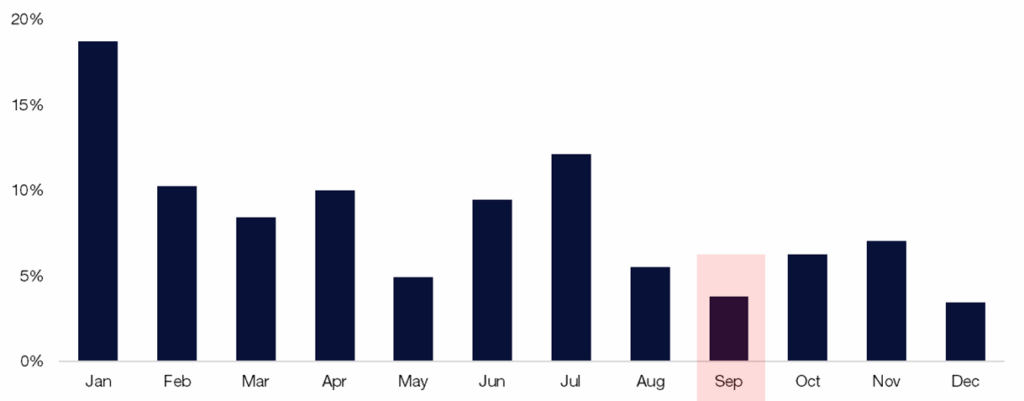
Source: Citadel Securities, as of September 2nd, 2025. Figures are for illustrative purposes only. Past performance figures do not guarantee future results.V. Volatility and Options Positioning
4. Citadel Securities’ Retail Options Activity: August 2025 set a new monthly volume record.
Retail Options – Average Monthly Options Volume
Std Dev, normalized to January 2020
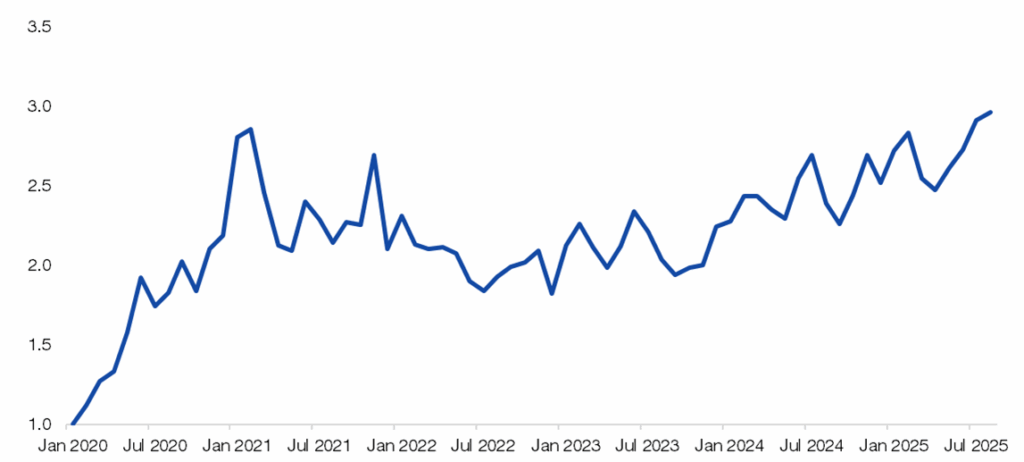
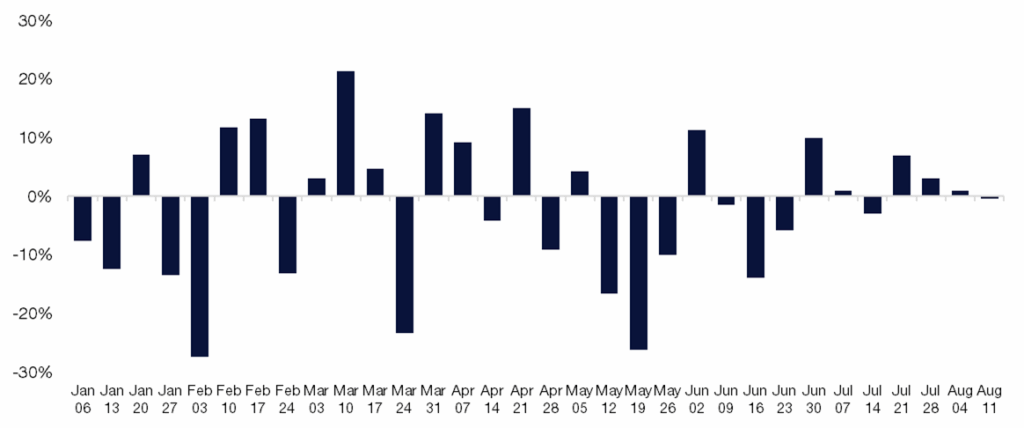
Source: Citadel Securities, as of September 2nd, 2025. Figures are for illustrative purposes only. Past performance figures do not guarantee future results.5. Citadel Securities’ retail option bullish streak continues with 18 straight weeks of net buying.
- 16-week net buying streak
- Friday’s activity hit the 98th percentile, 34% above 12-month average.
Retail Options – Call / Put Direction Ratio by Week (%)
January – August 2025
Source: Citadel Securities, as of September 2nd, 2025. Figures are for illustrative purposes only. Past performance figures do not guarantee future results.6. Citadel Securities’ Bullish Retail Options Streak Watch
- This is now tied for 3rd-longest bullish streak since 2020, with 18 straight weeks of demand
- The top five streaks averaged 18 weeks – this is typically when option activity starts to slow
Longest Retail Weekly Option Buying Streaks on Record, since 2020.
Starting month, # of weeks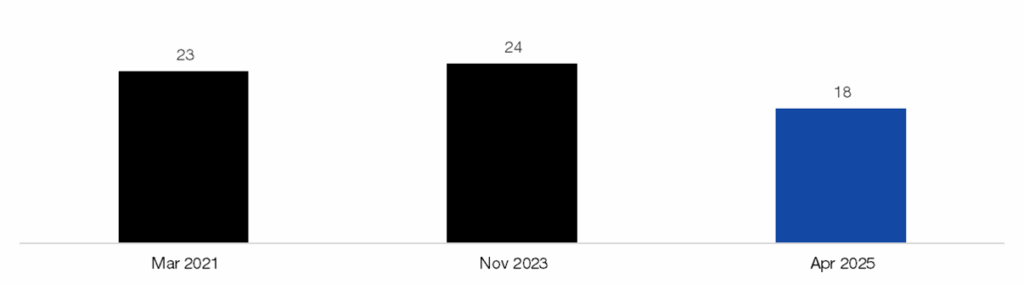
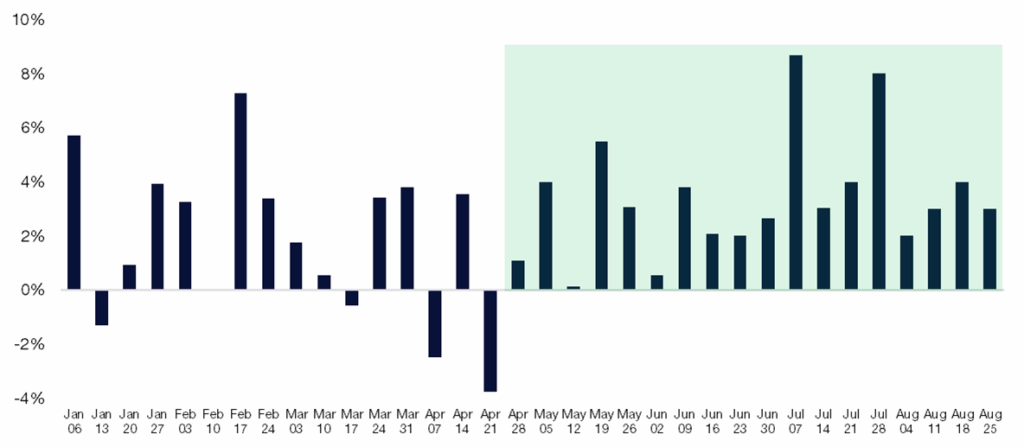
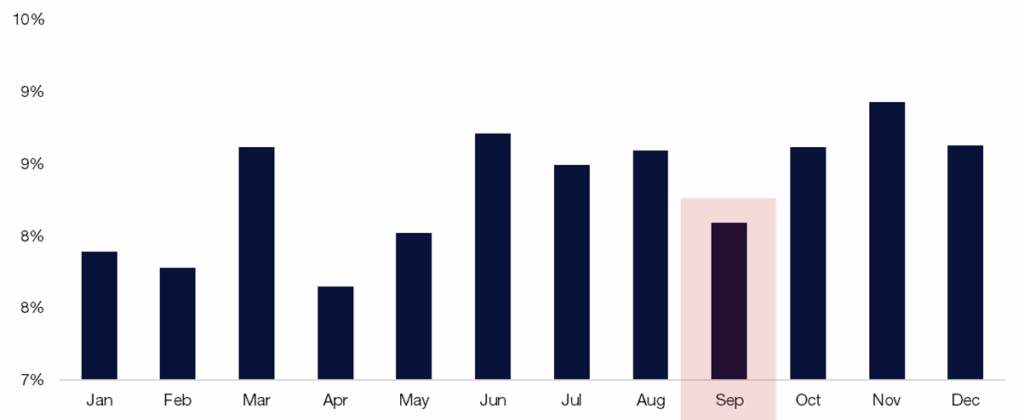
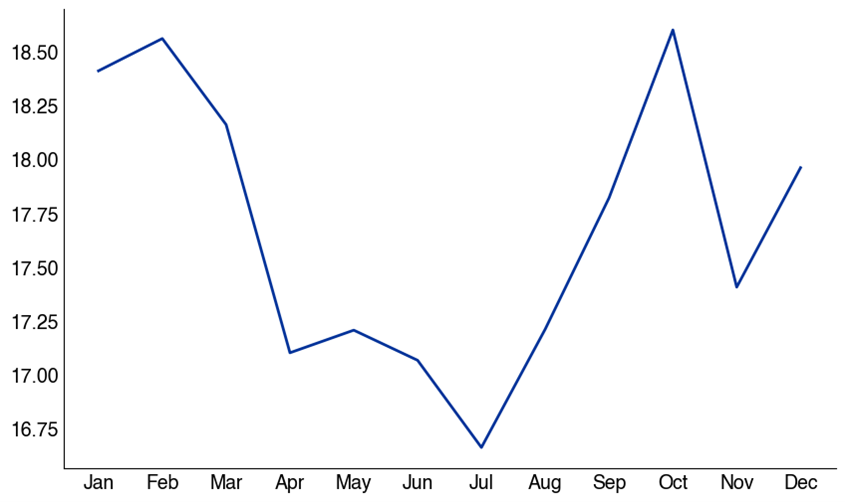
Source: Citadel Securities, as of September 2nd, 2025. Figures are for illustrative purposes only. Past performance figures do not guarantee future results.7. September slowdown before Q4 ramp:
Citadel Securities’ retail options volume typically wanes in September before rebounding into the final quarter of the calendar year. Activity picks back up in Q4, with November the strongest month of the year.
Retail Options – Proportion of Contract Volume by Month
January 2020 – December 2024
Source: Citadel Securities, as of September 2nd, 2025. Figures are for illustrative purposes only. Past performance figures do not guarantee future results.8. Citadel Securities Institutional Options clients are also bullish.
- Turned bullish in 5 of the last 7 weeks.
- Institutional Options clients moved from bearish to bullish in the last month.
- We have seen anti-momentum right-tail hedges in lower quality assets following Jackson Hole.
Institutional Options –Call/Put Direction Ratio by Week
January – August 2025
Source: Citadel Securities, as of September 2nd, 2025. Figures are for illustrative purposes only. Past performance figures do not guarantee future results.9. Volatility: Realized Collapsed; Implied Reset Lower
3-month realized vol has fallen sharply, dropping 10 percentage points in two weeks as high-vol periods rolled off.
This has contributed to a long dealer-gamma backdrop that can mute intraday moves. We estimate the long dealer gamma positioning to be significant.
- SPX 3M realized ≈ 12 (down sharply from earlier highs)
- SPX 2M realized ≈ 9
- SPX 1M realized ≈ 10
- Systematic re-leveraging has been fueled by this collapse in realized vol + vol selling strategies
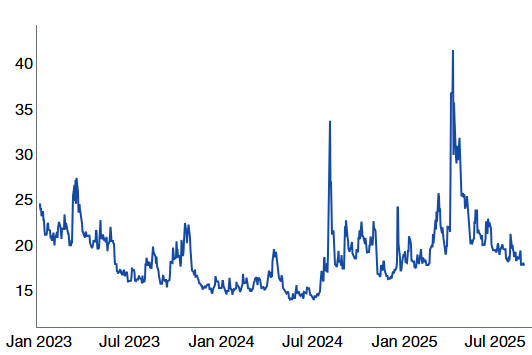
Implied Volatility: Reset lower → hedges attractive again.
SPX 3-month implied volatility
Jan 2023 – August 2025
Source: Bloomberg as compiled by Citadel Securities, as of September 2nd, 2025. Figures are for illustrative purposes only. Past performance figures do not guarantee future results.VI. Peak Corporate Demand
- Buyback blackout set to start Sep 15. Blackout typically begins ~two weeks before quarter-end and ends a day or two after Q3 earnings. August saw strong executions during the open window.
- Birinyi Associates: U.S. authorizations have surpassed $1T (fastest pace on record); could reach $1.3T by year-end. Assuming a 90% execution rate → $1.17T actual executions (record)
- Buyback math: ~$1.17T of VWAP executions over 251 trading days ≈ $4.6B of daily demand (higher in open windows; ~35% lower in blackout)
VII. Volatility Hedging: September Thoughts
📌 Key Insight: Hedge funds/large specs are short VIX at 2022-like extremes.
VIX is down ~69% over 20 weeks — the largest decline on record since 1990. Back-to-school season historically brings vol upticks and potential short covering. Asset managers are adding VIX to hedges.
CFTC VIX Consolidated % Long
January 2022 – August 2025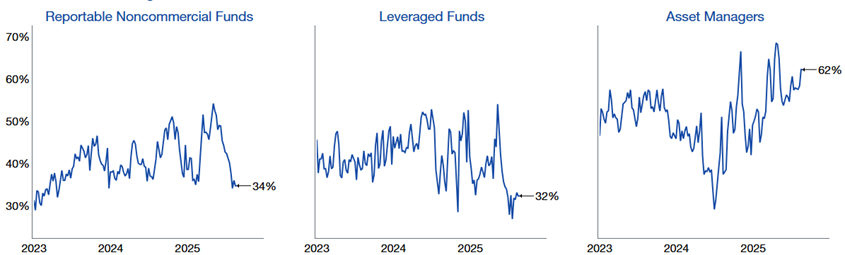
Source: COT report, as compiled by Citadel Securities, as of September 2nd, 2025. Figures are for illustrative purposes only. Past performance figures do not guarantee future results.VIX August Monthly Performance
Since 1990
Source: Bloomberg as compiled by Citadel Securities, as of September 2nd, 2025. Figures are for illustrative purposes only. Past performance figures do not guarantee future results.VII. Institutional Positioning & Systematic Positioning
- Institutions have been drawn back in by relentless buy-the-dip flows, but remain benchmark-conscious
- SPX: No 2% selloff in 91 sessions (longest since 2024)
- CTAs/Vol-Control/Risk Parity: Near max exposure
10. CTA/Trend following: Citadel Securities’ macro strategy team, estimates that equity trend signals are getting weaker from here, given elevated exposure.
US Equity CTA Signals
January 2024 – August 2025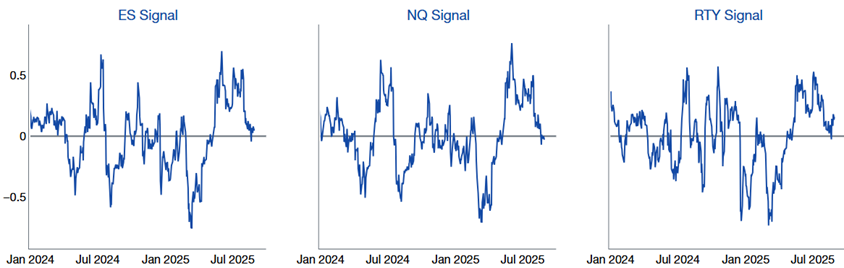
Source: Citadel Securities, as of September 2nd, 2025. Figures are for illustrative purposes only. Past performance figures do not guarantee future results.11. CTA thresholds: Flip levels are getting closer to current spot.
ES1 (S&P 500 futures) ≈ 6,453 and NQ1 (Nasdaq-100 futures) ≈ 23,805 (estimates)
ES1 (S&P 500) CTA Signals
January 2024 – August 2025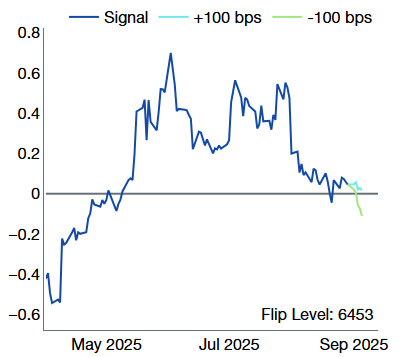
Source: Citadel Securities, as of September 2nd, 2025. Figures are for illustrative purposes only. Past performance figures do not guarantee future results.NQ1 (NDX) CTA Signals
January 2024 – August 2025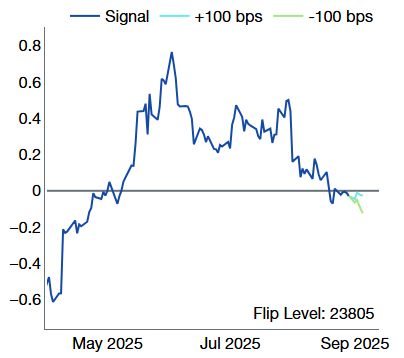
Source: Citadel Securities, as of September 2nd, 2025. Figures are for illustrative purposes only. Past performance figures do not guarantee future results.12. CFTC Net Longs: Positioning rising back toward historical averages.
CFTC S&P 500 Consolidated % Long
January 2022 – August 2025
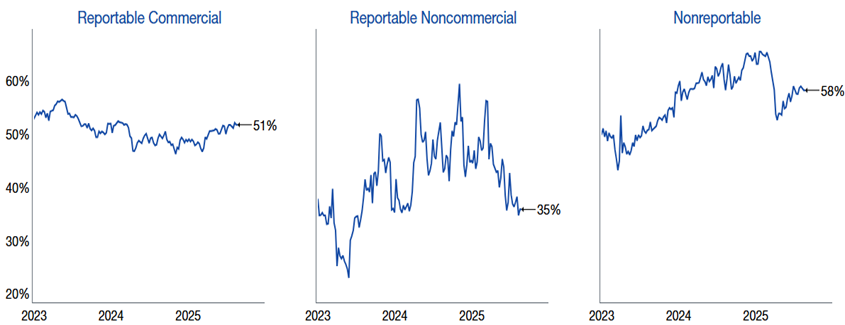
Source: COT report, as compiled by Citadel Securities, as of September 2nd, 2025. Figures are for illustrative purposes only. Past performance figures do not guarantee future results.CFTC NDX 100 Consolidated % Long
January 2022 – August 2025
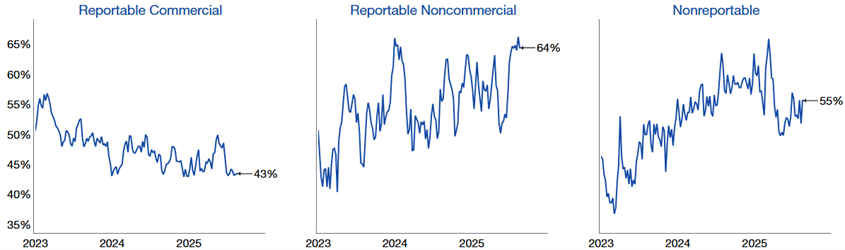
Source: COT report, as compiled by Citadel Securities, as of September 2nd, 2025. Figures are for illustrative purposes only. Past performance figures do not guarantee future results.13. Vol-Control strategies – which take cues from the realized volatility market – have already increased exposure substantially. This is one of the sharpest rebounds in equity exposure we’ve seen.
5% risk target: 35% exposure (up from 10% in April)
Vol Target Exposure with 5% Risk Control
Exposure Rank since 2020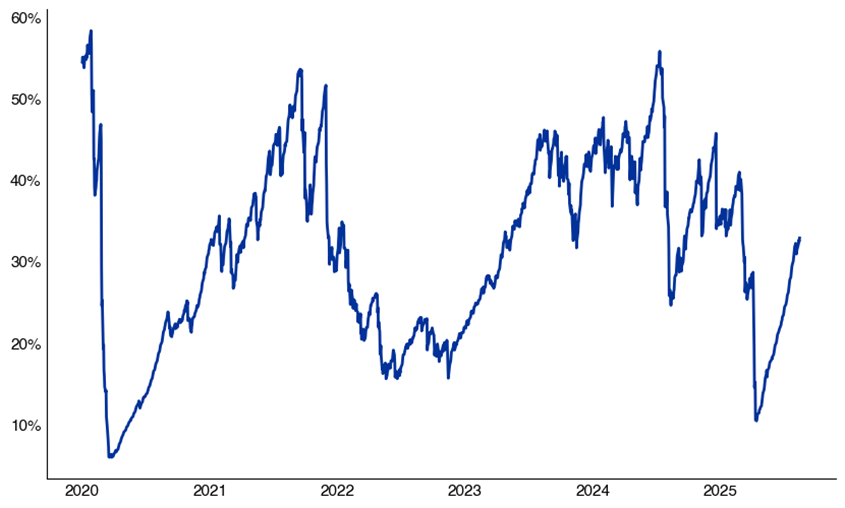
Source: Bloomberg as compiled by Citadel Securities, as of September 2nd, 2025. Figures are for illustrative purposes only. Past performance figures do not guarantee future results.14.10% volatility target strategies are now at 70% exposure (up from 20% in April)
Vol Target Exposure with 10% Risk Control
Exposure Rank since 2020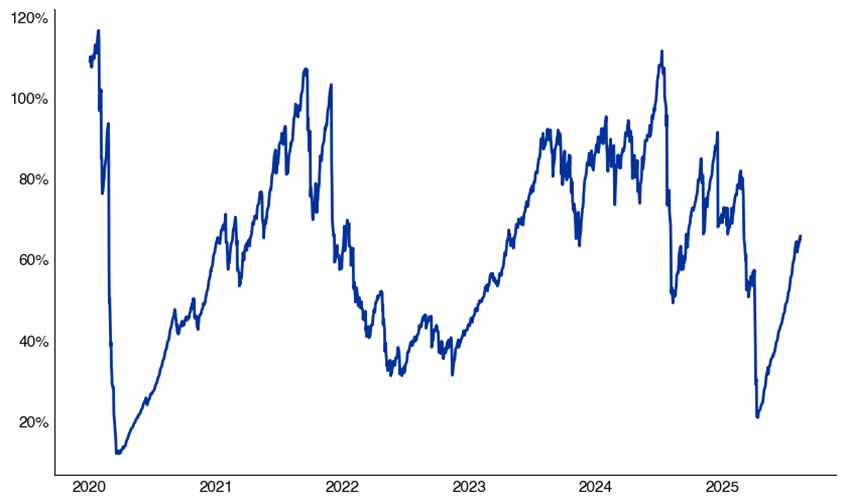
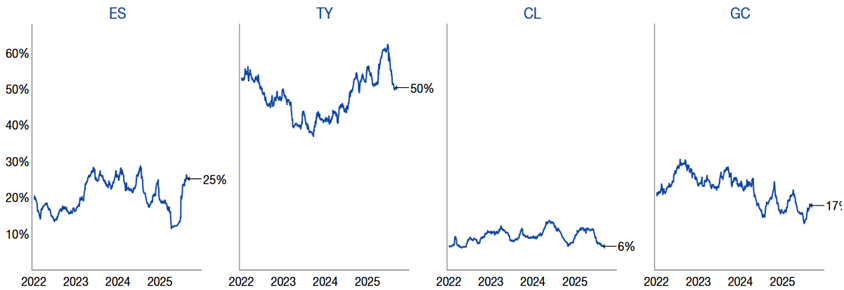
Source: Bloomberg as compiled by Citadel Securities, as of September 2nd, 2025. Figures are for illustrative purposes only. Past performance figures do not guarantee future results.15. Risk Parity strategies – driven by lower cross-asset volatility – now hold equity exposure near their 3-year average of 25% exposure.
Systematic positioning remains elevated → watch for volatility moves, as unwind flows skew moves to the downside.
Risk Parity Exposure
Jan 2022 – August 2025
Source: Citadel Securities, as of September 2nd, 2025. Figures are for illustrative purposes only. Past performance figures do not guarantee future results.16. Sentiment: Normalized; limited upside from further shifts.
AAII Equity Asset Allocation (%)
Jan 2022 – August 2025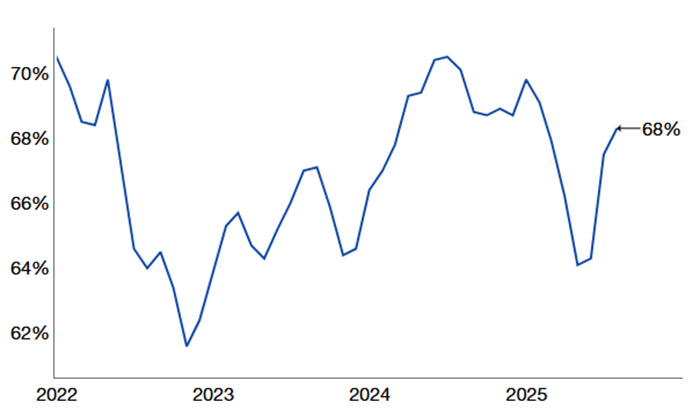
Source: AAII, as reported by Bloomberg and compiled by Citadel Securities, as of September 2nd, 2025. Figures are for illustrative purposes only. Past performance figures do not guarantee future results.17. CNN Fear & Greed Index: ~64 (75 = “extreme greed”), as of Sep 2, 2025
IX. Macro Catalysts on the September Calendar
📌 Key Dates we’re watching:
- Tue, Sep 2 – Back to school → First question: do we have enough hedges?
- Wed, Sep 3 –Conference season / earnings updates → 16 sell-side conferences in the first two weeks; have sell side analysts become too bullish post–Q2 earnings upgrades?
- Fri, Sep 5 – Nonfarm Payrolls (important, but <1% SPX implied move) → Still the Fed’s linchpin. Upside = sticky inflation; downside = growth/recession fears.
- Tue, Sep 9 – QCEW revisions → Retroactive reset of job growth (downward = earlier cuts; upward = resilience).
- Wed, Sep 10 – PPI → Early inflation read (hot = margin risk; soft = disinflation).
- Thu, Sep 11 – CPI → With FOMC a week later, even a 0.1–0.2% miss could swing policy odds.
- Mon, Sep 15 – Corporate Tax Day (Q3) → System cash flows as C- and S-Corps make estimated payments
- Wed, Sep 17 – FOMC meeting → New dot plot/projections. Markets price 2025 cuts; a shift would ripple across yields, equities, and USD.
- Fri, Sep 19 September OpEx (triple-witching)→One of the largest option expirations on record; amplified vol and restriking of hedges likely. This made significantly reduce the long gamma position.
- Tue, Sep 30 – Quarter-end rebalancing → Mechanical flows: potential bond inflows and megacap trimming.
- Policy swing factor — IEEPA tariff ruling. Headline risk for global trade over the next month+.
IX. GMI | September Watchlist (ranked)
- Q3 rebalancing flows
- Corporate blackout mid-September → demand falls
- Retail participation fading
- Record option-expiry risk, reduce long gamma buffer
- CTA & Vol-Control at full exposure → downside skew
- September = weakest month for SPX (since 1928)
- Volatility seasonality risk (since 1990)
- Cyclicals/high beta prone to mean reversion
- Elevated anti-momentum rotation risk
📌 Takeaway: After a summer of relentless upside and heavy positioning, September historically brings a shift. With systematic strategies maxed out, corporate demand waning into blackout, seasonality turning negative, and volatility set to rise, downside hedges are especially prudent.
Copyright © Citadel Enterprise Americas LLC or one of its affiliates. All rights reserved.
Legal Entities Disseminating this Material: This material is disseminated in the United Kingdom by Citadel Securities (Europe) Limited (“CDGE”) authorized and regulated by the Financial Conduct Authority (“FCA”) (Registered company number: 05462867); in the European Union by Citadel Securities GCS (Ireland) Limited (“CSGI”) and its Paris Branch authorized and regulated by the Central Bank of Ireland (“CBI”) (Registration Number: C173437); in Hong Kong by Citadel Securities (Hong Kong) Limited (“CDHK”) licensed by the Securities and Futures Commission of Hong Kong (“SFC”), in Japan by Citadel Securities Japan Co., Ltd (“CSJC”) registered as a Type 1 financial instruments business operator with the Japan Financial Services Agency (“JFSA”); and in the United States of America by Citadel Securities LLC (“CDRG”) registered with the Securities Exchange Commission (“SEC”), Financial Industry Regulatory Authority (“FINRA”), and Securities Investor Protection Corporation (“SIPC”), Citadel Securities Institutional LLC (“CSIN”) registered with the SEC, FINRA, and SIPC, or Citadel Securities Swap Dealer LLC (“CSSD”) registered with the SEC, Commodities Futures Trading Commission (“CFTC”), and National Futures Association (“NFA”). Unless governing law permits otherwise, you must contact a Citadel Securities entity in your home jurisdiction if you want to use our services in effecting a transaction in any financial instruments or securities, including derivatives.
FOR INSTITUTIONAL USE ONLY; FOR PROFESSIONAL CLIENTS AND ELIGIBLE COUNTERPARTIES ONLY. This material is not intended as and does not constitute investment research. Contents of this material will be strictly limited to non-specific, generic information (i.e. macro events/topics) and are not subject to the Markets in Financial Instruments directive (MiFID II) or FINRA research rules. This material does not constitute an offer, solicitation, invitation, or inducement to purchase, acquire, subscribe to, provide, or sell any financial instrument or otherwise engage in investment activity. Please see additional important disclosures, including disclosures that may be relevant to your country of residence or business at www.citadelsecurities.com/GlobalSalesTrading.
Explore
Market Insights - What We Do