-
Who We Are
- What We Do
Series: Global Market IntelligenceSeptember Preview
By Scott Rubner
Bottom Line: Saying Goodbye to August’s Positive Flow-of-Funds Dynamics
While my near-term view on equities remains constructive, the positioning tailwind that supported markets in August is likely to flip into a headwind post-Labor Day. With systematic strategies already near peak equity exposure, seasonality turning negative, and volatility historically rising, downside equity hedges look increasingly timely into a busy macro calendar.
Snapshot
September is historically the weakest month for equities, with volatility rising and retail participation fading. With systematic strategies — including CTAs, Vol-Control, and Risk Parity — already near max allocation, and corporate demand set to slow, risk/reward skews to the downside, making hedges attractive. The longer-term trend remains in place and supportive for a Q4 rally.
It is time for a thread.

I. On-the-Ground Sentiment (Citadel Securities)
Client activity remains robust at record equity market levels, even the Dow Jones Industrial Average made a new high — a key benchmark for household / 401k sentiment.
- Retail Equities: Retail net buyers in 16 of the last 18 weeks
- Retail Options: 16-week net buying streak, 17 of last 18 weeks
- Institutional Options: Bullish tone in 5 of the last 7 weeks
II. This Week’s Strategic Debate: Can record options activity persist?
- Equity option contract volumes tracking all-time highs.
- 0 days-to-expiry (0DTE) flow continues to expand.
- 71M option contracts traded on Friday (per OCC)
- 58M option contracts YTD 2025.
I believe this surge is structural, not cyclical — a reflection of consumer health and market engagement, not a passing fad.
US Equity Call Options, 3-month average, contracts in millions.
1992 – 2025
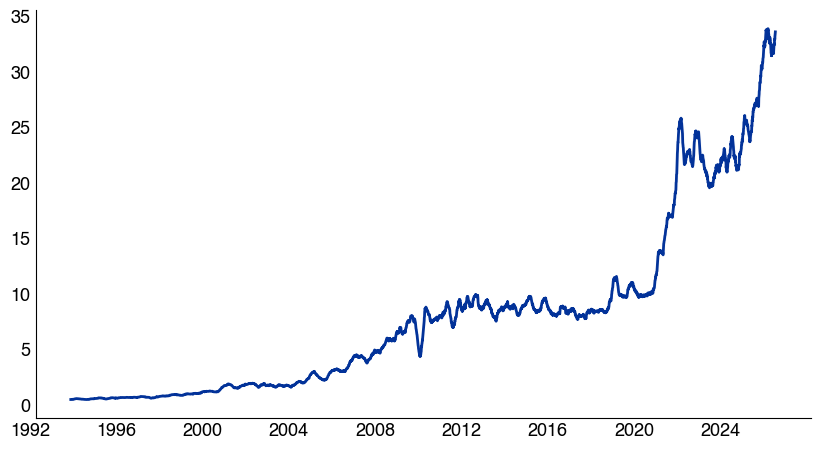
Source: Options Clearing Corporation, as reported by Bloomberg and compiled by Citadel Securities, as of 8/19/25. Figures are for illustrative purposes only. Past performance figures do not guarantee future results.US Equity Put Options, 3-month average, contracts in millions.
1992 – 2025
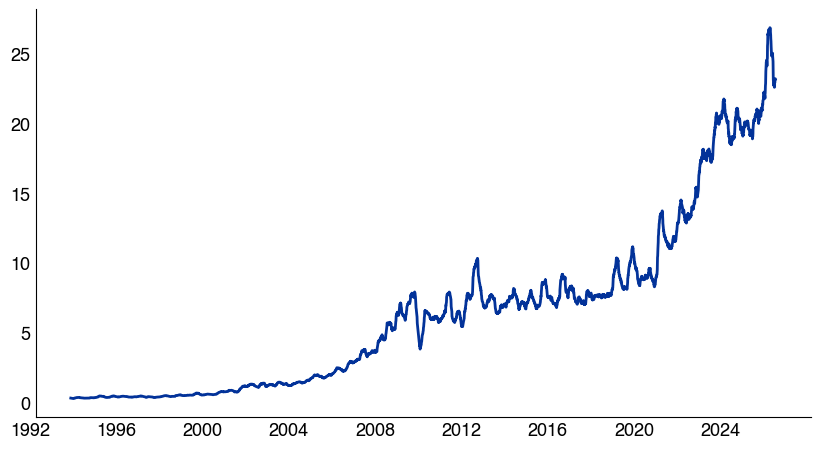
Source: Options Clearing Corporation, as reported by Bloomberg and compiled by Citadel Securities, as of 8/19/25. Figures are for illustrative purposes only. Past performance figures do not guarantee future results.US Equity Calls compared to Total Options, %
1992 – 2025
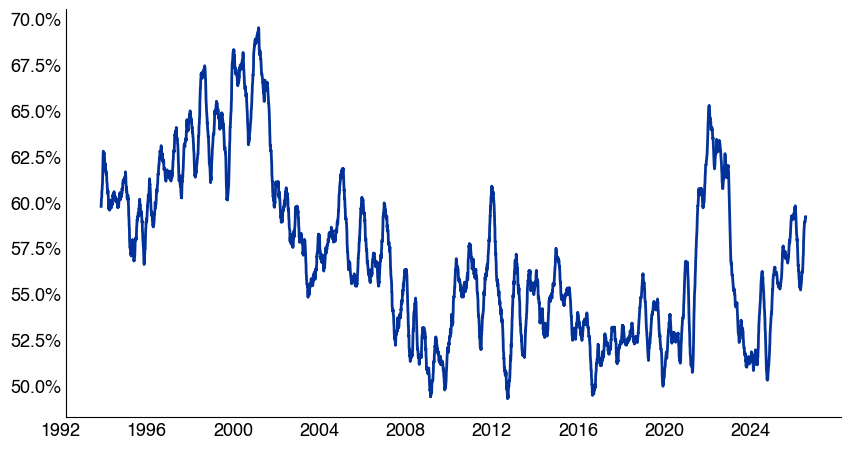
Source: Options Clearing Corporation, as reported by Bloomberg and compiled by Citadel Securities, as of 8/19/25. Figures are for illustrative purposes only. Past performance figures do not guarantee future results.III. Seasonality Watch: Q3 Asset Allocation Rebalancing
September Setup
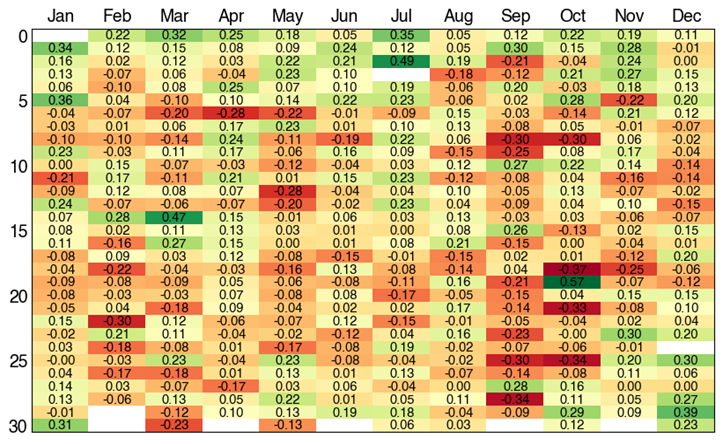
- September 3rd has historically marked the monthly high for SPX since 1928.
- Post-Labor Day FOMO tends to fade → curtailing buy-the-dip flows.
- Quarter-end portfolio rebalancing intensifies in September.
- 2025 has closely mirrored the historical composite pattern
SPX September Monthly Performance
1928 – Today
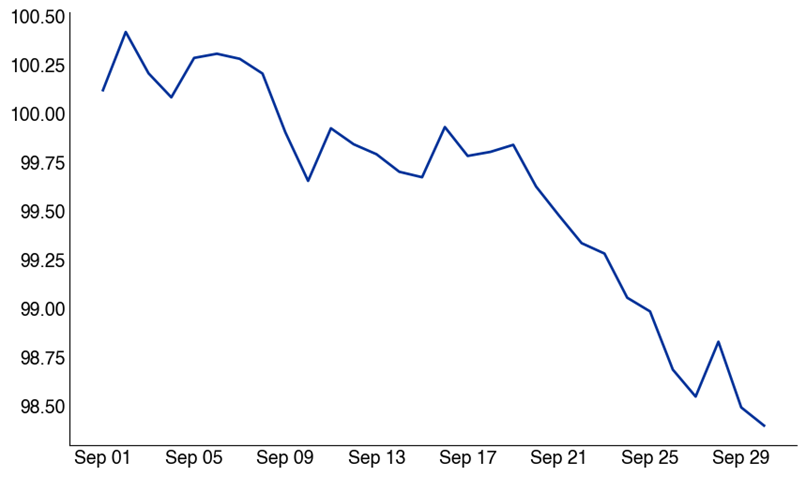
Source: Bloomberg as compiled by Citadel Securities, as of 8/19/25. Figures are for illustrative purposes only. Past performance figures do not guarantee future results.NDX September Monthly Performance
1985 – Today
Source: Bloomberg as compiled by Citadel Securities, as of 8/19/25. Figures are for illustrative purposes only. Past performance figures do not guarantee future results.SPX 500 Daily Performance Quilt
1928 – Today
Source: Bloomberg as compiled by Citadel Securities, as of 8/19/25. Figures are for illustrative purposes only. Past performance figures do not guarantee future results.IV. Retail Positioning – Summer Series
1. Citadel Securities’ retail equities: Net buyers in 16 of the last 18 weeks, rebounding after April weakness.
Retail Cash Equities – Net Notional by Week (Std Dev)
January – August 2025
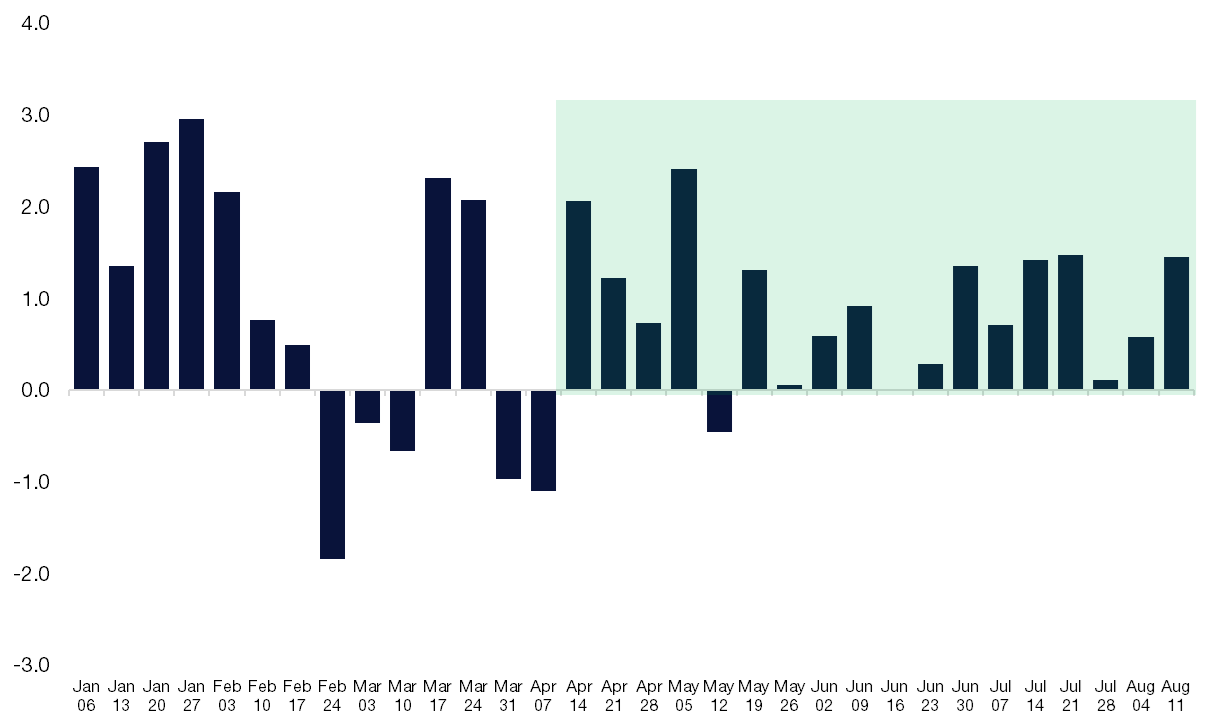
Source: Citadel Securities, as of 8/19/25. Figures are for illustrative purposes only. Past performance figures do not guarantee future results.2. Citadel Securities Retail Trend: Citadel Securities retail clients have been buyers for 19 consecutive months of both net notional and shares buying.
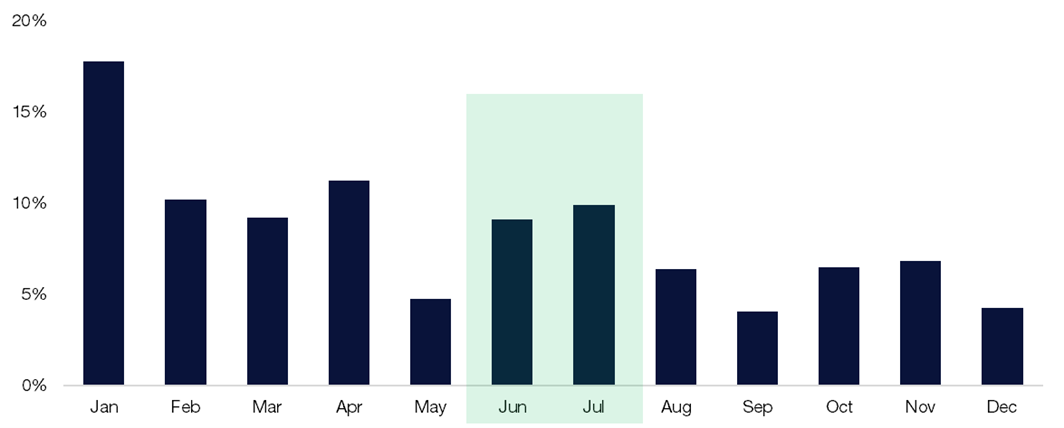
3. Citadel Securities’ retail cash seasonality demand trends from the last 8 years.
- June & July = Strong
- August = Slower
- September = Weakest
Retail Cash – Proportion of Net Notional By Month
August 1, 2017 – July 31, 2025
Source: Citadel Securities, as of 8/19/25. Figures are for illustrative purposes only. Past performance figures do not guarantee future results.V. Volatility and Options Positioning
4. Citadel Securities’ Retail Options Activity: July 2025 set a new monthly volume record.
Retail Options – Average Monthly Options Volume
Std Dev, normalized to January 2020
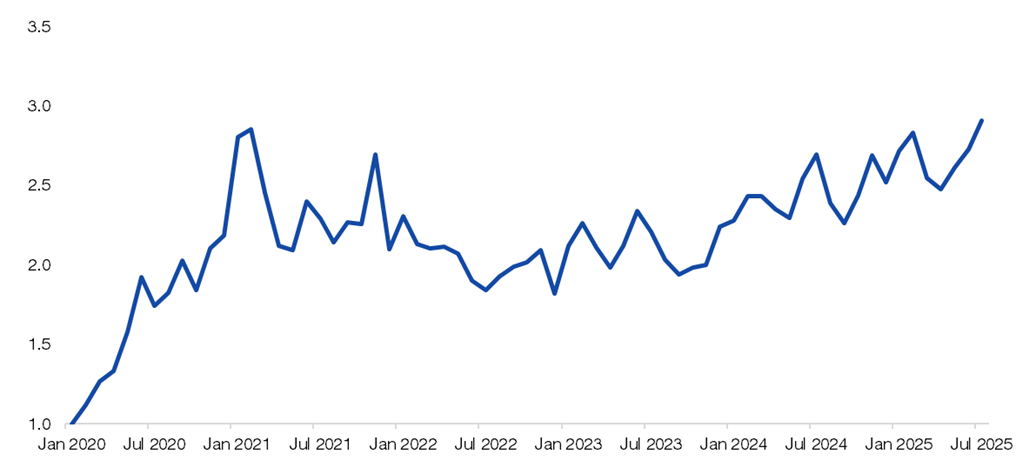
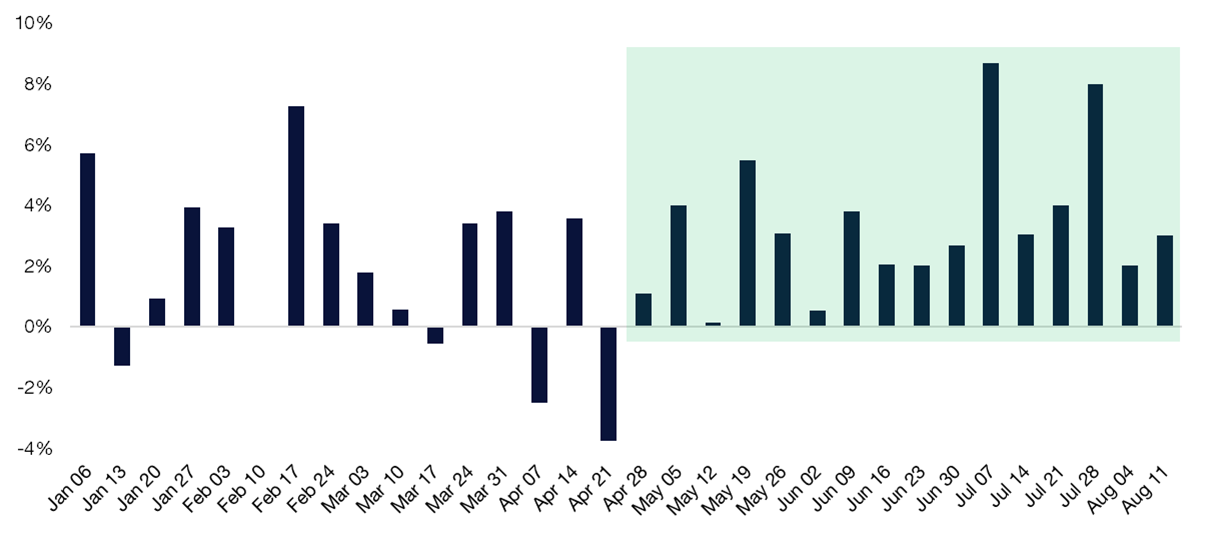
Source: Citadel Securities, as of 8/19/25. Figures are for illustrative purposes only. Past performance figures do not guarantee future results.5. Citadel Securities’ Retail Option bullish streak continues.
- 16-week net buying streak
- Friday’s activity hit the 98th percentile, 34% above 12-month average.
Retail Options – Call / Put Direction Ratio by Week (%)
January – August 2025
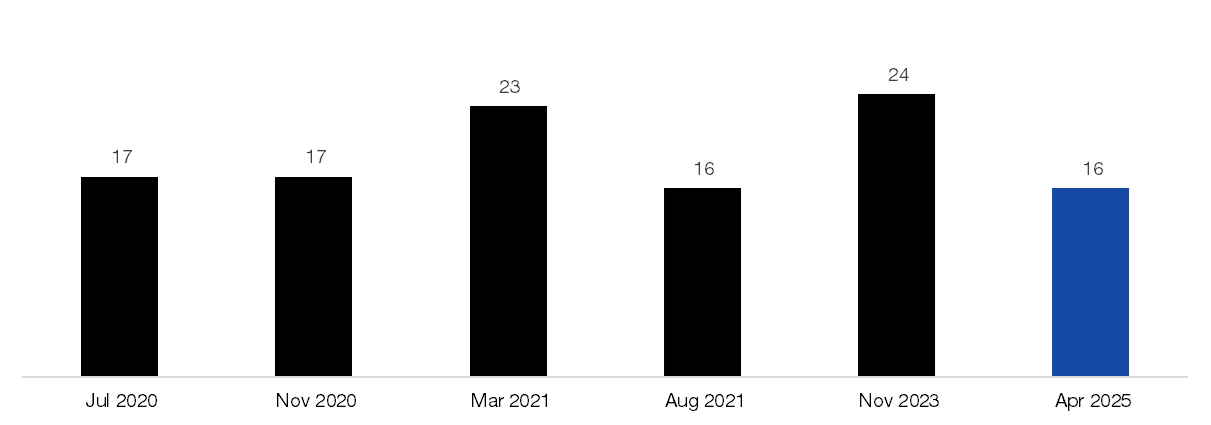
Source: Citadel Securities, as of 8/19/25. Figures are for illustrative purposes only. Past performance figures do not guarantee future results.6. Citadel Securities’ Bullish Retail Options Streak Watch
- This is now tied for 6th-longest bullish streak since 2020, with 16 straight weeks of demand.
- The top five streaks averaged 18 weeks: suggesting another two weeks of potential demand.
Longest Retail Weekly Option Buying Streaks on Record, since 2020.
# of weeks
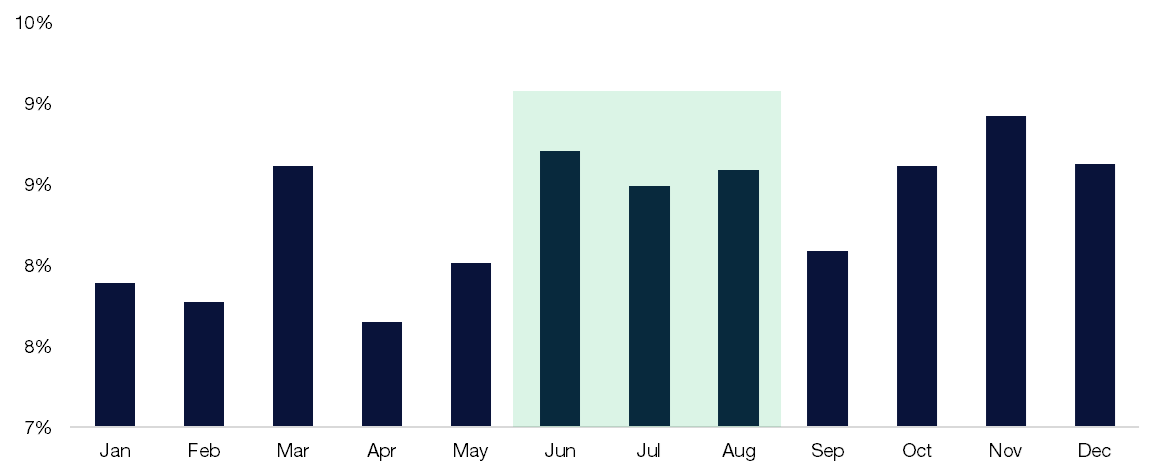
Source: Citadel Securities, as of 8/19/25. Figures are for illustrative purposes only. Past performance figures do not guarantee future results.7. Back to School? Seasonal Drop Ahead?
Citadel Securities’ retail options volume typically wanes in September before rebounding into the final quarter of the calendar year. Activity picks back up in Q4.
Retail Options – Proportion of Contract Volume by Month
January 2020 – December 2024
Source: Citadel Securities, as of 8/19/25. Figures are for illustrative purposes only. Past performance figures do not guarantee future results.8. Citadel Securities Institutional Options clients are also bullish.
- Turned bullish in 5 of the last 7 weeks.
- Institutional Options clients moved from bearish to bullish in the last month.
- We have seen anti-momentum right tail hedges in lower quality assets.
Institutional Options –Call/Put Direction Ratio by Week
January – August 2025
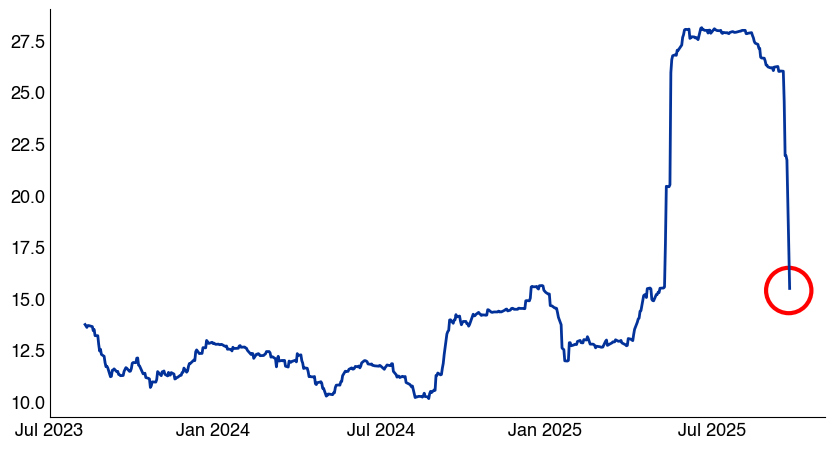
Source: Citadel Securities, as of 8/19/25. Figures are for illustrative purposes only. Past performance figures do not guarantee future results.9. Did the realized volatility market give the all-clear signal to systematic re-leveraging? VIX = 14.99
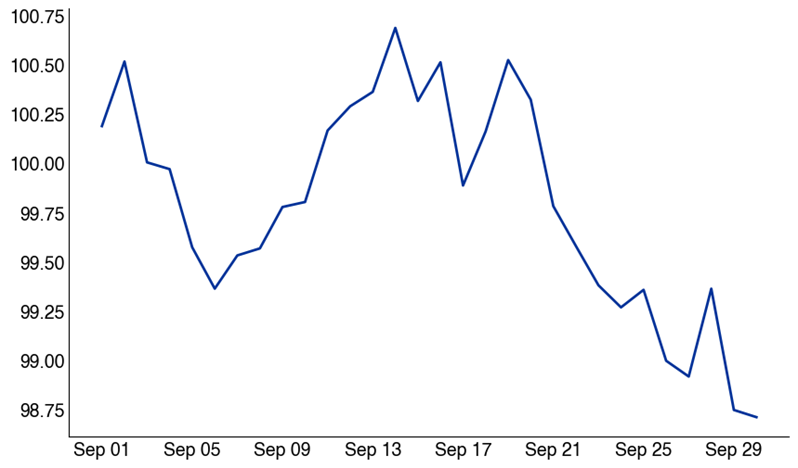
3-month realized vol has fallen sharply, dropping 10 percentage points in two weeks as high-vol periods rolled off. This high implied vol has helped create a long dealer gamma position in the marketplace.
- SPX 3M realized = 15 (down sharply from earlier highs)
- SPX 2M realized = 10
- SPX 1M realized = 9
- Systematic re-leveraging has been fueled by this collapse in realized vol + vol selling strategies
SPX 3-month realized volatility
August 2023 – August 2025
Source: Bloomberg as compiled by Citadel Securities, as of 8/19/25. Figures are for illustrative purposes only. Past performance figures do not guarantee future resultsVI. Corporate Earnings Upgrades & Passive Flow Dynamics
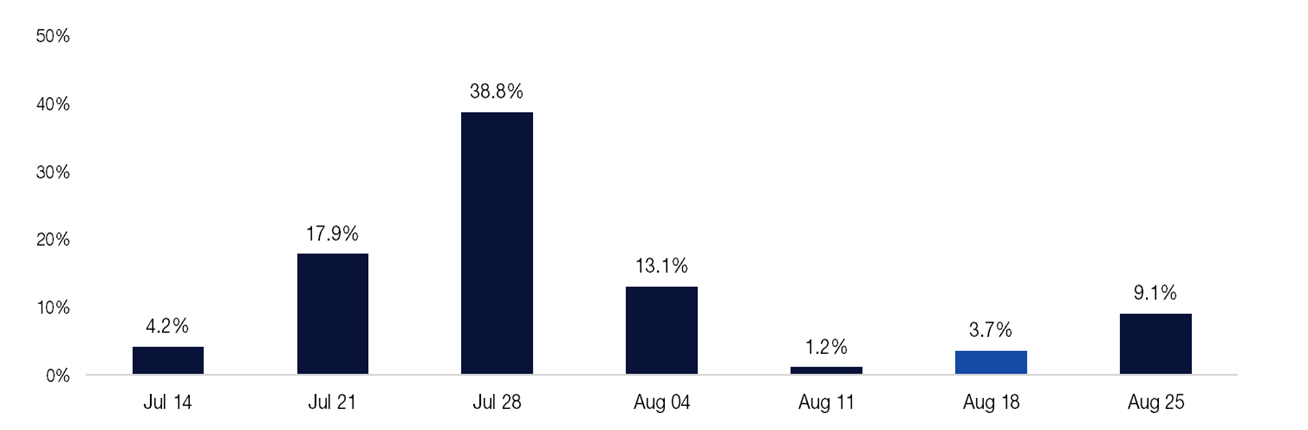
10. Q2 Earnings: 80% of SPX market cap has reported, with eyes on the state of the consumer and macro environment through WMT / TGT / HD reporting this week.
SPX Market Cap reporting by week
Q2 earnings
Source: Bloomberg as compiled by Citadel Securities, as of 8/19/25. Figures are for illustrative purposes only. Past performance figures do not guarantee future results.11. At the August peak buyback window, Tech remained the dominant source of corporate demand
According to Birinyi Associates, US companies announced share repurchases totaling $166 billion last month, the highest dollar value on record for July. The prior record was $88 billion in July 2006.
Additionally, US corporates have announced $983 billion worth of authorizations YTD, the strongest start on record (according to Birinyi Associates). Corporate executions are tracking towards $1.1 trillion, which would also mark a new high.
12. 2025 corporate daily notional demand: $1.1 trillion over 251 trading days → $4.4 billion/day in equity demand, according to Birinyi Associates. August is historically one of the best months of the year for executions.
- The next corporate blackout window will start mid-September.
13. Earnings season for the Magnificent 7 concludes with Nvidia on Wednesday 8/27.
SPX GICS Sector by Market Cap
Earnings reporting schedule
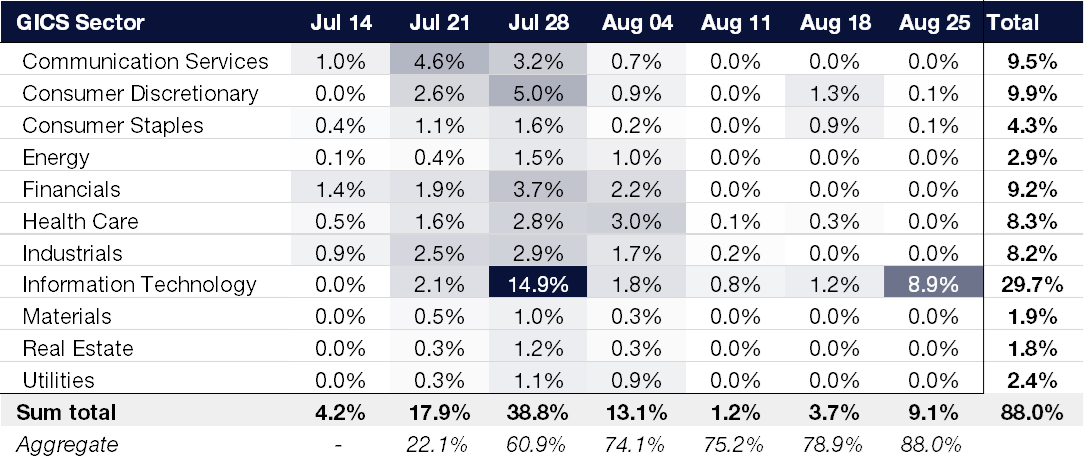
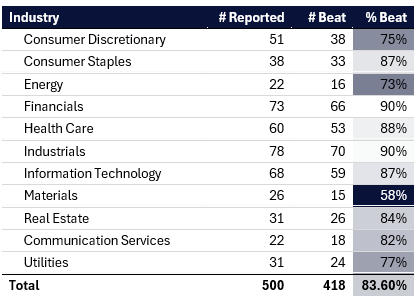
Source: Bloomberg as compiled by Citadel Securities, as of 8/19/25. Figures are for illustrative purposes only. Past performance figures do not guarantee future results.14. Earnings Upgrades: US Earnings Revision Momentum is at the highest since 2021.
2Q 2025 SPX 500 EPS Growth: +11% vs. 4% expected — strongest since Q2 2021
- According to Bloomberg, Q2 EPS beat rate of 83% exceeds the 10-year average of 74%.
- Are we at the peak of analysts upgrades in your inbox for Q2?
SPX Earnings Reporting by GICs Sector
As of August 19, 2025
Source: Bloomberg as compiled by Citadel Securities, as of 8/19/25. Figures are for illustrative purposes only. Past performance figures do not guarantee future results.VII. Sector Concentration Observations
Key Insight: Momentum Dynamics = Earnings beats → passive inflows → price momentum.
Here are the 11 S&P 500 GICs sectors for the S&P 500 market capitalization index (‘SPX’) and S&P 500 equal weighted index (‘SPW’).
Tech weighting in SPX: 34.3% vs. 13.8% in SPW → +20.5% spread
11 S&P 500 GICs sectors by SPX % market capitalization:
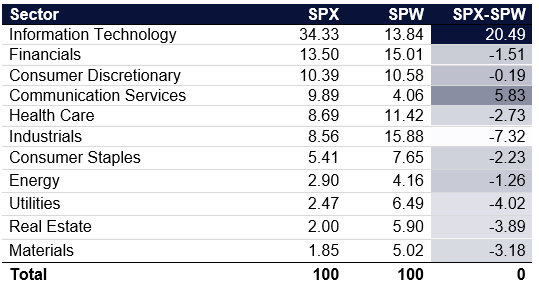
Source: Bloomberg as compiled by Citadel Securities, as of 8/12/25. Figures are for illustrative purposes only. Past performance figures do not guarantee future results.This concentration intensifies passive flows into a narrower band of equities; this drives “Magnificent 7” vs. remaining 493.
- Semiconductors: 13.7% (SPX) vs. 3.9% (SPW)
- Software: 11.6% (SPX) vs. 3.9% (SPW)
This narrow breadth in the top names, has created more frequent unwinds and squeezes on the short leg of the pair trade.
Top 12 S&P 500 GICs industries by SPX % market capitalization:
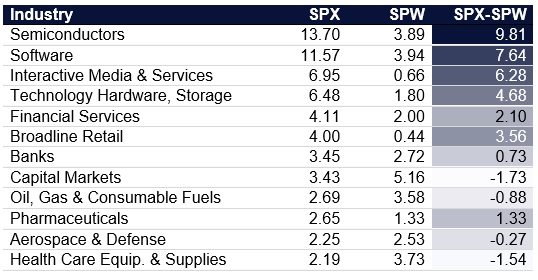
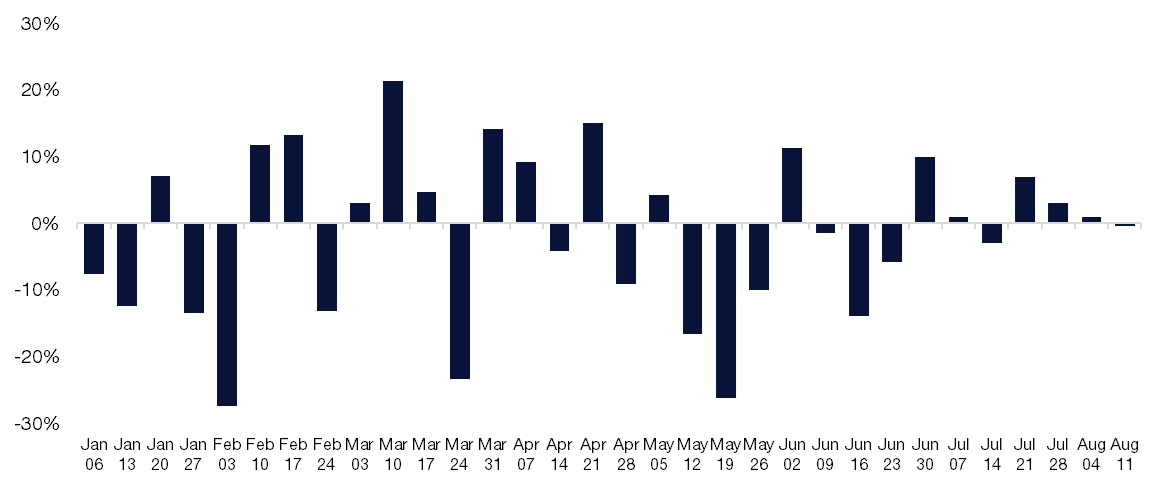
Source: Bloomberg as compiled by Citadel Securities, as of 8/12/25. Figures are for illustrative purposes only. Past performance figures do not guarantee future results.15. August Final Push
The most common “two-weeker” of global Wall Street started yesterday.
The final week of August often coincides with low volumes due to vacations, and barbeques contributing to upward drift in stocks, especially in low-volume environments.
SPX August Daily Performance
Since 1928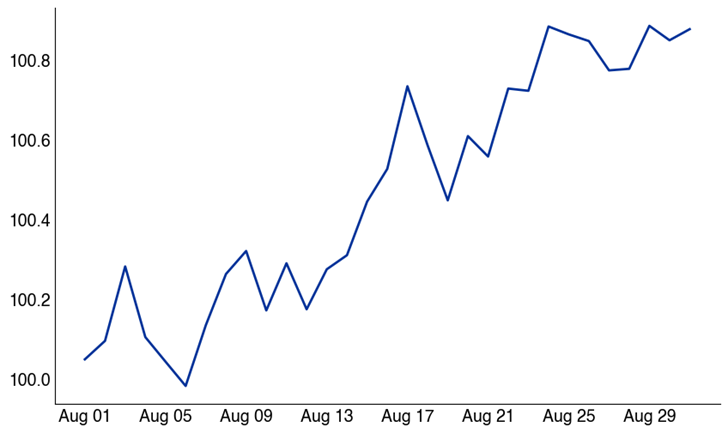
Source: Bloomberg as compiled by Citadel Securities, as of 8/5/25. Figures are for illustrative purposes only. Past performance figures do not guarantee future results.VII. Institutional Positioning and Systematic Re-Leveraging
a. Institutional investors have been drawn back into the market in by the relentless buy-the-dip crowd to keep up with benchmarks.
b. Systematic strategy (CTA/Trend, Vol-Control, Risk Parity) demand is near maximum equity levels. NEIXCTAT Index (the Commodity Trading Advisor proxy for performance) has recovered from the Liberation Day lows.
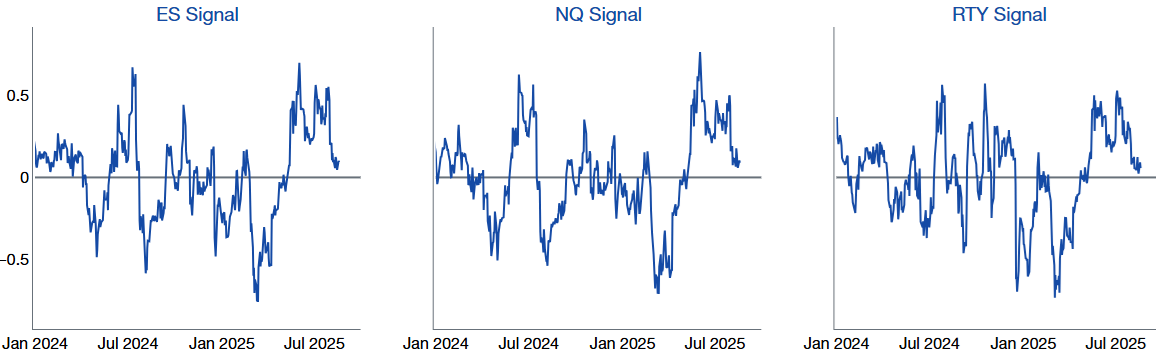
16. CTA/Trend following: We estimate trend followers are now near fully exposed heading into late August. Our model indicates they are no longer adding at current levels – suggesting limited incremental upside.
US Equity Aggregate CTA Positioning
January 2024 – July 2025
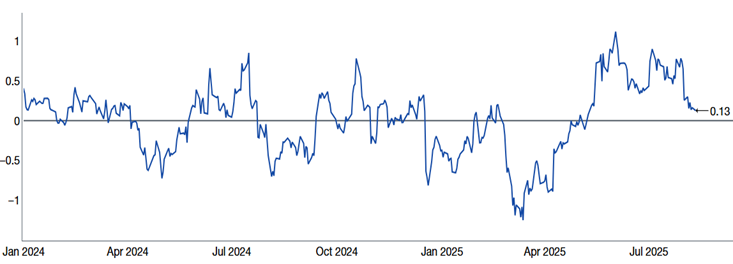
Source: Citadel Securities, as of 8/12/25. Figures are for illustrative purposes only. Past performance figures do not guarantee future results.US Equity CTA Signals
January 2024 – August 2025
Source: Citadel Securities, as of 8/19/25. Figures are for illustrative purposes only. Past performance figures do not guarantee future results.17. CFTC Net Longs: Positioning rising back towards historical averages.
CFTC S&P 500 Consolidated % Long
January 2022 – August 2025
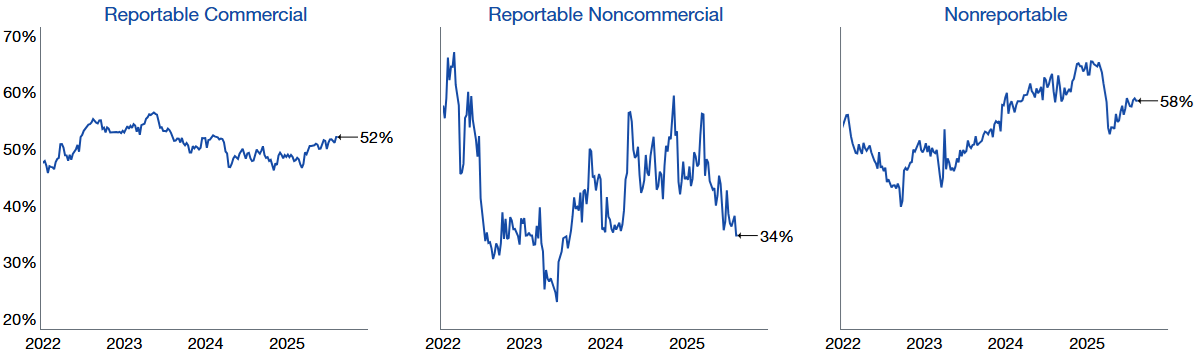
Source: COT report, as compiled by Citadel Securities, as of 8/19/25. Figures are for illustrative purposes only. Past performance figures do not guarantee future results.CFTC NDX 100 Consolidated % Long
January 2022 – August 2025
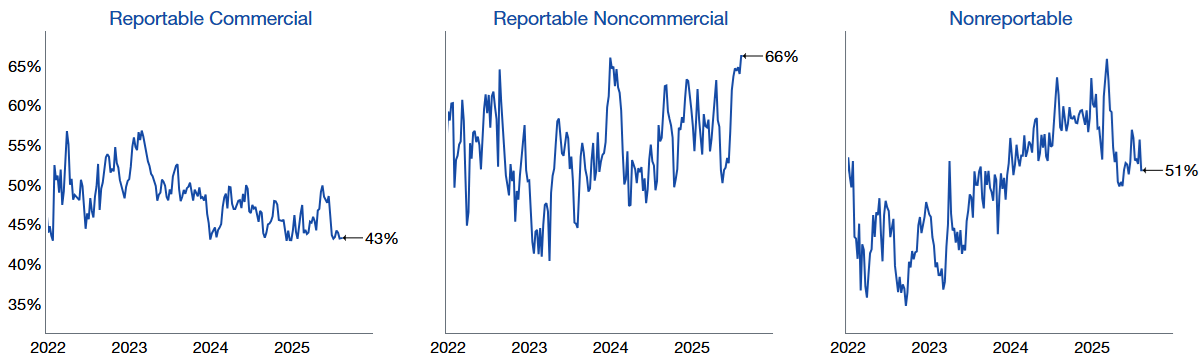
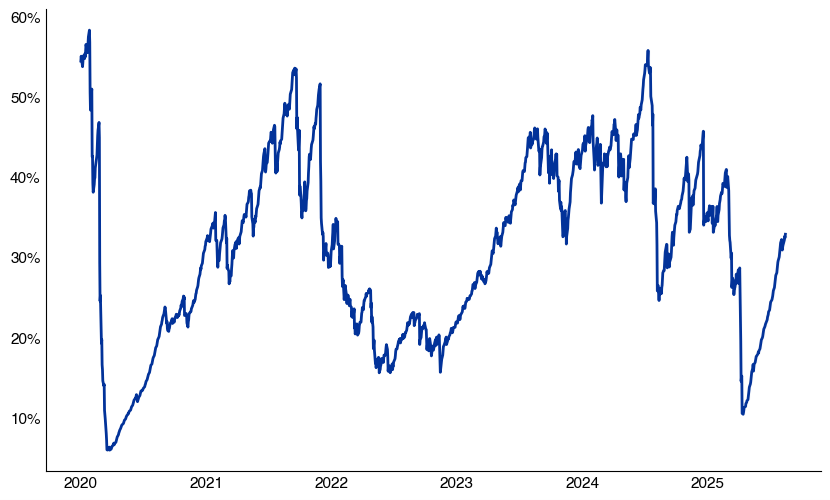
Source: COT report, as compiled by Citadel Securities, as of 8/19/25. Figures are for illustrative purposes only. Past performance figures do not guarantee future results.18. Vol-Control strategies – which take cues from the realized volatility market – have already increased exposure substantially.
5% risk target: 33% exposure (up from 10% in April)
Vol Target Exposure with 5% Risk Control
Exposure Rank since 2020
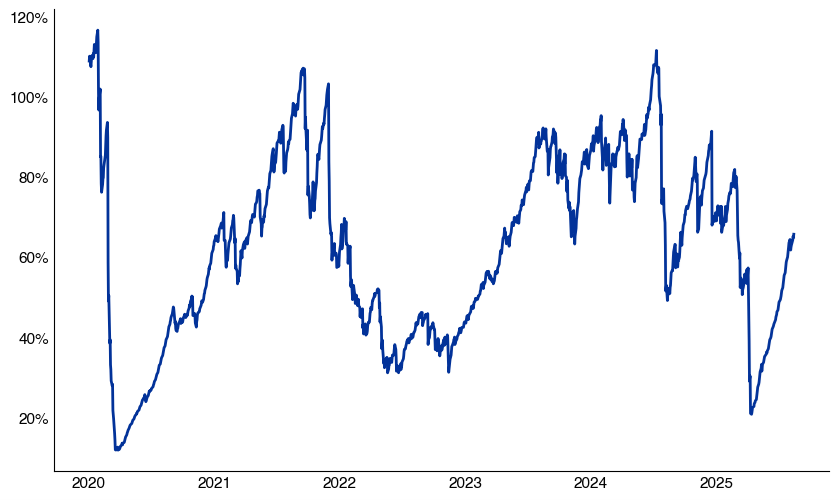
Source: Bloomberg as compiled by Citadel Securities, as of 8/19/25. Figures are for illustrative purposes only. Past performance figures do not guarantee future results.19. 10% volatility target strategies are now at 66% exposure (up from 20% in April)
Vol Target Exposure with 10% Risk Control
Exposure Rank since 2020
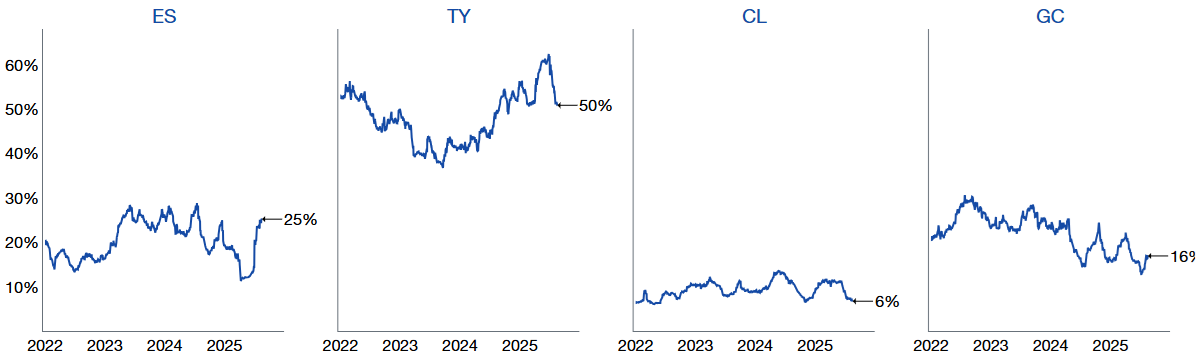
Source: Bloomberg as compiled by Citadel Securities, as of 8/19/25. Figures are for illustrative purposes only. Past performance figures do not guarantee future results.20. Risk Parity strategies – driven by lower cross-asset volatility – now hold equity exposure near their 3-year average of 25% exposure.
Systematic positioning remains elevated → watch for volatility moves, as flows skew moves to the downside.
Risk Parity Exposure
Jan 2022 – August 2025
Source: Citadel Securities, as of 8/19/25. Figures are for illustrative purposes only. Past performance figures do not guarantee future results.21. Sentiment Normalization: AAII allocations normalized back to long-term averages – less upside from sentiment shifts.
AAII Equity Asset Allocation (%)
Jan 2022 – August 2025
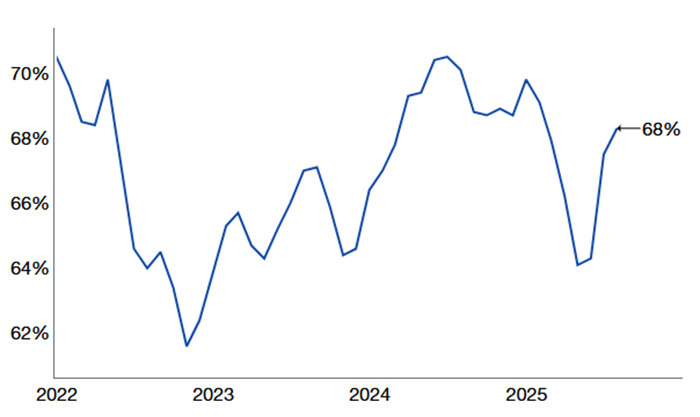
Source: AAII, as reported by Bloomberg and compiled by Citadel Securities, as of 8/19/25. Figures are for illustrative purposes only. Past performance figures do not guarantee future results.22. CNN Fear and Greed Sentiment Index rising, last 66 (75 = extreme greed)
GMI | September Tactical Checklist – things on my radar
- Q3 Asset Allocation Rebalancing
- CTA & Vol-Control near max exposure – risks skew to downside
- September = weakest month for SPX (since 1928)
- Volatility historically rises in September (since 1990)
- Retail participation typically fades in cash and options
- Cyclicals & high beta prone to mean reversion
- Elevated risk of anti-momentum rotations
- Corporate Blackout window begins mid-September
Takeaway: After a summer of strong positioning and relentless upside, September historically brings a shift. With CTAs, Vol Control, and Risk Parity strategies near full allocation, corporate demand slowing into the blackout window, seasonality turning negative, and volatility set to rise, downside hedges appear especially prudent into the macro calendar.
Copyright © Citadel Enterprise Americas LLC or one of its affiliates. All rights reserved.
Legal Entities Disseminating this Material: This material is disseminated in the United Kingdom by Citadel Securities (Europe) Limited (“CDGE”) authorized and regulated by the Financial Conduct Authority (“FCA”) (Registered company number: 05462867); in the European Union by Citadel Securities GCS (Ireland) Limited (“CSGI”) and its Paris Branch authorized and regulated by the Central Bank of Ireland (“CBI”) (Registration Number: C173437); in Hong Kong by Citadel Securities (Hong Kong) Limited (“CDHK”) licensed by the Securities and Futures Commission of Hong Kong (“SFC”), in Japan by Citadel Securities Japan Co., Ltd (“CSJC”) registered as a Type 1 financial instruments business operator with the Japan Financial Services Agency (“JFSA”); and in the United States of America by Citadel Securities LLC (“CDRG”) registered with the Securities Exchange Commission (“SEC”), Financial Industry Regulatory Authority (“FINRA”), and Securities Investor Protection Corporation (“SIPC”), Citadel Securities Institutional LLC (“CSIN”) registered with the SEC, FINRA, and SIPC, or Citadel Securities Swap Dealer LLC (“CSSD”) registered with the SEC, Commodities Futures Trading Commission (“CFTC”), and National Futures Association (“NFA”). Unless governing law permits otherwise, you must contact a Citadel Securities entity in your home jurisdiction if you want to use our services in effecting a transaction in any financial instruments or securities, including derivatives.
FOR INSTITUTIONAL USE ONLY; FOR PROFESSIONAL CLIENTS AND ELIGIBLE COUNTERPARTIES ONLY. This material is not intended as and does not constitute investment research. Contents of this material will be strictly limited to non-specific, generic information (i.e. macro events/topics) and are not subject to the Markets in Financial Instruments directive (MiFID II) or FINRA research rules. This material does not constitute an offer, solicitation, invitation, or inducement to purchase, acquire, subscribe to, provide, or sell any financial instrument or otherwise engage in investment activity. Please see additional important disclosures, including disclosures that may be relevant to your country of residence or business at www.citadelsecurities.com/GlobalSalesTrading.
Explore
Market Insights - What We Do