-
Who We Are
- What We Do
Series: Global Market IntelligenceStructural, not Tactical
By Scott Rubner
Bottom Line: Retail trading activity in the US stock market represents a structural shift rather than a tactical trend. The sustained increase in market participation highlights the strength and resilience of the US consumer. I consider retail engagement to be a meaningful macroeconomic indicator—one that has shown steady growth over time.
Looking ahead to 2026, retail investor portfolio construction combines high imagination alpha generation via call options with beta exposure through passive index products which provides ballast in daily portfolio returns.
20% of the S&P 500 market cap reports earnings in the next two days.
It is time for a thread.

I. Retail Positioning
1. Citadel Securities’ retail flow has been a net buyer of cash equities for 23 consecutive trading sessions, marking the third-longest buying streak since records began in 2017. The last retail net notional sell day across our platform occurred on June 24th, over a month ago.
Longest Retail Cash Buying Streak on Record
# of days
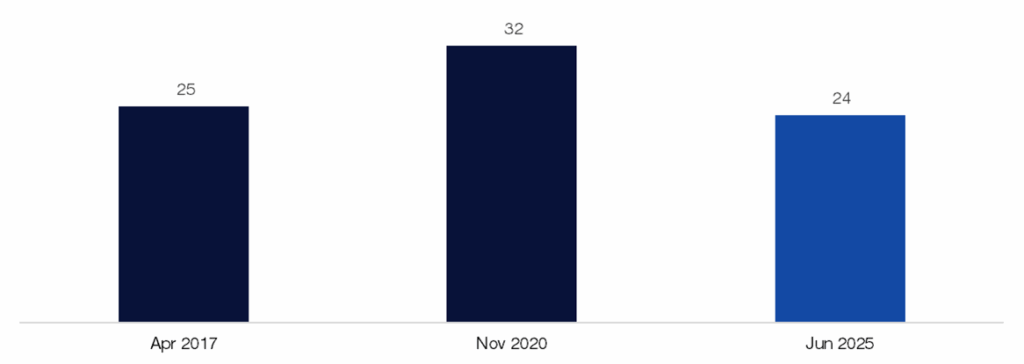
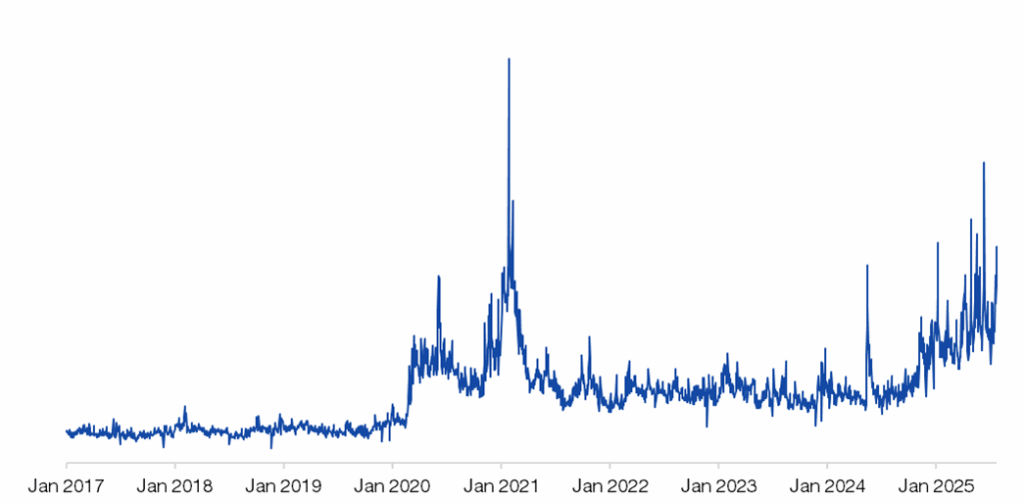
Source: Citadel Securities, as of 7/30/25. Figures are for illustrative purposes only. Past performance figures do not guarantee future results.2. Citadel Securities’ retail activity has increased in recent weeks – especially in low priced shares – though activity remains well below the highs seen during the high-volume days in 2021.
Citadel Securities Retail Total Shares Executed
January 2021 – July 2025
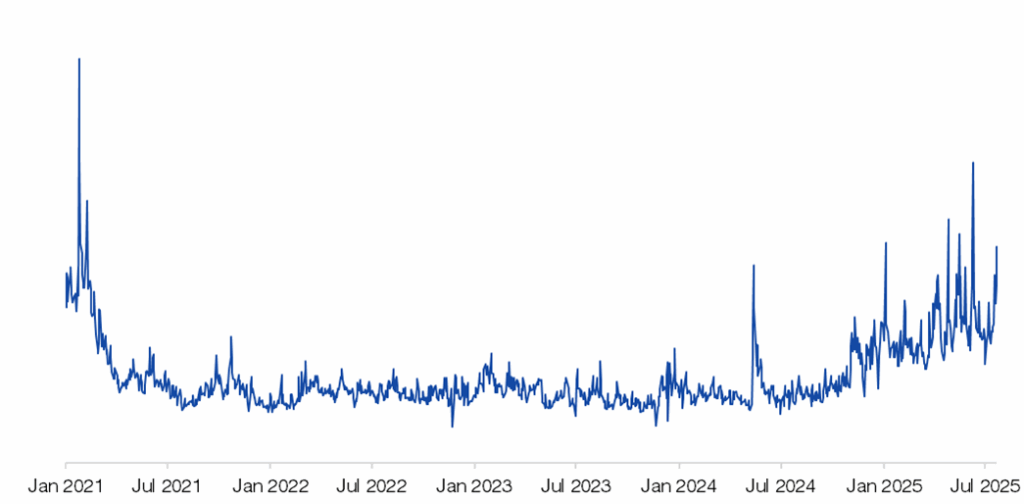
Source: Citadel Securities, as of 7/30/25. Figures are for illustrative purposes only. Past performance figures do not guarantee future results.Citadel Securities Retail Total Shares Executed
January 2017 – July 2025
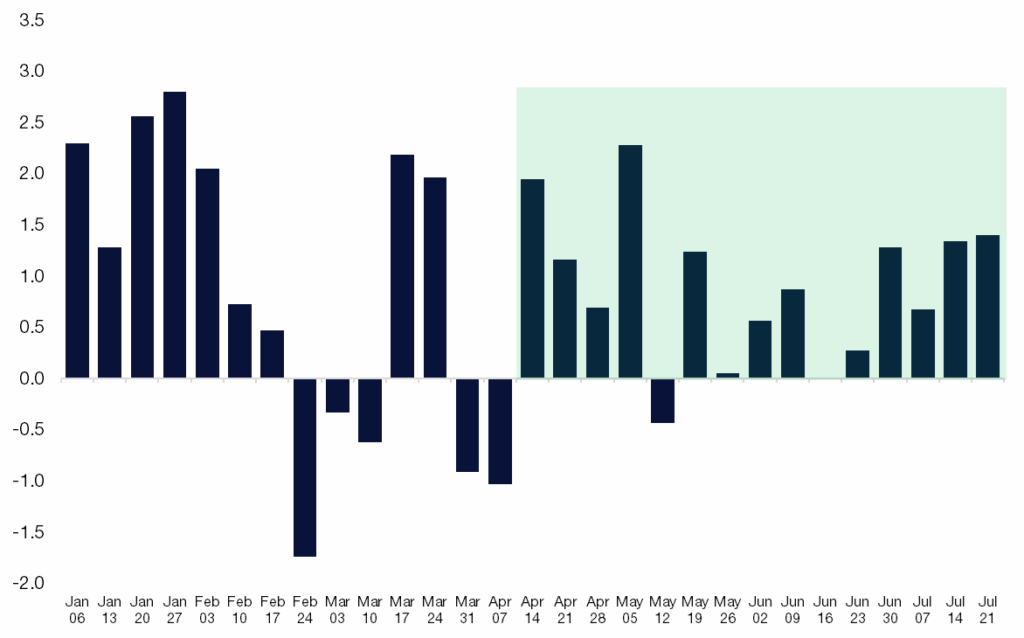
Source: Citadel Securities, as of 7/30/25. Figures are for illustrative purposes only. Past performance figures do not guarantee future results.3. Citadel Securities’ retail activity has been a buyer of cash equities in 13 out of the past 15 weeks following Liberation Day.
Retail Cash Equities – Net Notional by Week
Std Dev January – July 2025
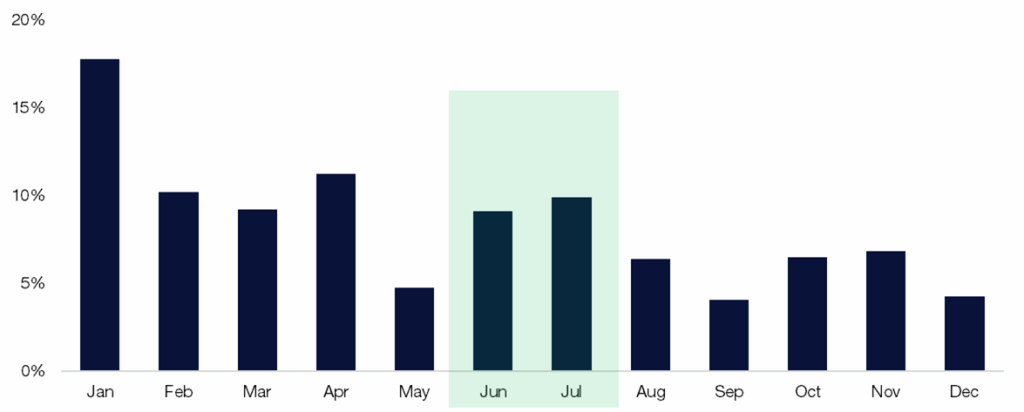
Source: Citadel Securities, as of 7/30/25. Figures are for illustrative purposes only. Past performance figures do not guarantee future results.4. Citadel Securities’ retail activity has had a higher footprint in June and July, since 2017. Retail activity tends to decelerate in August heading into September.
Retail Cash – Proportion of Net Notional By Month
July 1, 2017 – June 30, 2025
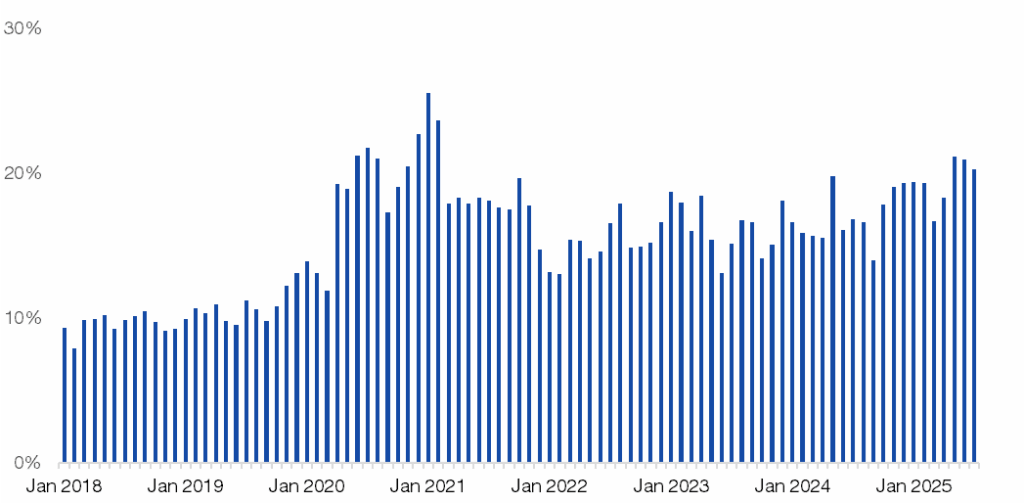
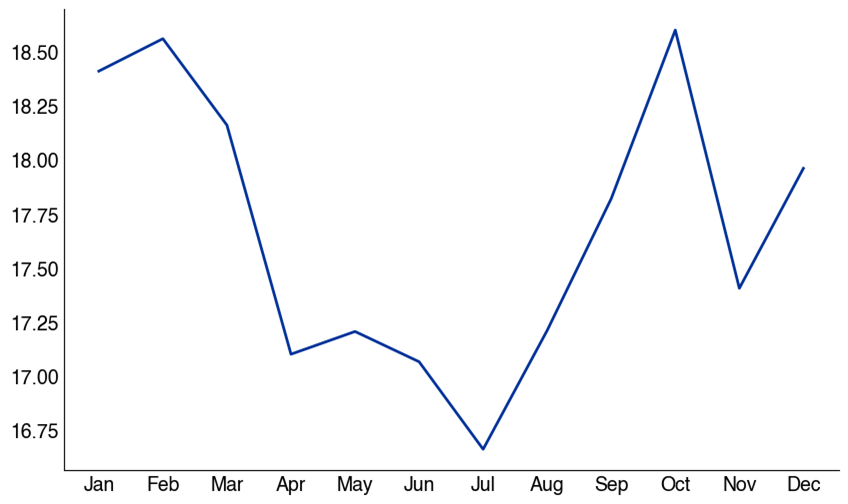
Source: Citadel Securities, as of 7/30/25. Figures are for illustrative purposes only. Past performance figures do not guarantee future results.5. Citadel Securities’ estimation of retail investors as a total percentage of overall shares executed is 20%, which has steadily increased overtime.
Retail Investors Cash as a Proportion of Total Volume Executed
January 2018 – July 2025
Source: Citadel Securities, as of 7/30/25. Figures are for illustrative purposes only. Past performance figures do not guarantee future results.II. Volatility Positioning
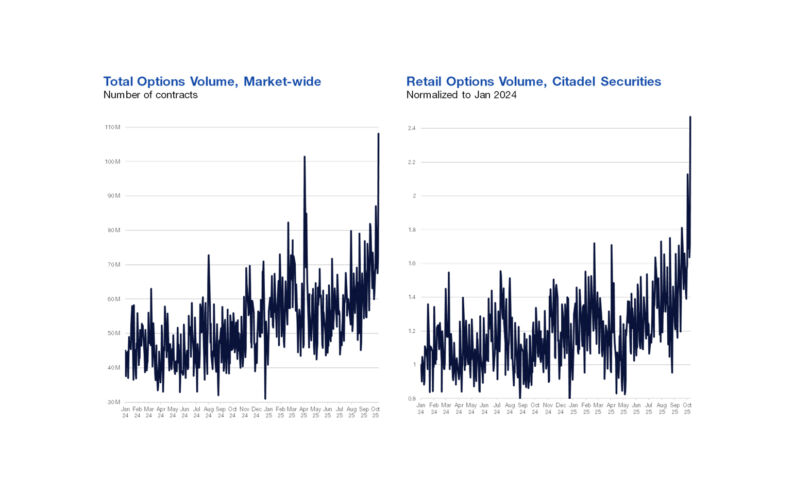
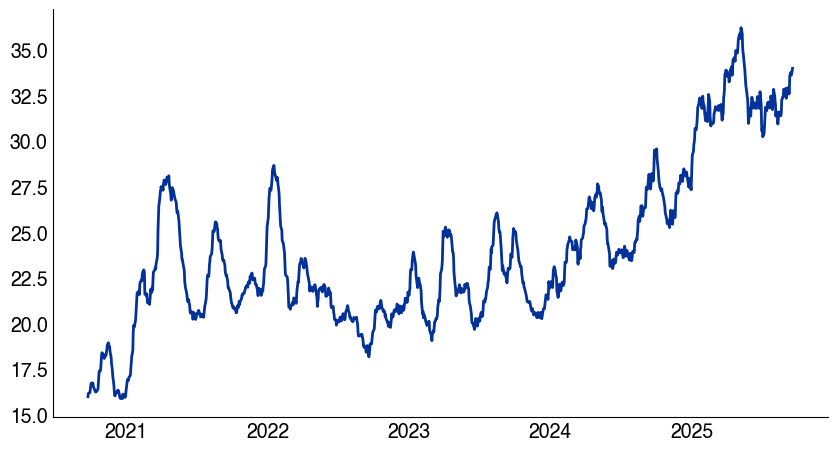
6. There has been an increase in call option activity in the marketplace over the past few years. Call option activity has doubled from 15m contracts per day in 2021 to 36m contracts today.
Call Options, Million contracts, US Listed Options.
Since 2021, 1-month rolling average
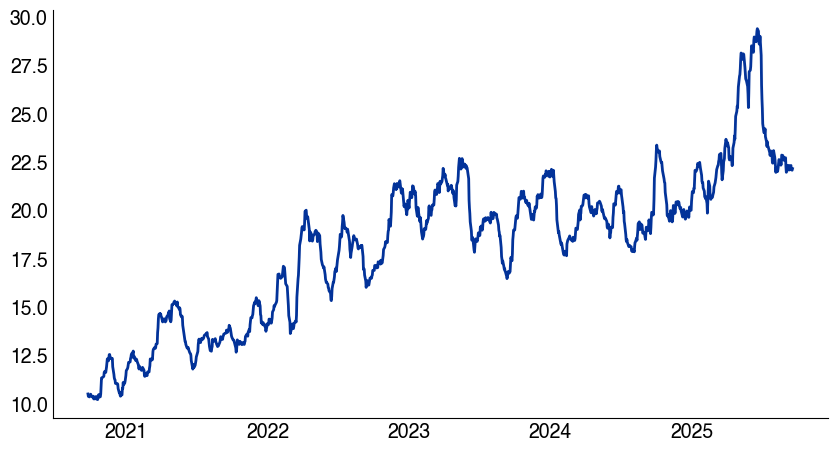
Source: Options Clearing Corporation, as reported by Bloomberg and compiled by Citadel Securities, as of 7/30/25. Figures are for illustrative purposes only. Past performance figures do not guarantee future results.7. There has been a substantial decrease in put option activity in the marketplace since April. It has been difficult to carry hedges with 30 day realized vol 7.
Put Options, Million contracts, US Listed Options.
Since 2021, 1-month rolling average
Source: Options Clearing Corporation, as reported by Bloomberg and compiled by Citadel Securities, as of 7/30/25. Figures are for illustrative purposes only. Past performance figures do not guarantee future results.
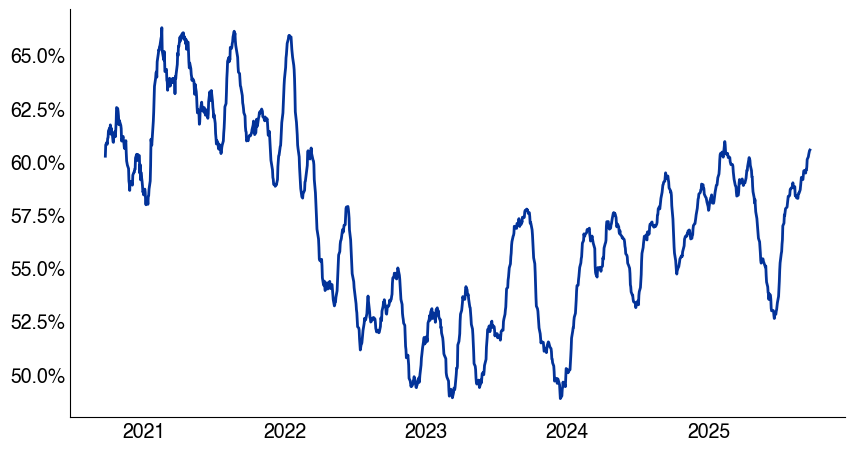
8. Call option activity as a share of total contracts has risen, though it remains below 2021 levels.
Call Options relative to total option contracts, % ratio
Since 2021, 1-month rolling average
Source: Options Clearing Corporation, as reported by Bloomberg and compiled by Citadel Securities, as of 7/30/25. Figures are for illustrative purposes only. Past performance figures do not guarantee future results.
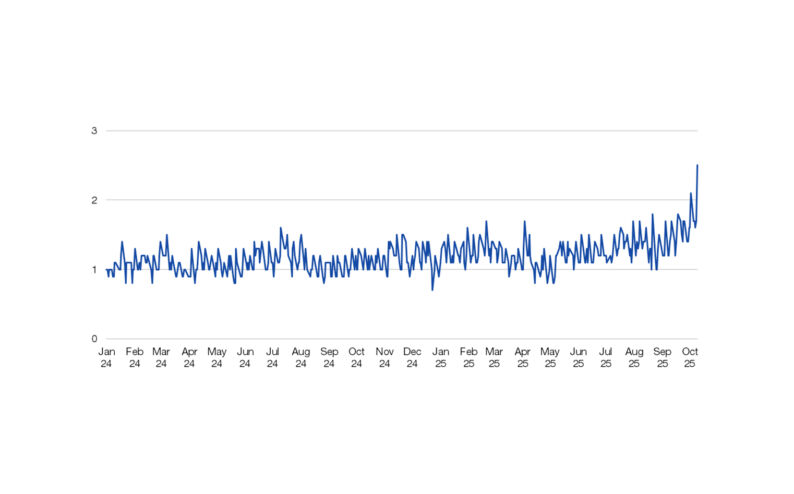
9. Citadel Securities’ retail activity has remained bullish in options for 13 consecutive weeks, span back to April.
Citadel Securities’ retail options activity has been bullish in 17 out of the past 18 trading days.
Retail Options – Put / Call Direction Ratio by Week
January – July 2025
Source: Citadel Securities, as of 7/30/25. Figures are for illustrative purposes only. Past performance figures do not guarantee future results.
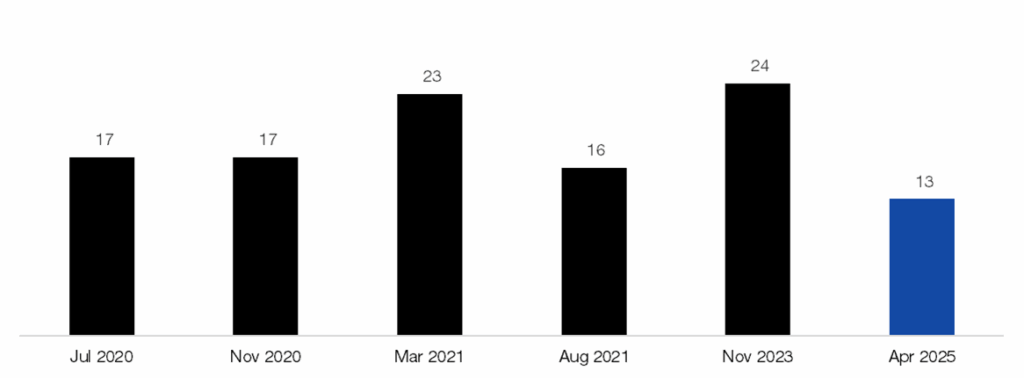
10. This marks the sixth-longest bullish streak in our dataset, which began in 2020. The average duration of the previous five streaks is 18 weeks, suggesting this trend could extend another five weeks (which would take us to the first week of September).
Longest Retail Weekly Option Buying Streak on record, since 2020.
# of weeks
Source: Citadel Securities, as of 7/30/25. Figures are for illustrative purposes only. Past performance figures do not guarantee future results.
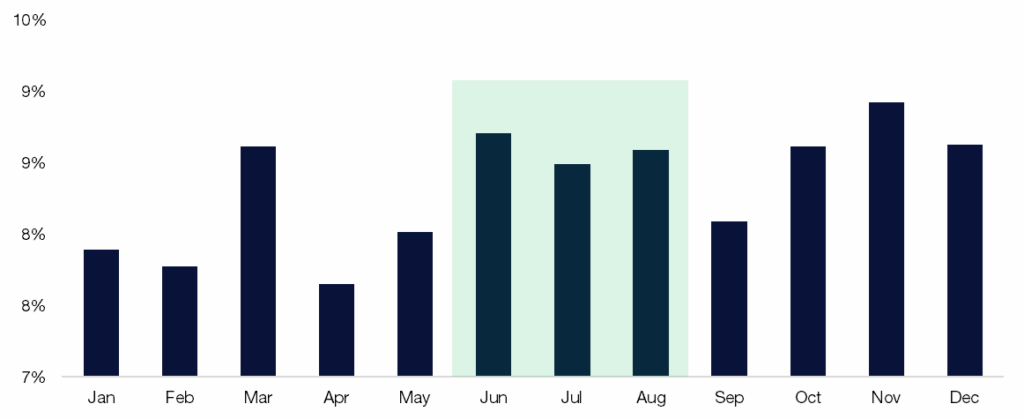
11. Citadel Securities’ retail option activity typically remains strong in August, before declining in September
Retail Options – Proportion of Contract Volume by Month
January 2020 – December 2024
Source: Citadel Securities, as of 7/30/25. Figures are for illustrative purposes only. Past performance figures do not guarantee future results.
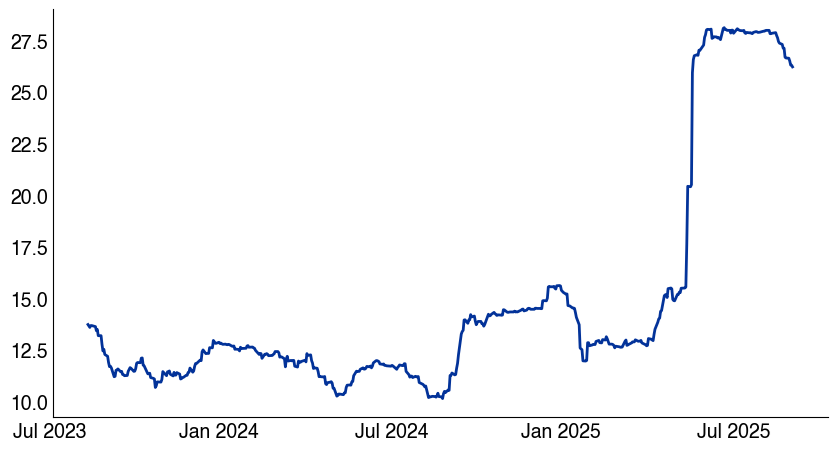
12. Realized Volatility
SPX 3-month realized volatility remains elevated relative to the past five years. Currently, 3-month realized vol stands at 26, compared to 7 for 1-month and just 5 for 1-week. Realized vol continues to decline as high-volatility periods from April and May drop from the 90-day observation window. In addition, close-to-close realized vol in SPX is now at the lowest levels since 2019.
SPX 3-month realized volatility
July 2023 – July 2025
Source: As reported by Bloomberg and compiled by Citadel Securities, as of 7/30/25. Figures are for illustrative purposes only. Past performance figures do not guarantee future results.III. Leverage
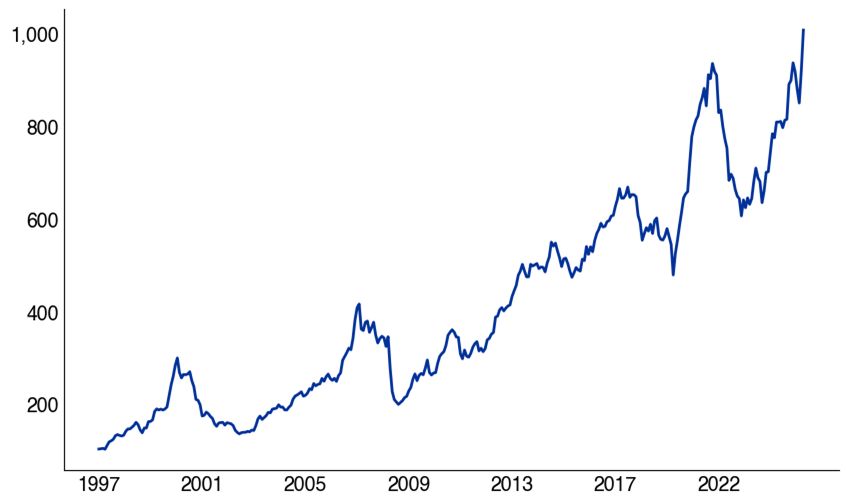
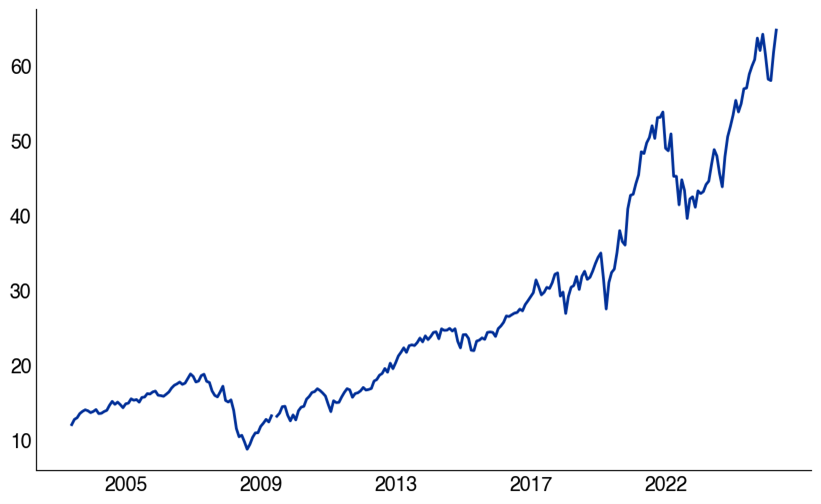
13. FINRA debit balances in customer margin accounts is at a lifetime high (~$1 Trillion). This is a cautious sign when viewed in isolation.
FINRA Margin Balance, billions
Since 1997
Source: As reported by FINRA and compiled by Citadel Securities, as of 7/30/25. Figures are for illustrative purposes only. Past performance figures do not guarantee future results.14. FINRA debit balances in customer margin accounts have increased recently, and many market participants have flagged the increase in slope of the line.
FINRA Margin Balance, billions
Since 2024
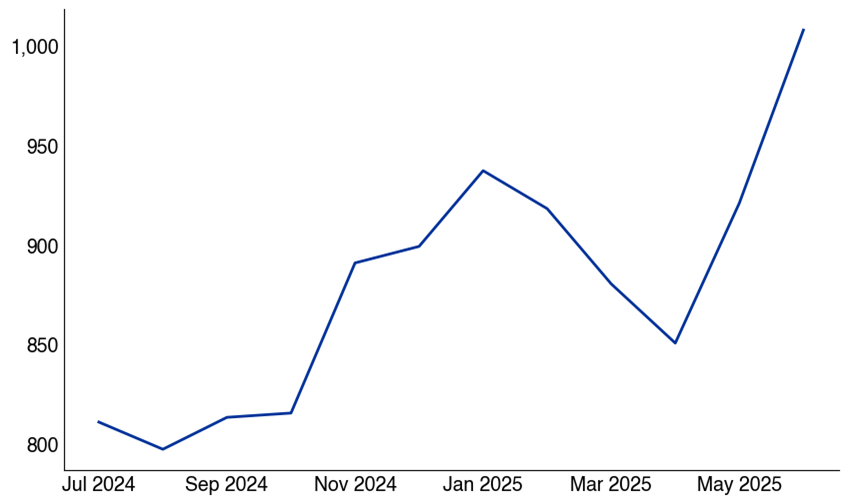
Source: As reported by FINRA and compiled by Citadel Securities, as of 7/30/25. Figures are for illustrative purposes only. Past performance figures do not guarantee future results.15. As a reminder, US Equity market capitalization also is at a lifetime high (~$66 Trillion).
US Equity Market Capitalization, Trillions
Since 2025
Source: As reported by Bloomberg and compiled by Citadel Securities, as of 7/30/25. Figures are for illustrative purposes only. Past performance figures do not guarantee future results.16. I’ve seen several bearish messages regarding financial leverage in nominal terms. However, after adjusting for market capitalization growth, current margin account balances (expressed as a percentage of market capitalization) do not appear significant and actually pretty low.
FINRA Margin Balance as a % of US Market Capitalization, % terms
Since 2025
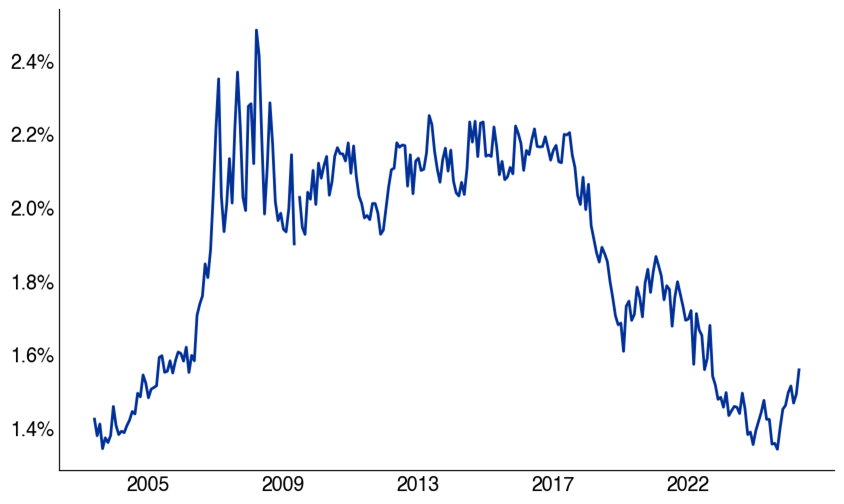
Source: As reported by FINRA and compiled by Citadel Securities, as of 7/30/25. Figures are for illustrative purposes only. Past performance figures do not guarantee future results.IV. Corporate Earnings Expectations and Positioning
17. 88% of the S&P 500 market capitalization will have reported Q2 earnings by August 29th. Nvidia is the last of the “Magnificent 7” stocks to report earnings on August 27th.
18. US corporates will return from the blackout window following quarterly earnings and I think they have some capacity to increase share repurchase activity, especially during August.
19. The “Superbowl” of earnings is this week and starts tonight, where 39% of the S&P 500 market capitalization report quarterly earnings. Microsoft and Meta report earnings tonight, while Apple and Amazon report earnings tomorrow.
Source: As reported by FINRA and compiled by Citadel Securities, as of 7/30/25. Figures are for illustrative purposes only. Past performance figures do not guarantee future results.
20. Information Technology (‘IT’) is the largest sector reporting earnings this week. IT companies reporting this week represent 14.9% of the S&P 500 market capitalization. S&P 500 index concentration is an important passive technical indicator, and a primary driver of target-date and 401k/retirement fund flows.
If you allocate $1 into the SPX Index, 33 cents are allocated into the “Magnificent 7” stocks.
If you allocate $1 into the NDX Index, 43 cents are allocated into the “Magnificent 7” stocks.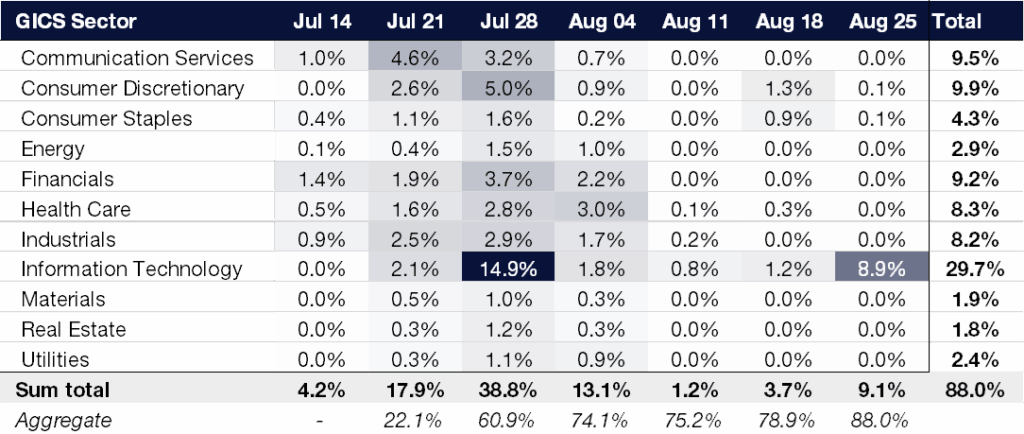
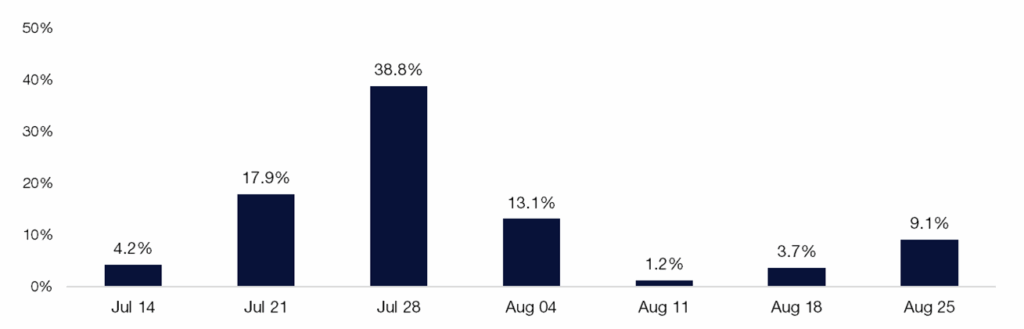
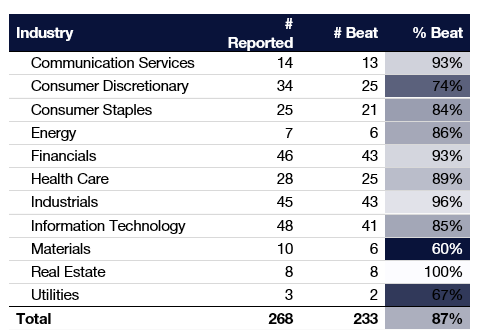
Source: As reported by Bloomberg and compiled by Citadel Securities, as of 7/30/25. Figures are for illustrative purposes only. Past performance figures do not guarantee future results.21. Weekly Q2 Earnings Tracker:
US corporate earnings expectations remain subdued, yet results have been strong. Of the 268 companies that have reported so far, 233 (or 87%) have exceeded earnings estimates. Confidence and clarity have become key themes of this earnings season.
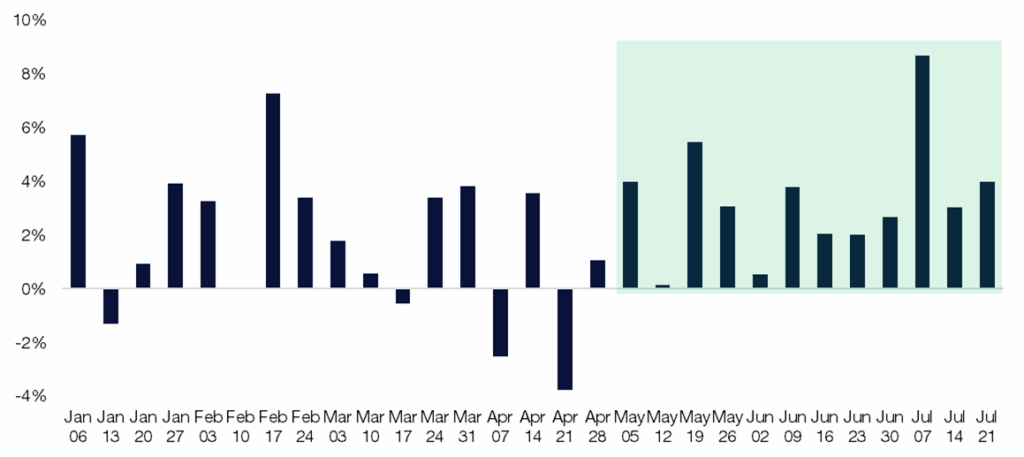
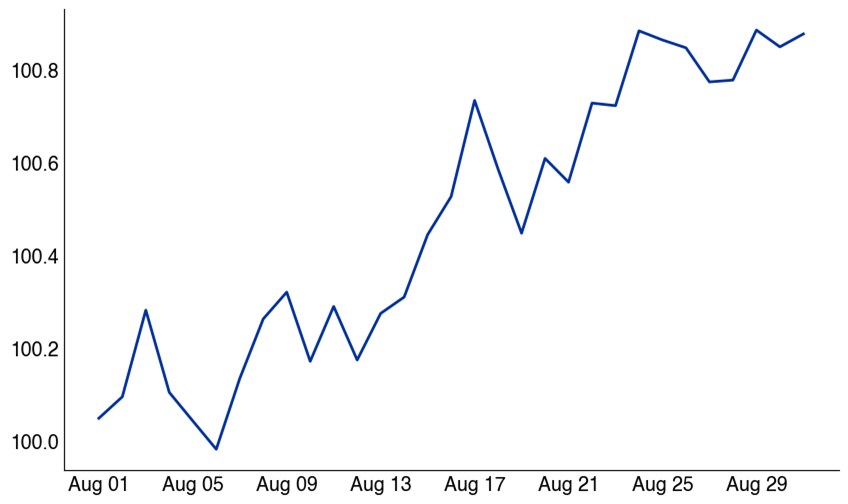
Source: As reported by Bloomberg and compiled by Citadel Securities, as of 7/30/25. Figures are for illustrative purposes only. Past performance figures do not guarantee future results.22. August seasonals are an important feature of this equity market rally.
Looking at the past 100 years, the S&P 500 tends to rally during the month of August, closing the month on the highs. This behavior is consistent with the number of vacations, pool parties, and the general unwillingness to put on a new short during August.
The last week of August heading into Labor Day is one of the most common vacation weeks during to year to catch the long weekend. Institutional activity may start to decline during this period, especially if this week’s Superbowl game turns out to be a further volatility selling event.
SPX August Daily Performance
Since 1928
Source: As reported by Bloomberg and compiled by Citadel Securities, as of 7/30/25. Figures are for illustrative purposes only. Past performance figures do not guarantee future results.NDX August Daily Performance
Since 1985
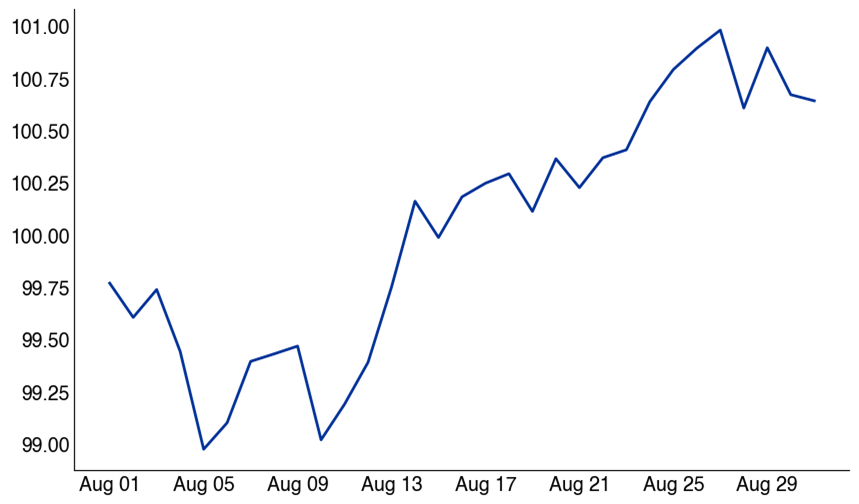
Source: As reported by Bloomberg and compiled by Citadel Securities, as of 7/30/25. Figures are for illustrative purposes only. Past performance figures do not guarantee future results.V. Institutional Positioning and Systematic Re-Leveraging
23. Citadel Securities’ institutional clients have been bearish 8 of the past 11 weeks. Our institutional flow aligns with broader market caution among professional investors.
However, a notable shift occurred last week, with a sharp increase in call option activity suggesting a potential change in sentiment as high flying names have created a force-in dynamic.
Institutional Options – Put / Call Direction Ratio by Week
January – July 2025
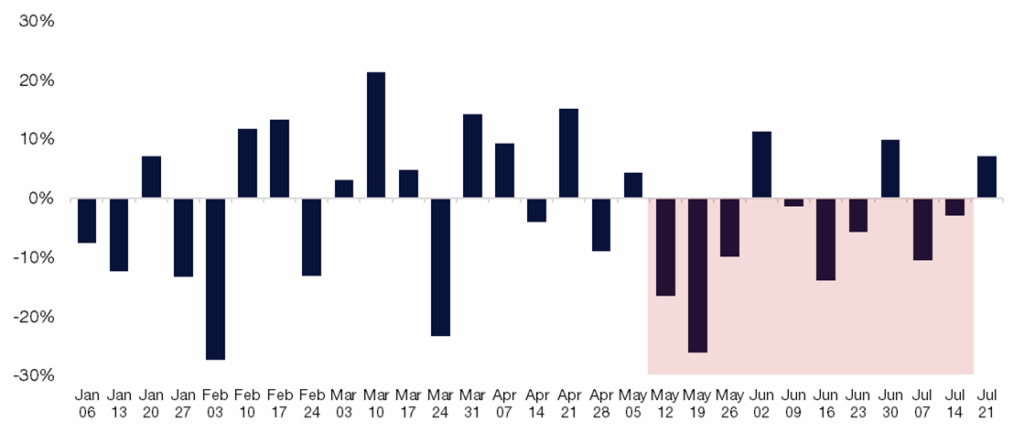
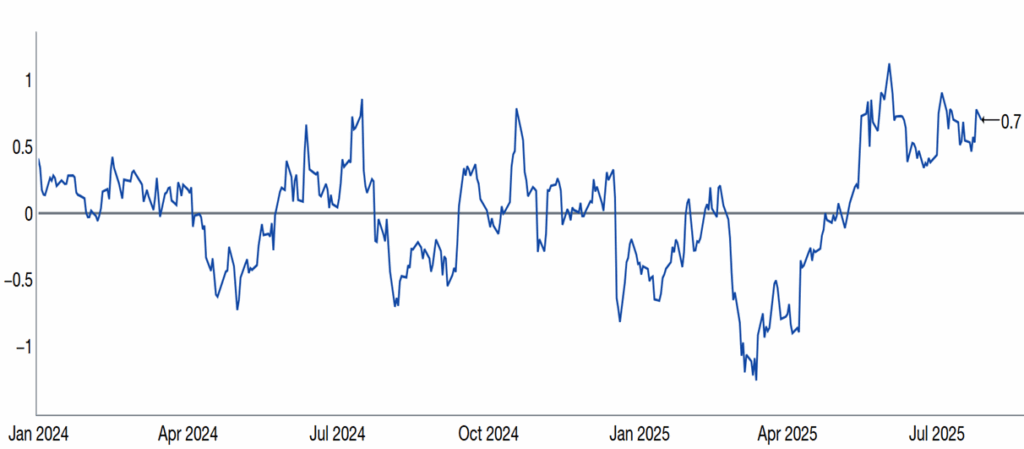
Source: Citadel Securities, as of 7/30/25. Figures are for illustrative purposes only. Past performance figures do not guarantee future results.24. According to Citadel Securities’ macro strategy team, Commodity Trading Advisors (CTAs) – which follow momentum and trend-based strategies – have plenty of room to increase equity exposure.
Positioning from this cohort is not stretched, indicating capacity to add exposure over the next month.
The number of consecutive sessions without a >1% SPX absolute move is now up to 24. We’ve also had 4 days with <10bps move in the last 2 weeks.
US Equity Aggregate CTA Positioning
January 2024 – July 2025
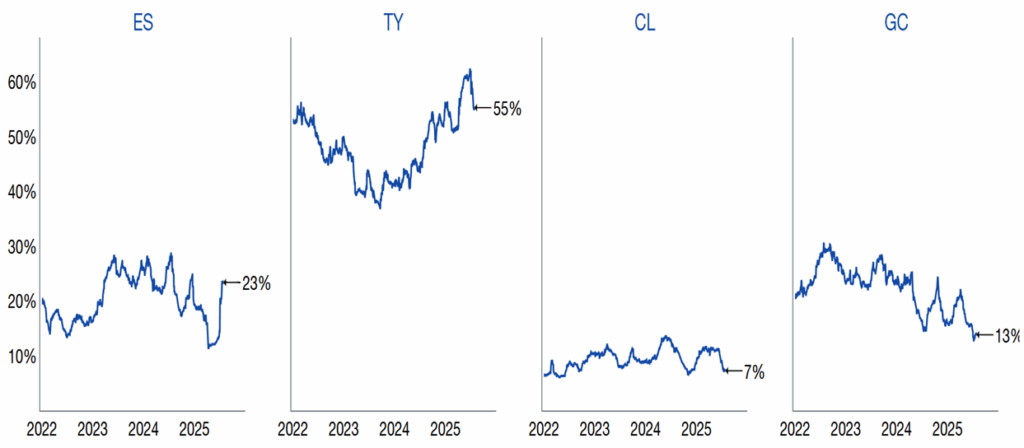
Source: Citadel Securities, as of 7/30/25. Figures are for illustrative purposes only. Past performance figures do not guarantee future results.US CTA Signals
January 2024 – July 2025
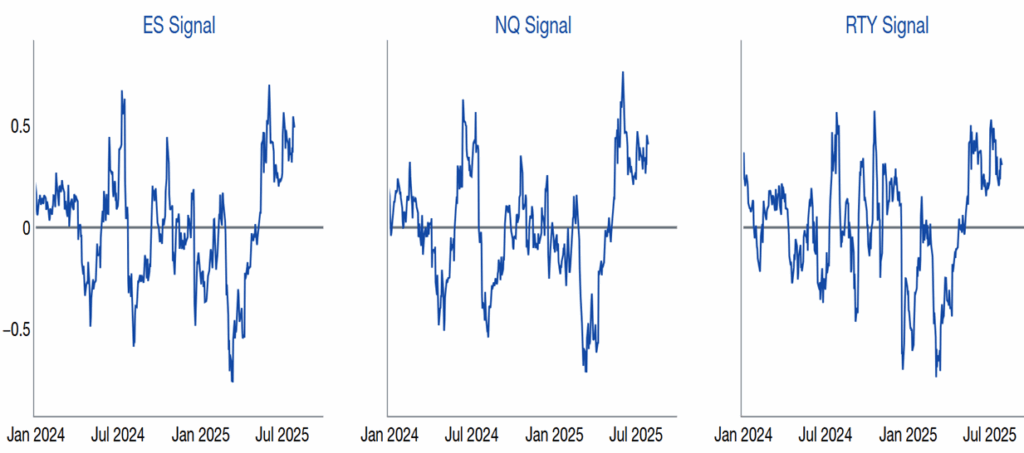
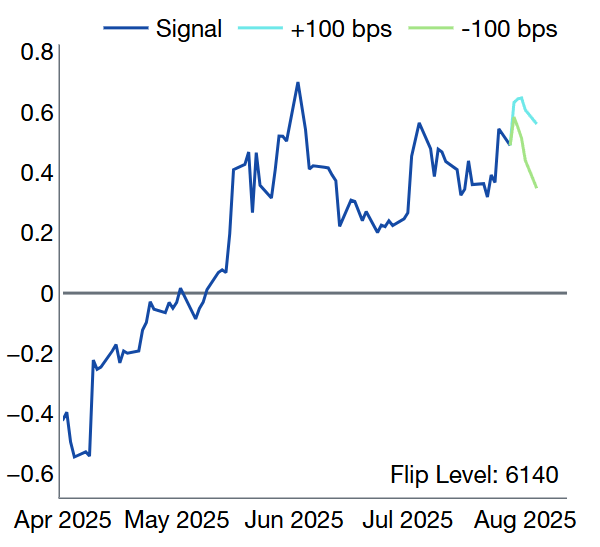
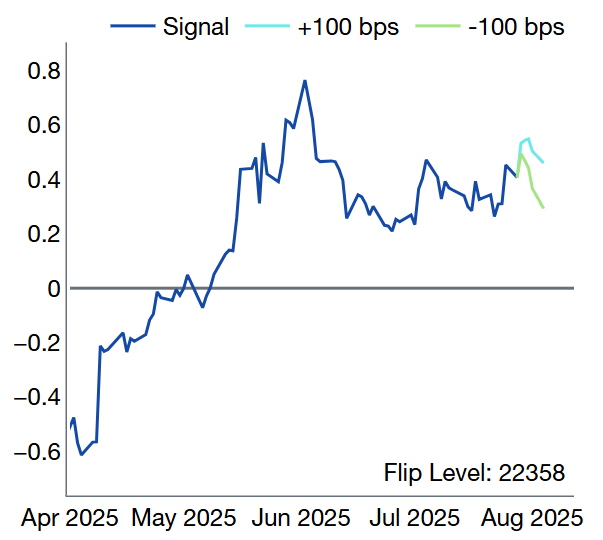
Source: Citadel Securities, as of 7/30/25. Figures are for illustrative purposes only. Past performance figures do not guarantee future results.25. CTA medium-term “flip” thresholds are materially below current spot and give equity futures a large buffer before hitting a trigger level. Citadel Securities’ global macro strategy team estimates the ES1 (SPX) flip level at 6140 vs. current levels of 6414.
SPX (ES1) CTA Signals
April 2025 – July 2025
Source: Citadel Securities, as of 7/30/25. Figures are for illustrative purposes only. Past performance figures do not guarantee future results.NDX (NQA) CTA Signals
April 2025 – July 2025
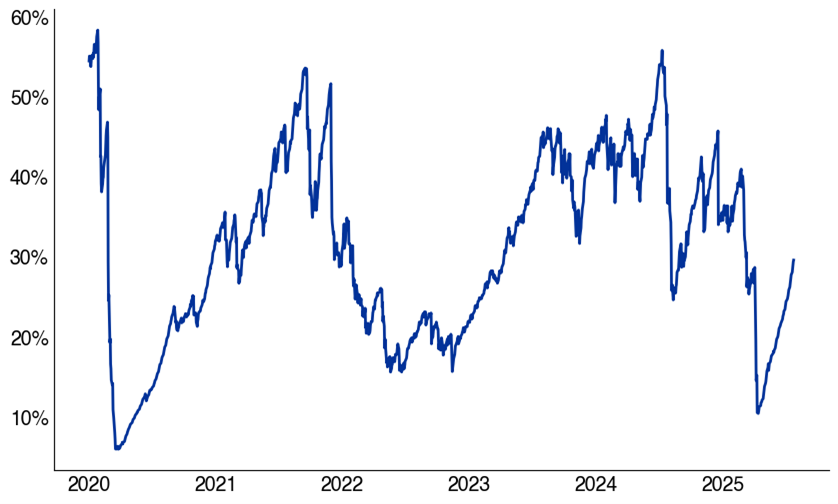
Source: Citadel Securities, as of 7/30/25. Figures are for illustrative purposes only. Past performance figures do not guarantee future results.26. Vol-Control strategies – which take cues from the realized volatility market – may continue to ramp equity exposure as volatility moves lower.
Vol target exposure with a 5% risk control: Current equity exposure 29%. April Low 10%. December 2024 High 46%.
Vol Target Exposure with 5% Risk Control
Exposure Rank since 2020
Source: As reported by Bloomberg and compiled by Citadel Securities, as of 7/30/25. Figures are for illustrative purposes only. Past performance figures do not guarantee future results.27. Vol target exposure with a 10% risk control: Current equity exposure 59%. April Low 20%. December 2024 High 91%.
Vol Target Exposure with 10% Risk Control
Exposure Rank since 2020
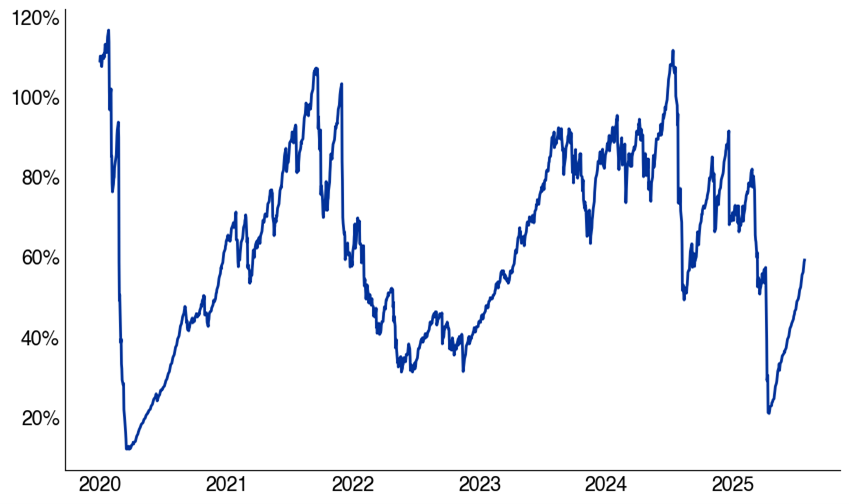
Source: As reported by Bloomberg and compiled by Citadel Securities, as of 7/30/25. Figures are for illustrative purposes only. Past performance figures do not guarantee future results.
28. Risk Parity strategies – which respond to cross-asset volatility measures – also have capacity to increase equity exposure. This is especially relevant given that the MOVE index (which measures rate volatility) is near its lowest level since 2022.
Risk Parity Exposure
Jan 2022 – July 2025
Source: Citadel Securities, as of 7/30/25. Figures are for illustrative purposes only. Past performance figures do not guarantee future results.
GMI – September Tactical Checklist
a. Systematic positioning will be full in September and may be vulnerable to any downside shocks.
b. September is the worst seasonal period of the year for the S&P 500 since 1928.
c. Volatility trends to move higher during September going back to 1990.
d. Citadel Securities’ retail equity and option franchise tend to see lower retail footprint during September.
e. I am looking for a potential reversion lower in anti-momentum, high beta, lower quality, and themes.
VIX August Monthly Performance
Since 1990
Source: Citadel Securities, as of 7/30/25. Figures are for illustrative purposes only. Past performance figures do not guarantee future results.Copyright © Citadel Enterprise Americas LLC or one of its affiliates. All rights reserved.
Legal Entities Disseminating this Material: This material is disseminated in the United Kingdom by Citadel Securities (Europe) Limited (“CDGE”) authorized and regulated by the Financial Conduct Authority (“FCA”) (Registered company number: 05462867); in the European Union by Citadel Securities GCS (Ireland) Limited (“CSGI”) and its Paris Branch authorized and regulated by the Central Bank of Ireland (“CBI”) (Registration Number: C173437); in Hong Kong by Citadel Securities (Hong Kong) Limited (“CDHK”) licensed by the Securities and Futures Commission of Hong Kong (“SFC”), in Japan by Citadel Securities Japan Co., Ltd (“CSJC”) registered as a Type 1 financial instruments business operator with the Japan Financial Services Agency (“JFSA”); and in the United States of America by Citadel Securities LLC (“CDRG”) registered with the Securities Exchange Commission (“SEC”), Financial Industry Regulatory Authority (“FINRA”), and Securities Investor Protection Corporation (“SIPC”), Citadel Securities Institutional LLC (“CSIN”) registered with the SEC, FINRA, and SIPC, or Citadel Securities Swap Dealer LLC (“CSSD”) registered with the SEC, Commodities Futures Trading Commission (“CFTC”), and National Futures Association (“NFA”). Unless governing law permits otherwise, you must contact a Citadel Securities entity in your home jurisdiction if you want to use our services in effecting a transaction in any financial instruments or securities, including derivatives.
FOR INSTITUTIONAL USE ONLY; FOR PROFESSIONAL CLIENTS AND ELIGIBLE COUNTERPARTIES ONLY. This material is not intended as and does not constitute investment research. Contents of this material will be strictly limited to non-specific, generic information (i.e. macro events/topics) and are not subject to the Markets in Financial Instruments directive (MiFID II) or FINRA research rules. This material does not constitute an offer, solicitation, invitation, or inducement to purchase, acquire, subscribe to, provide, or sell any financial instrument or otherwise engage in investment activity. Please see additional important disclosures, including disclosures that may be relevant to your country of residence or business at www.citadelsecurities.com/GlobalSalesTrading.
Explore
Market Insights - What We Do