-
Who We Are
- What We Do
Series: Global Market IntelligenceMarch Macro Checklist
By Scott Rubner
I am on the road working live from Hong Kong, and was pinged more on email, zoom, and IB than any other time while at Citadel Securities.
After feedback on the ground from a global marketing tour, I am taking off our tactical bearish equity call from February, as sentiment has materially weakened and the bear camp has become too popular.
I put together the 10 most important dynamics that I am tracking in the market today; it will serve as our capitulation checklist.
There are several key dynamics that need to heal before bouncing higher, all of which improve by the middle of the month and become clear in April.

GMI: March Tactical Bounce Checklist
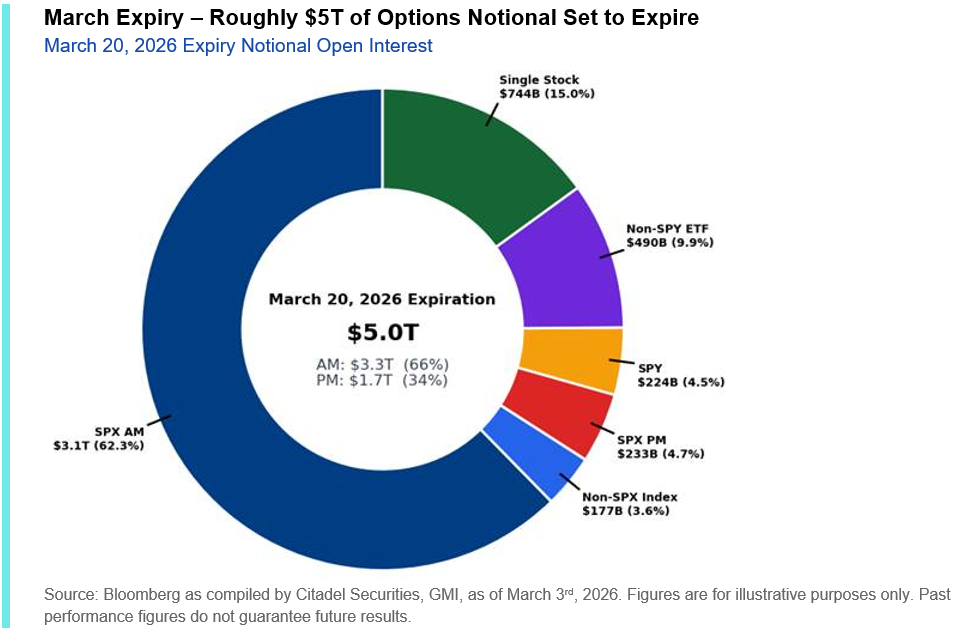
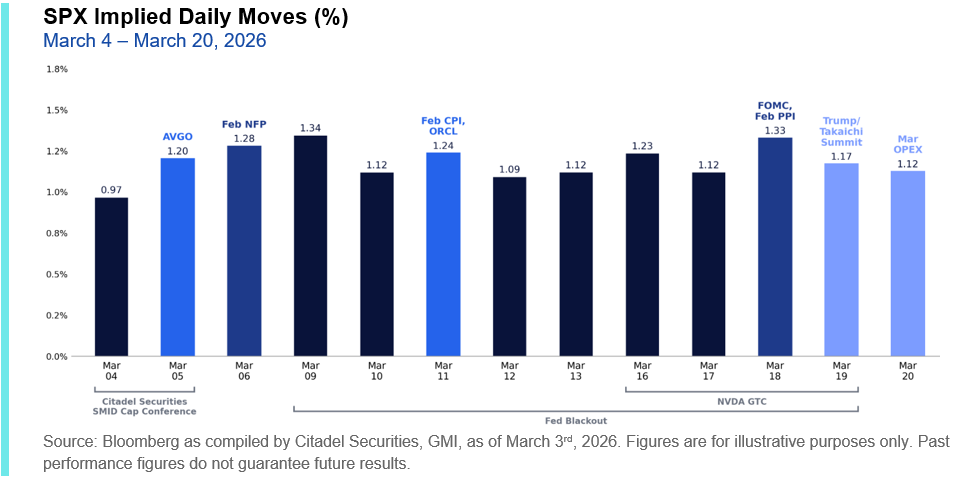
I. March Index Expiration is the largest on record.
OpEx will represent the largest technical event of the month, with ~35% of US options exposure set to roll off by March 20th – a clearing event for gamma that could meaningfully loosen the mechanical constraints currently anchoring the index.

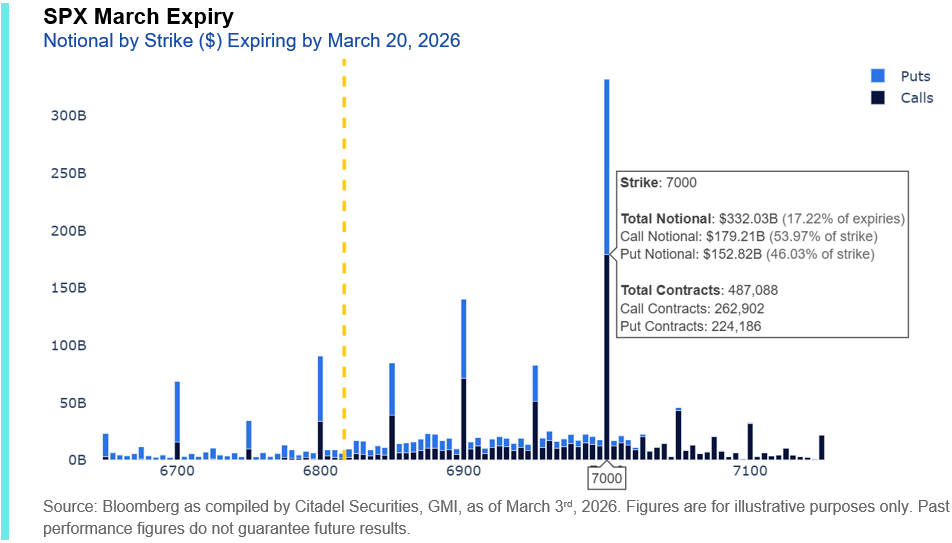
Within a 4.3% SPX peak-to-trough range – the narrowest start to a year in 20 years – persistent overwriting has layered significant upside gamma into the index (SPX $7k). That inventory forces dealers to fade strength, mechanically leaning against rallies and limiting follow-through. The asymmetry emerges on weakness – with less structural gamma support below, hedging flows can accelerate declines, creating a downside bias beneath an otherwise pinned index.
Through February, cumulative daily SPX movement totaled 21.7%, yet the S&P 500 only gained +0.5%. In other words, the market moved repeatedly, but made little directional progress. Cumulative absolute daily movement was 44 times larger than the index’s absolute return through February, a 95th percentile reading going back ~40 years.
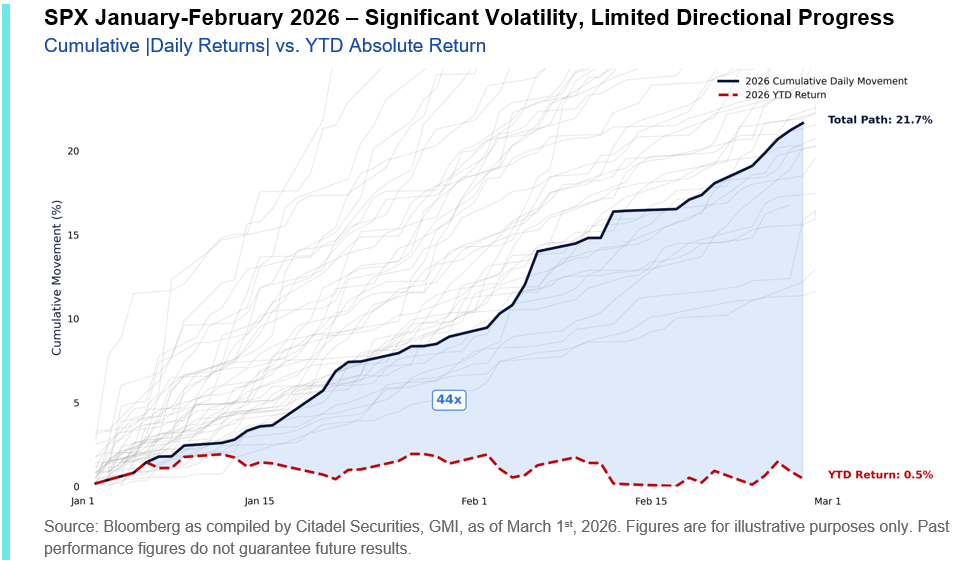
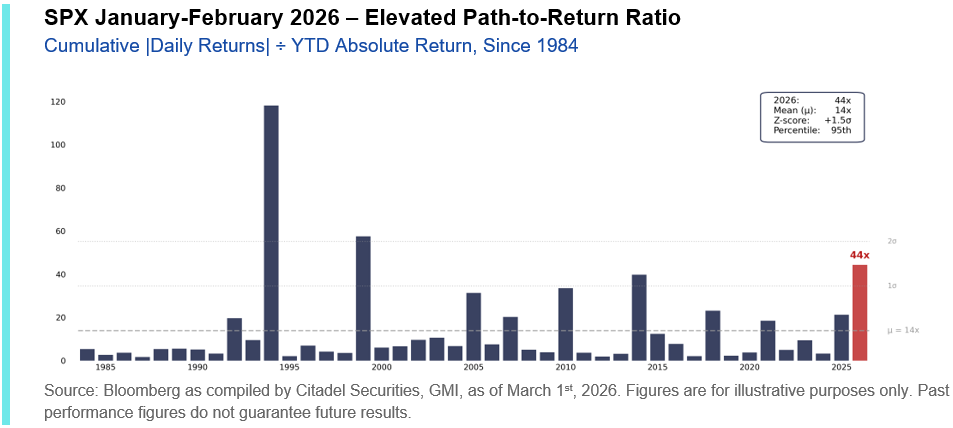
Moves lower have been absorbed. Moves higher are constrained. We would expect continued chop into expiry, followed by greater directional flexibility once positioning resets.
II. Retail continues to add support to the market.
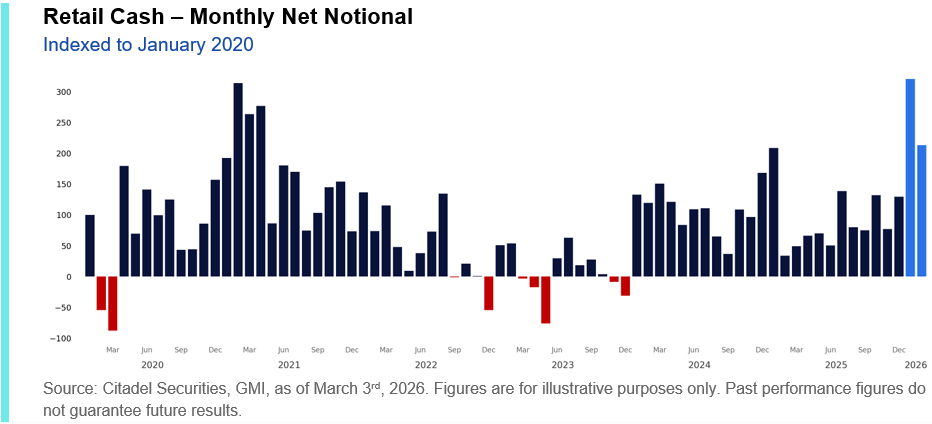
Retail remains the strongest hand in the entire market. The magnitude and persistence of the buying activity (across both stock and options) has been extremely notable.
As we highlighted a month ago, January 2026 marked the largest net buying month on record on our platform. February flows, while below that January surge, still ranked as the fifth-largest net buying month in our platform’s history and the strongest in ~five years, since April 2021.
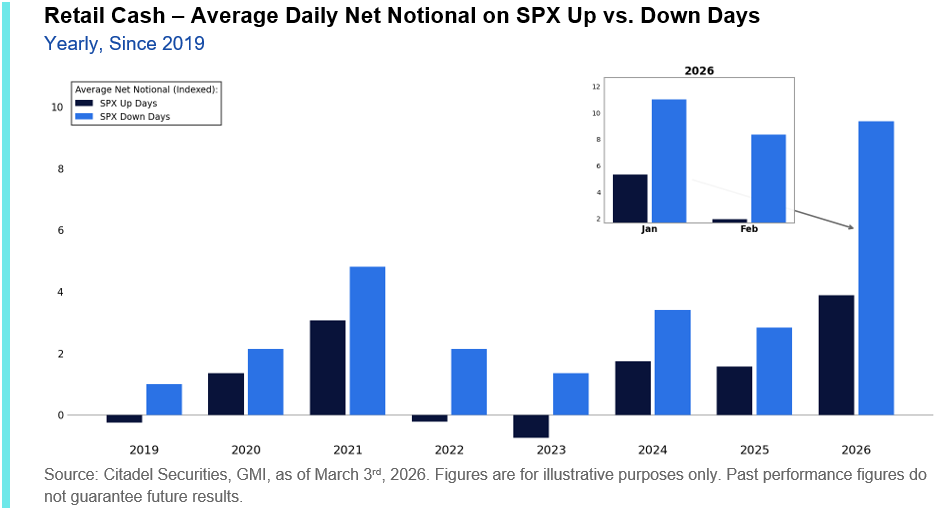
Retail’s appetite to buy the dip has remained a dominant force in early-2026 flows. Year-to-date, average net notional traded on our platform has been 2.5x larger on S&P down days than on up days. While overall average daily net notional moderated in February, the intensity of dip-buying actually increased: net notional on February S&P down days was 4.3x that of up days (vs. 2.1x in January).
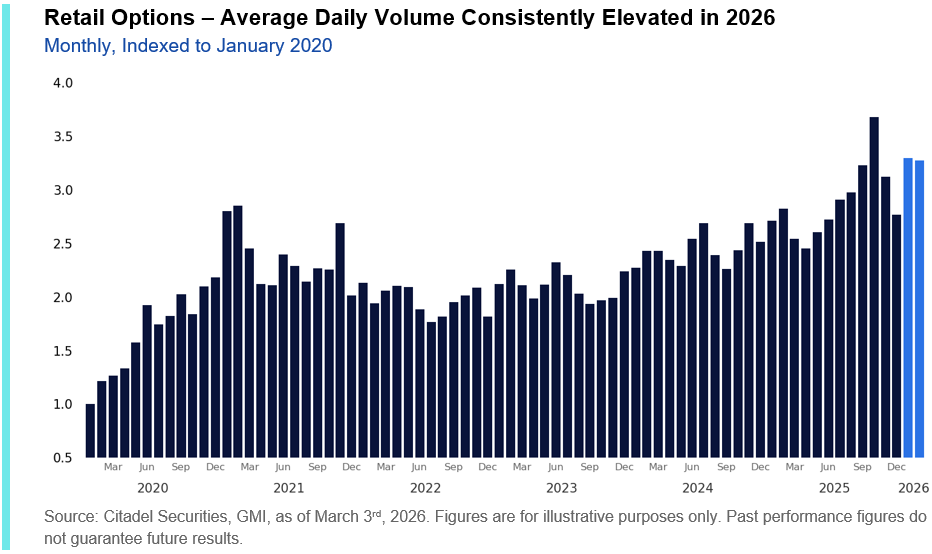
Options participation remains structurally elevated. Average daily retail options volume in 2026 is running approximately +14% above 2025 levels and nearly +47% above the 2020-2025 average, reflecting sustained participation rather than episodic bursts.
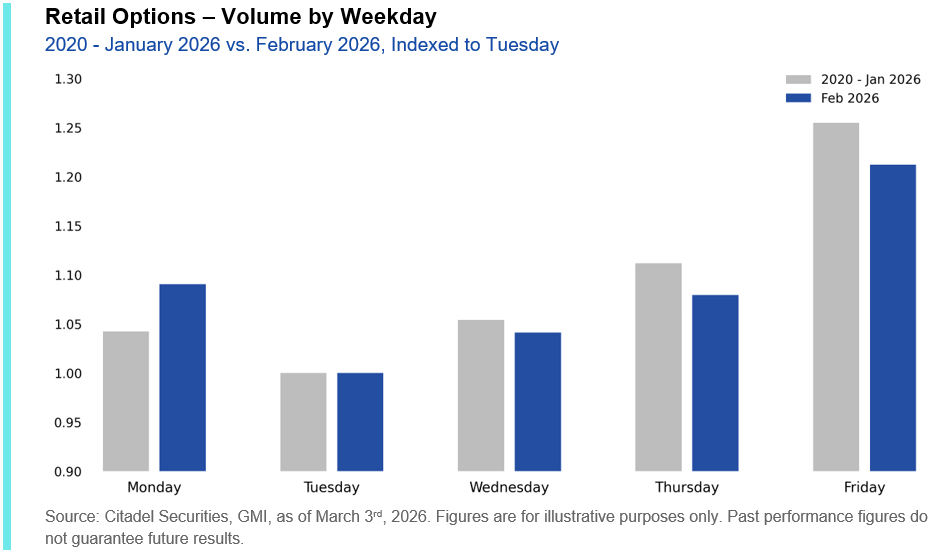
The composition of that activity continues to evolve. February data show volume migrating toward the start of the week, with Monday participation increasing and Friday activity moderating. The change coincides with the introduction of single stock 0DTE expiries.
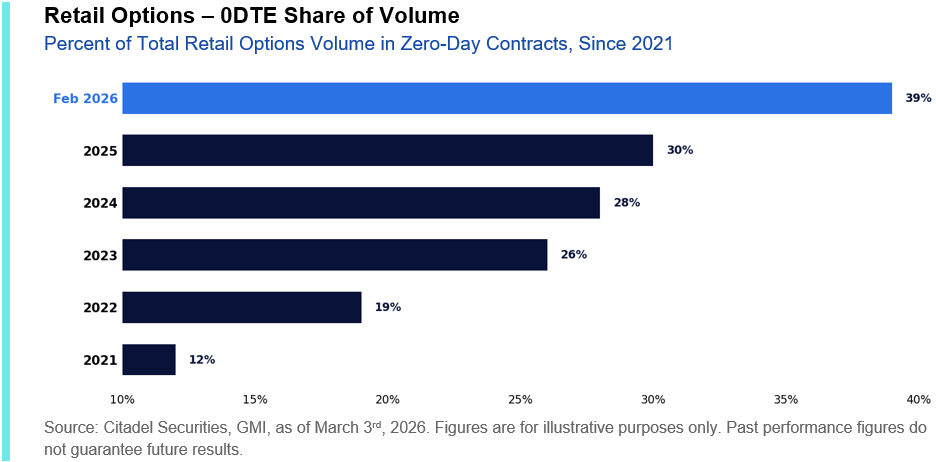
As highlighted in this month’s Retail Detail: Dispersion Drives Engagement, following the new listings, nearly 40% of total retail options volume traded at Citadel Securities is now in zero-day contracts. This represents one of the most significant structural changes in retail behavior observed on our platform, with participation increasingly focused on short-dated, intraday convexity.
Retail remains supportive of downside stability – but not yet positioned to force a decisive breakout.
III. Tax Refunds
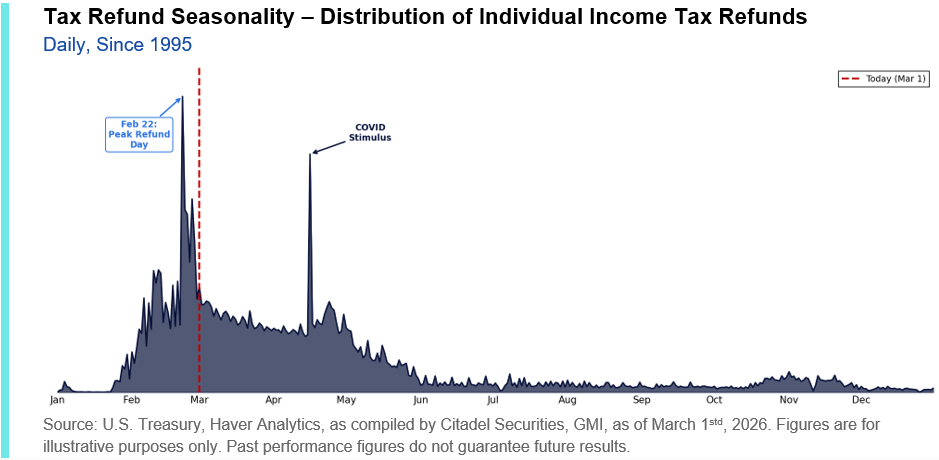
Tax refund season now becomes relevant, which has a high correlation of being deployed into risk assets. Historically, refund issuance accelerates in late February and into March, with February 22nd typically marking the most active singular day of refunds. As of March 1st, only 30% of annual refunds have been issued, with the bulk of distributions occurring over the next two months, reaching 75% by May 1st.
This year the tax refunds are set to be larger and is a key dynamic that we will be tracking in April.
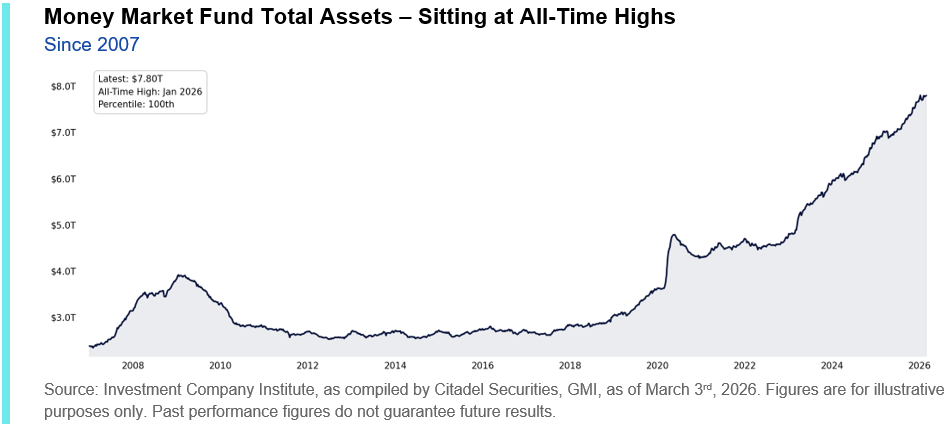
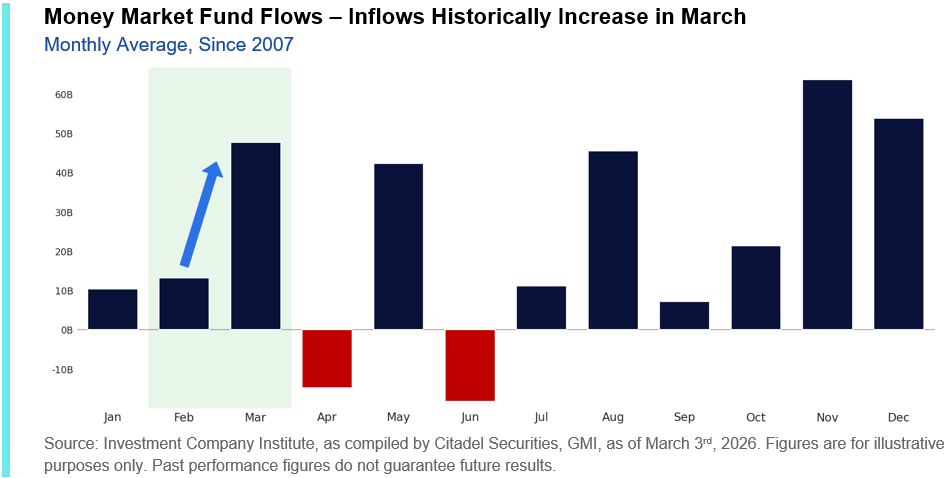
Seasonal liquidity patterns in money market funds align with this timeline. Historically, net inflows into money market funds increase between February and March, suggesting that a portion of refund-related liquidity initially accumulates in cash-like vehicles before being redeployed.
This does not imply immediate equity inflows. However, elevated money market balances combined with refund seasonality indicate that incremental retail liquidity remains available into March.
IV. Demand for Institutional, rules-based downside protection has increased
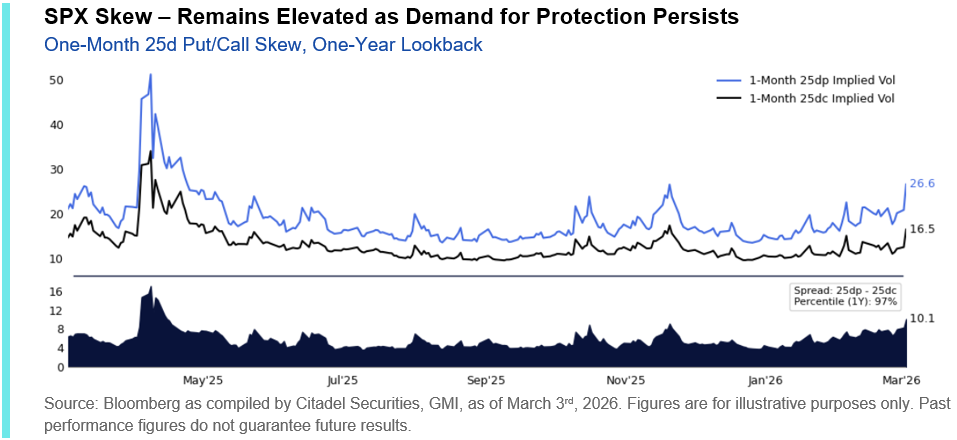
SPX one-month skew ranks in the 96th percentile vs. the last year. Short dated implied vol is elevated and SPX skew has continued to steepen as risk premium was added to the surface.
If there are any signs of global de-escalations, it is our view that clients will quickly monetize protection and create delta to buy, a feature that has been increasingly prevalent in each of the last two trading sessions.
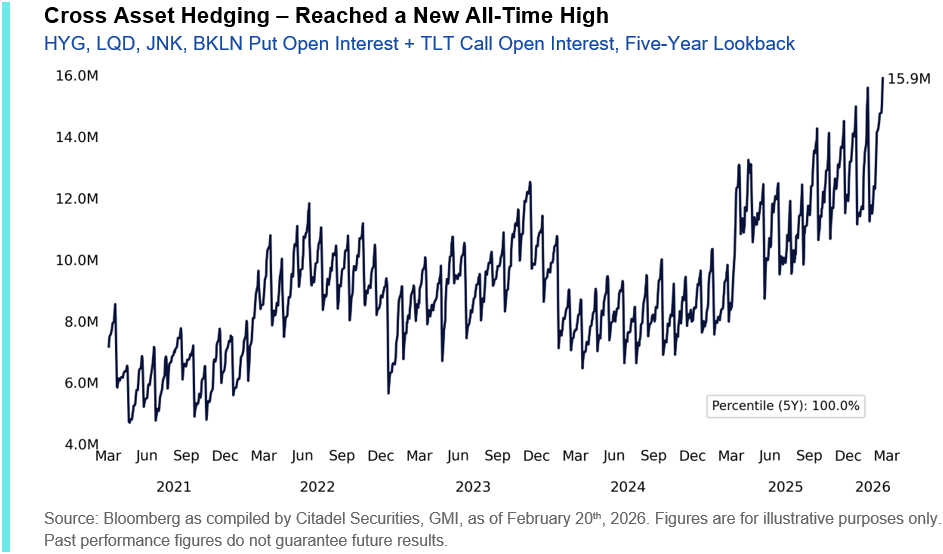
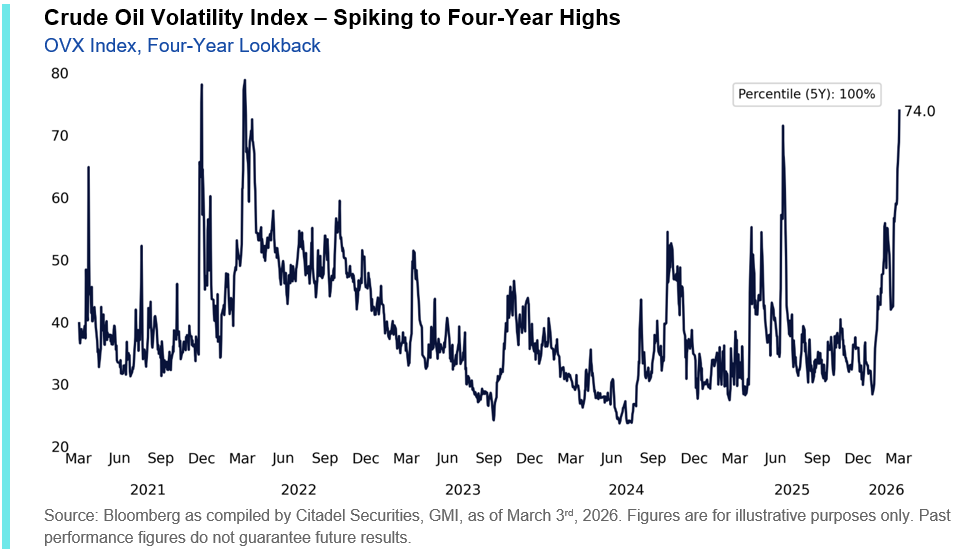
V. Cross asset credit hedging demand is elevated, and volumes continue to accelerate. Oil volatility is extreme.
Cross Asset investors have increased hedges in core credit products given volatility in the software factor. These continue to be some of the most actively traded hedges on our desk. On February expiry, hedge open interest across credit ETFs reached an all-time high.
Alongside this demand, bond market volatility has risen well off the January lows.
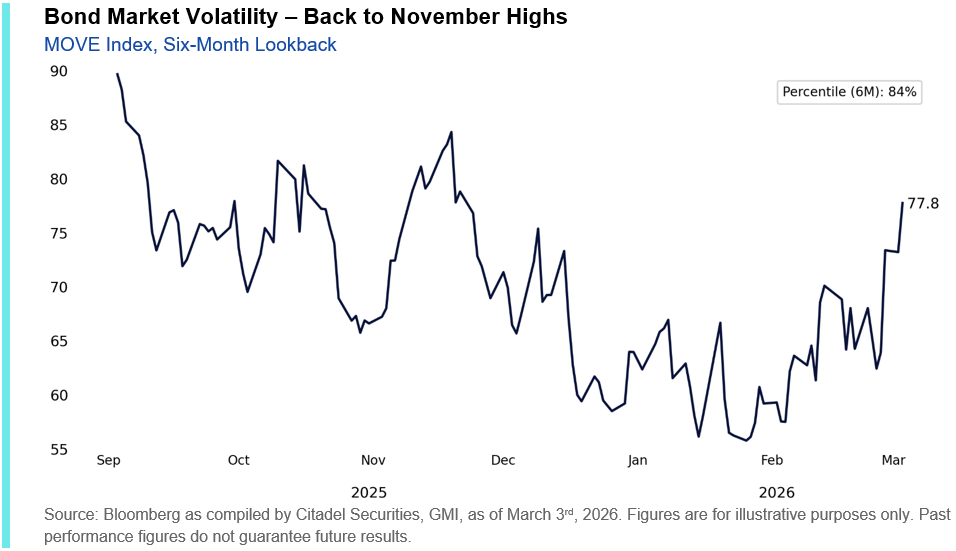
Amidst increasing geopolitical tensions, crude oil volatility has also severely increased, with OVX (crude oil VIX) spiking back to highs not seen since the beginning of the Russia/Ukraine war (2022).
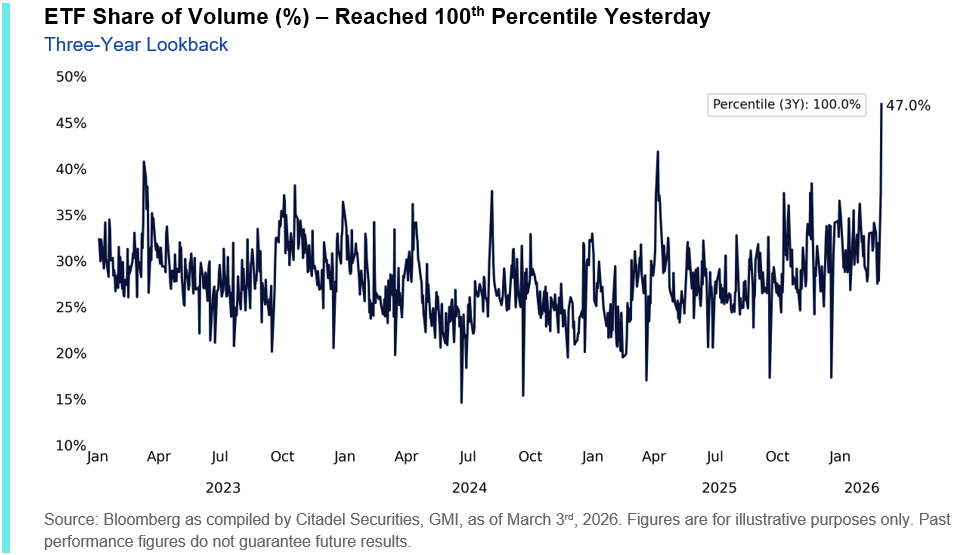
VI. Macro product trading: volumes ≠ liquidity.
Intraday trading of ETFs, macro liquidity, and 0DTE options continue to set new records and exhibit short gamma behavior. ETF volumes hit 47% of the overall tape yesterday, which marks a new 5-year high. This means that investors are using ETFs to hedge, while keeping core exposures.
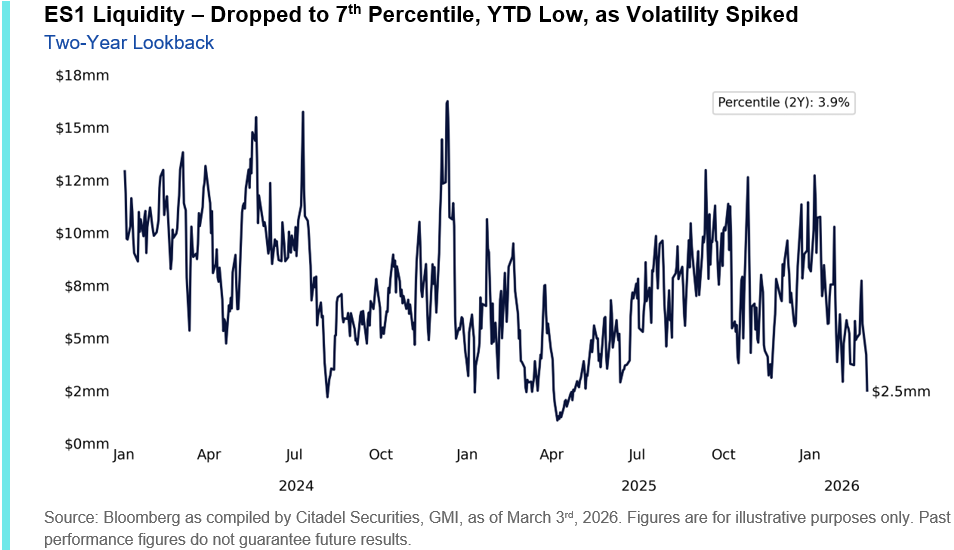
Similarly, the ability to transfer risk quickly has been limited given ES1 top book liquidity ranks in only the 4th percentile over the last two years.
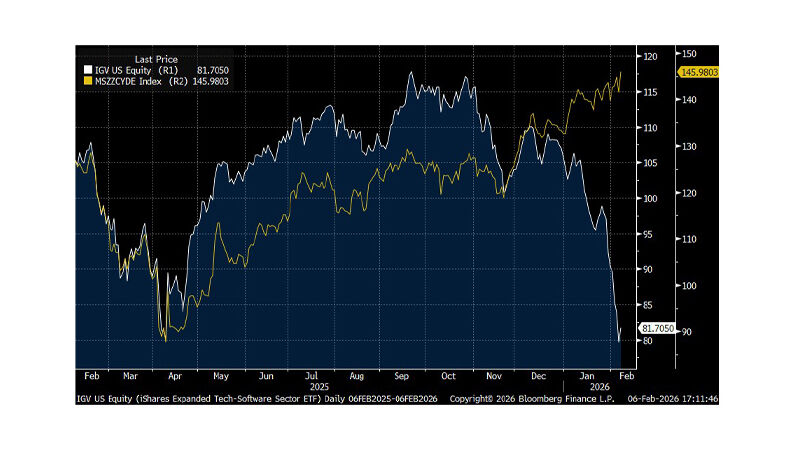
VII. Tech positioning remains low, hedged, shorted, and unloved as result of the rotation.
If there are any upside catalysts in tech, this will turn into a FOMO led rally back into the sector very quickly given that factor volatility has started to subside. It is our view that high quality stocks will outperform low quality stocks. The resumption of buying behavior will go back into the old boss: quality tech.
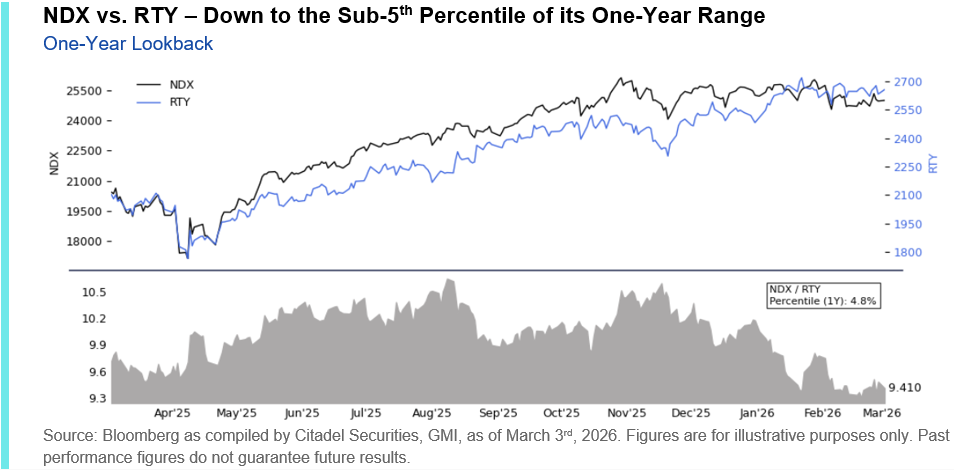
With Information Technology comprising 32.7% of the S&P 500, its performance remains pivotal. Even with robust breadth – 67% of constituents outperforming the index over the past 30 days, a 98th percentile reading over the last 30 years – the index has been unable to advance meaningfully while Tech lags.
Under the hood, the lightest SPX sectors have led, while the heaviest few sectors have lagged, resulting in the index having moved only -42bps YTD.
In fact, beneath the surface, the distribution of constituent returns is increasingly right skewed this year, with the number of single stocks posting outsized gains this early in the year very elevated relative to history. Yet these moves are occurring in names with smaller index weights, limiting their contribution to headline performance.
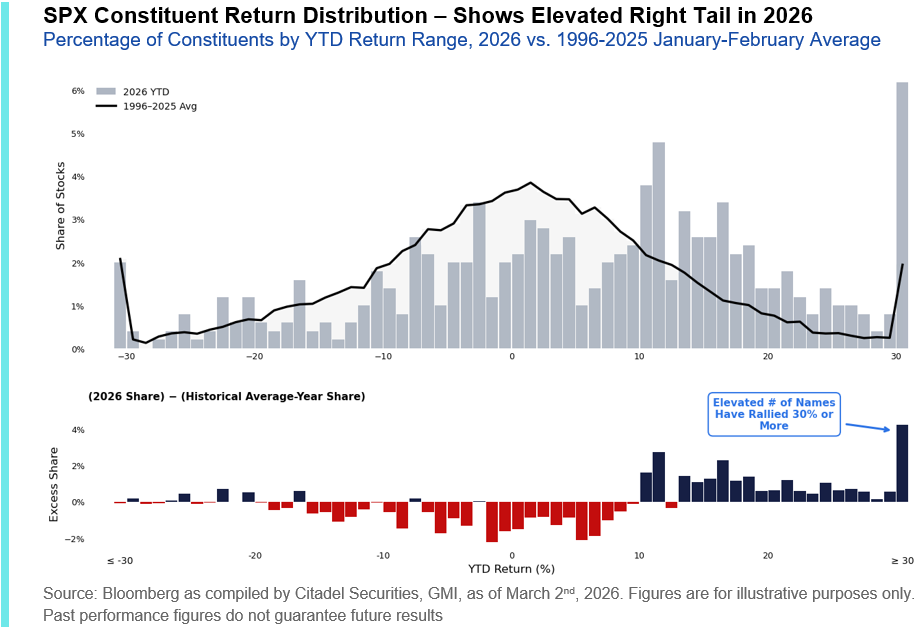
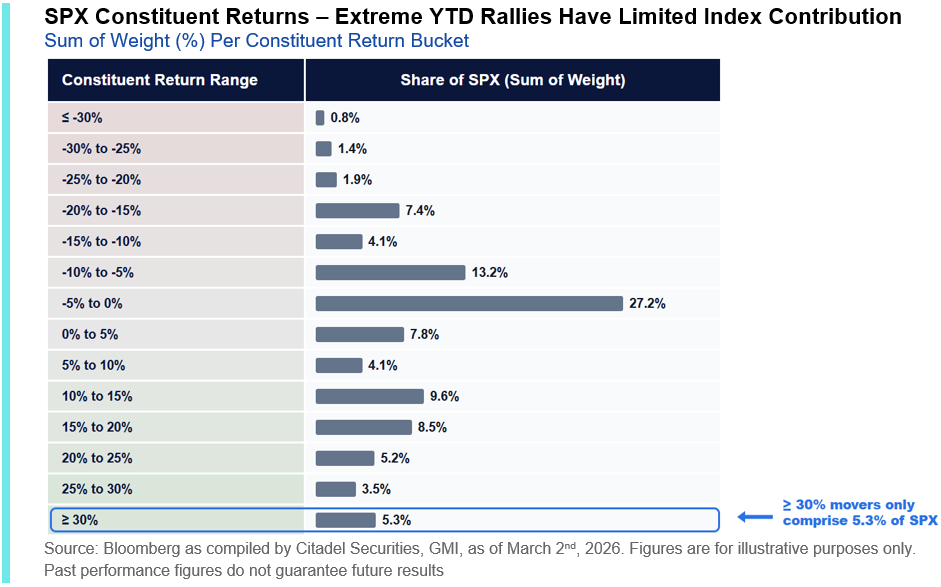
The index cannot meaningfully rally without tech participation.
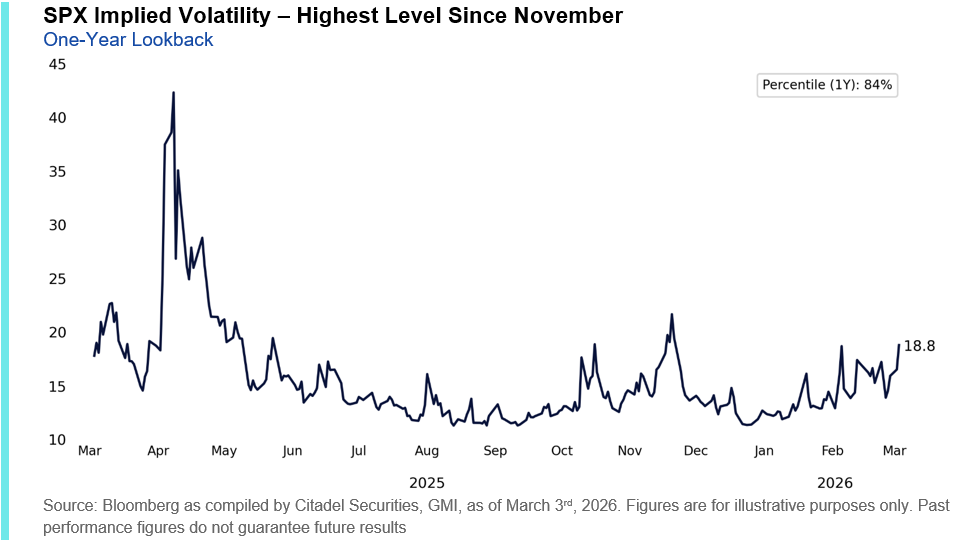
VIII. Volatility normalization: compression may trigger flows in the opposite direction.
The volatility index is no longer to coach from the sidelines; it is the quarterback and there is a mechanical deleveraging given elevated levels of volatility.
The VIX reached as high as 28.15 yesterday, its highest level since November, with spot inverting meaningfully versus front-month futures – the most pronounced backwardation since then. SPX one-month implied vols also rallied to their highest levels since November (~18v).
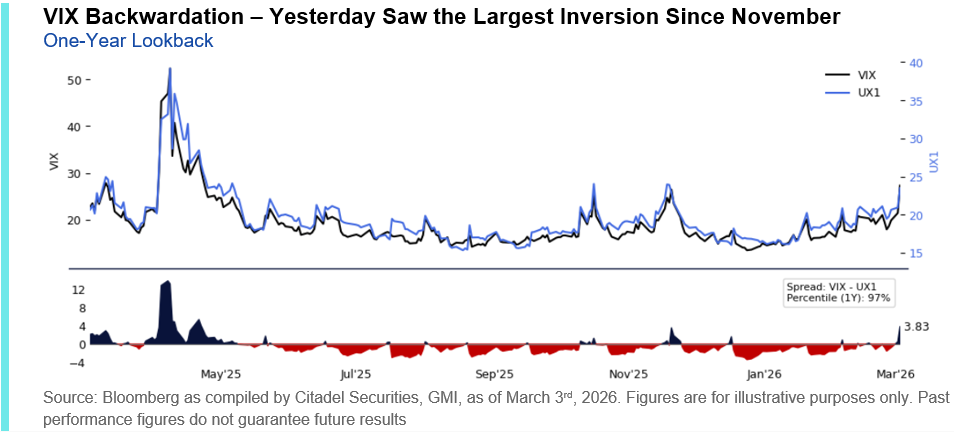
A compression of volatility will create capacity for vol-targeting, risk-parity, and CTA strategies to systematically re-lever and add equity exposure.
IX. Correlation: decline in correlation will be a positive sign the stock picking can resume.
Alongside the move yesterday, one-month and three-month implied correlations reached their highest levels since November 2025.
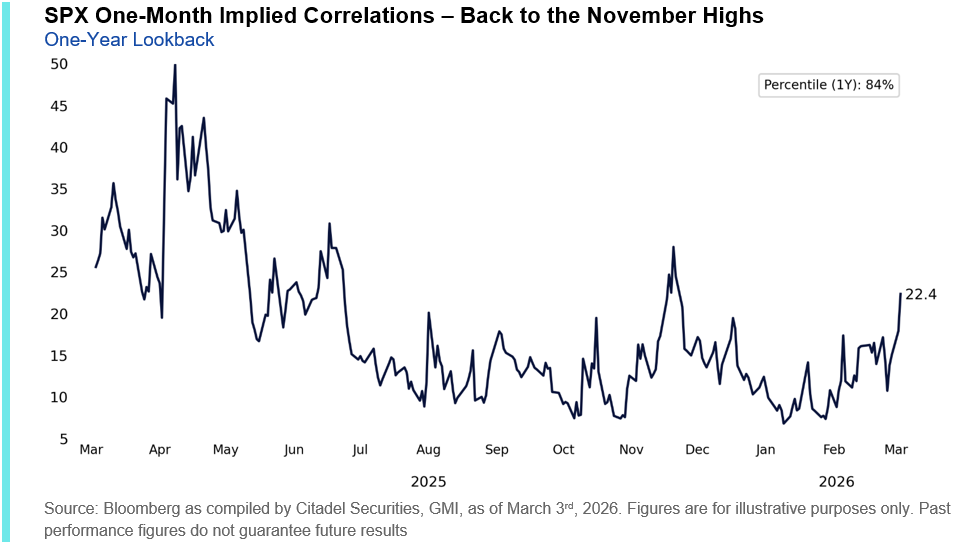
A moderation in implied correlation would indicate diminishing macro dominance, creating a more constructive backdrop for dispersion and fundamental stock-picking.
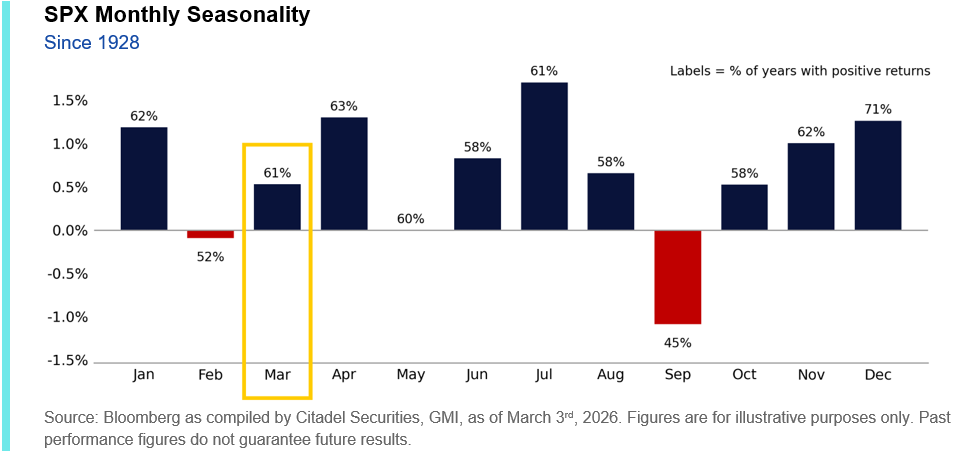
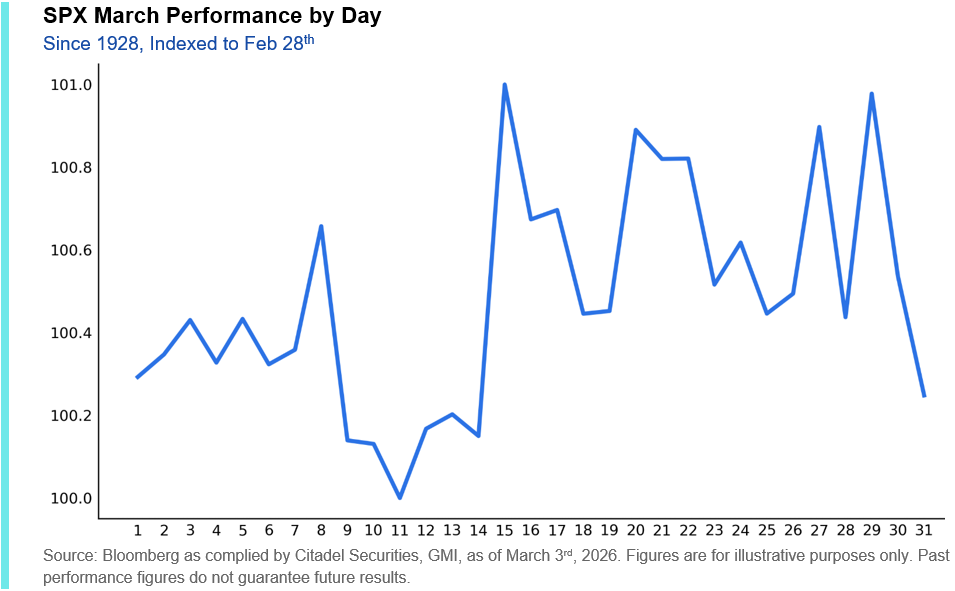
X. Seasonals become more constructive from March to April.
Seasonals have been remarkably in line with historical norms thus far in 2026. Since 1928, March is typically an up small market until Quarter End (pension fund rebalances) before entering April, which is the 2nd best month of the year.
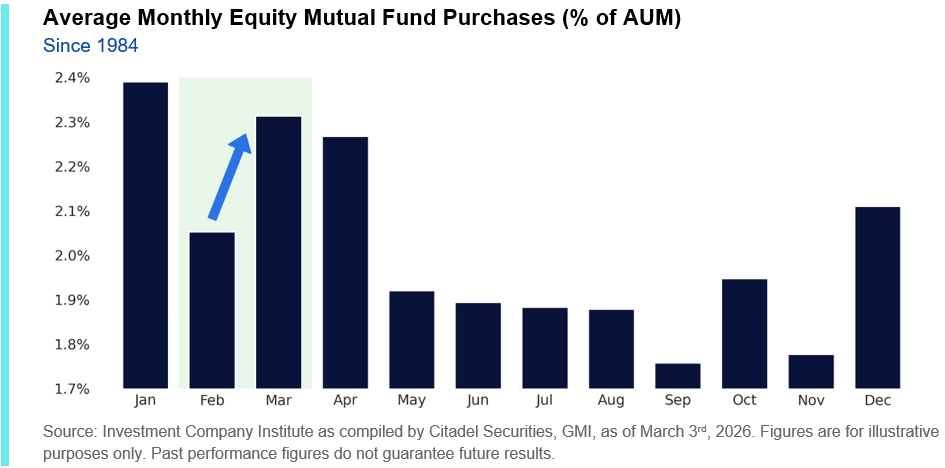
Going back to 1928, in March the S&P 500 has posted positive returns 61% of the time, with an average gain of roughly 53bps.
V. GMI BOTTOM LINE
Despite geopolitical escalation in Iran, accelerating AI-disruption headlines, and renewed private credit concerns, the index remains confined within a narrow corridor.
Defensive positioning, thin liquidity, and a concentrated call wall near SPX 7k – alongside elevated downside hedging – have mechanically constrained movement.
This is a technical market into March expiry. We take off our tactical bearish call and see scope for a bounce into mid-month, with volatility normalization acting as a catalyst. Expect chop into OpEx and greater flexibility thereafter, with April offering a more durable re-risking window.

Copyright © Citadel Enterprise Americas LLC or one of its affiliates. All rights reserved.
Legal Entities Disseminating this Material: This material is disseminated in the United Kingdom by Citadel Securities (Europe) Limited (“CDGE”) authorized and regulated by the Financial Conduct Authority (“FCA”) (Registered company number: 05462867); in the European Union by Citadel Securities GCS (Ireland) Limited (“CSGI”) and its Paris Branch authorized and regulated by the Central Bank of Ireland (“CBI”) (Registration Number: C173437); in Hong Kong by Citadel Securities (Hong Kong) Limited (“CDHK”) licensed by the Securities and Futures Commission of Hong Kong (“SFC”), in Japan by Citadel Securities Japan Co., Ltd (“CSJC”) registered as a Type 1 financial instruments business operator with the Japan Financial Services Agency (“JFSA”); and in the United States of America by Citadel Securities LLC (“CDRG”) registered with the Securities Exchange Commission (“SEC”), Financial Industry Regulatory Authority (“FINRA”), and Securities Investor Protection Corporation (“SIPC”), Citadel Securities Institutional LLC (“CSIN”) registered with the SEC, FINRA, and SIPC, or Citadel Securities Swap Dealer LLC (“CSSD”) registered with the SEC, Commodities Futures Trading Commission (“CFTC”), and National Futures Association (“NFA”). Unless governing law permits otherwise, you must contact a Citadel Securities entity in your home jurisdiction if you want to use our services in effecting a transaction in any financial instruments or securities, including derivatives.
FOR INSTITUTIONAL USE ONLY; FOR PROFESSIONAL CLIENTS AND ELIGIBLE COUNTERPARTIES ONLY. This material is not intended as and does not constitute investment research. Contents of this material will be strictly limited to non-specific, generic information (i.e. macro events/topics) and are not subject to the Markets in Financial Instruments directive (MiFID II) or FINRA research rules. This material does not constitute an offer, solicitation, invitation, or inducement to purchase, acquire, subscribe to, provide, or sell any financial instrument or otherwise engage in investment activity. Please see additional important disclosures, including disclosures that may be relevant to your country of residence or business at www.citadelsecurities.com/GlobalSalesTrading.
Explore
Market Insights - What We Do