-
Who We Are
- What We Do
Series: Global Market IntelligenceMarket Internals
By Scott Rubner
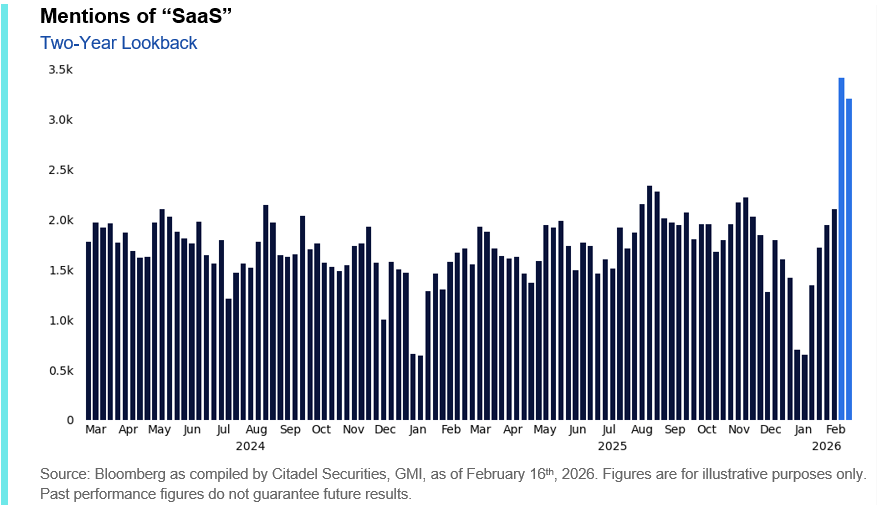
Our President Jim Esposito weighed in on last week’s software dislocations – a stark reminder that AI is accelerating the pace of change across every sector of the economy. Read his take here.
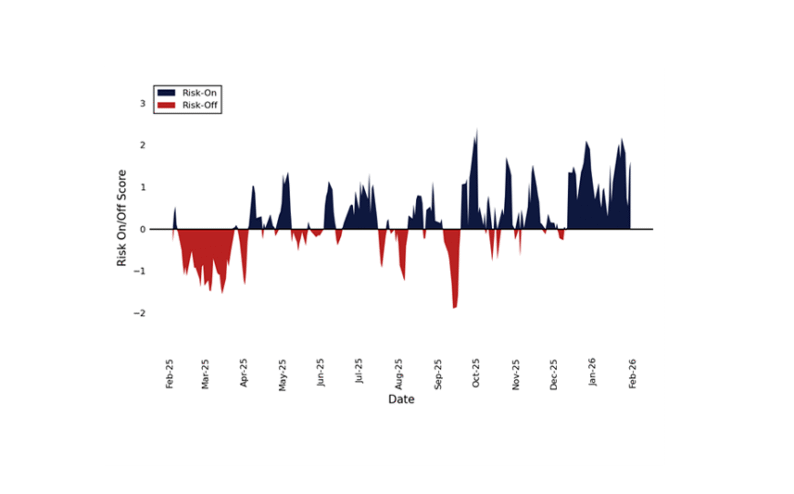
Only 31 trading sessions into the year, the index may appear relatively stable – but the magnitude of sector and factor reallocation beneath the surface has been anything but.
Retail participation remains historically elevated, ETF flows are tracking at one of the strongest early-year paces on record, and liquidity has thinned during episodic selloffs. At the same time, AI-driven disruption narratives have accelerated repricing across vulnerable business models, intensifying rotation even as headline performance remains contained.
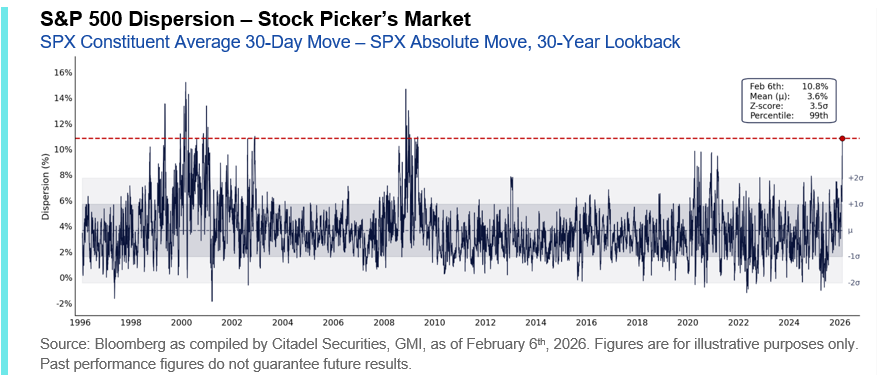
The speed of the recent factor rotation has translated directly into elevated dispersion. Single-stock dispersion is at extreme levels. Over the past 30 days, the S&P 500 is down 1.4%, while the average stock in the index has moved 10% in absolute terms, placing the 8.6% dispersion spread in the 97th percentile over the past three decades. Earlier this month, this spread surged to 10.8% – a 99th percentile event and a 3.5σ outlier over the past thirty years.
Our focus is on helping clients navigate this regime – identifying where flows are reinforcing momentum, where positioning stress may create opportunity, and where protection remains most efficient.

I. Retail: Structurally Elevated Participation
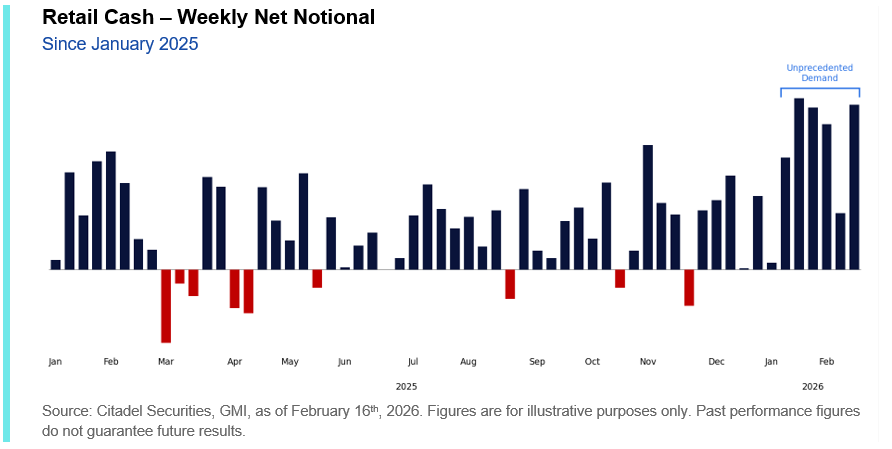
To start the year, retail participation has been unprecedented.
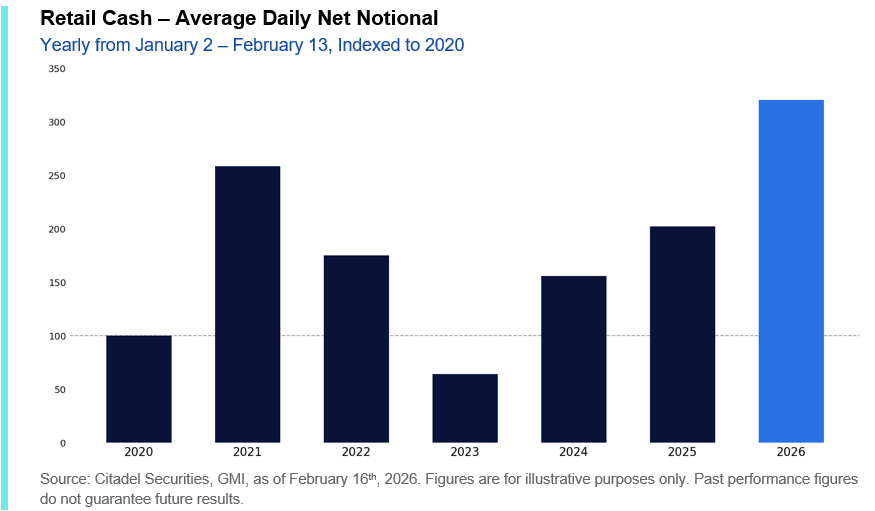
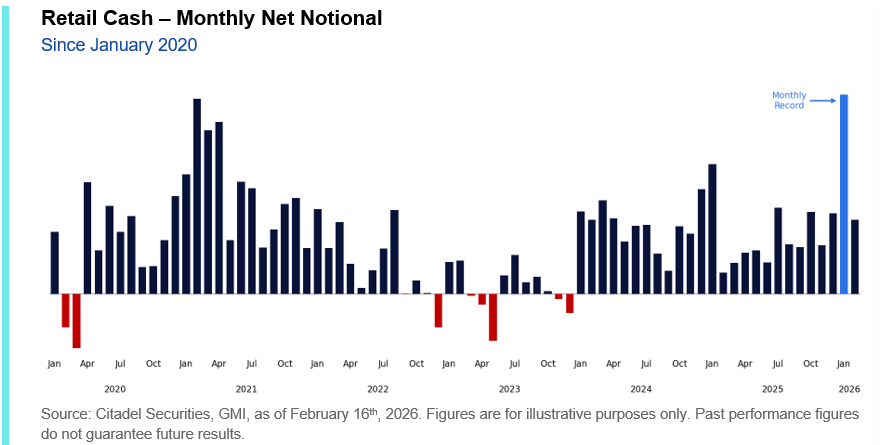
Net notional on our platform has reached levels we have never observed before. The magnitude, persistence, and breadth of buying activity have materially exceeded prior peaks, underscoring retail’s role as a primary source of incremental demand in early 2026.
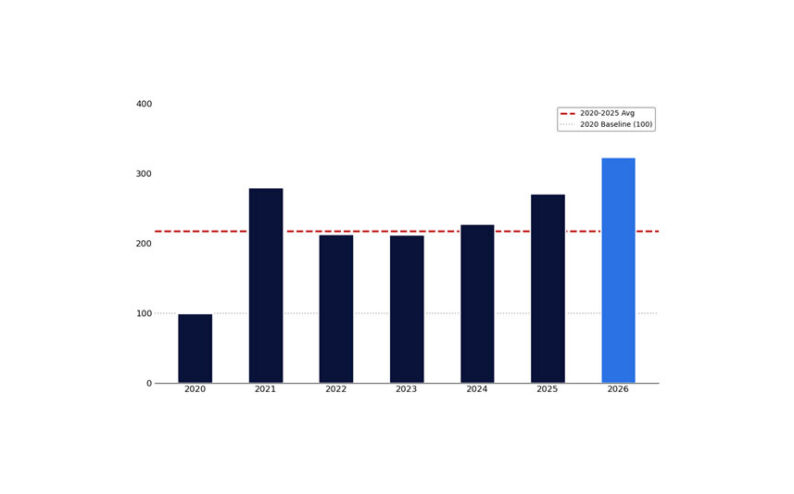
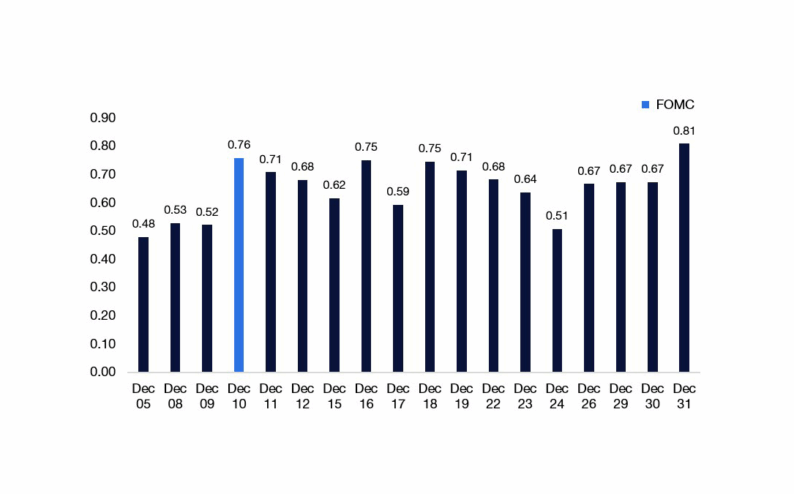
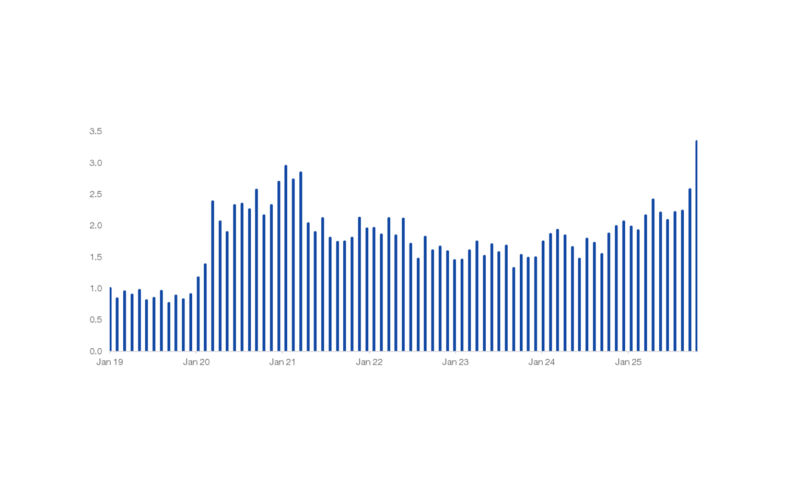
Average daily net notional traded on our platform from January 2nd through February 13th is running far above any comparable period in our history – nearly 60% above last year, ~25% above the prior peak in 2021, and double the 2020-2025 average.
This is not a function of a few outsized sessions. The activity has been persistent. Zooming out, both weekly and monthly aggregates reinforce the same message: retail has been a sustained and material source of demand across equities to start the year.
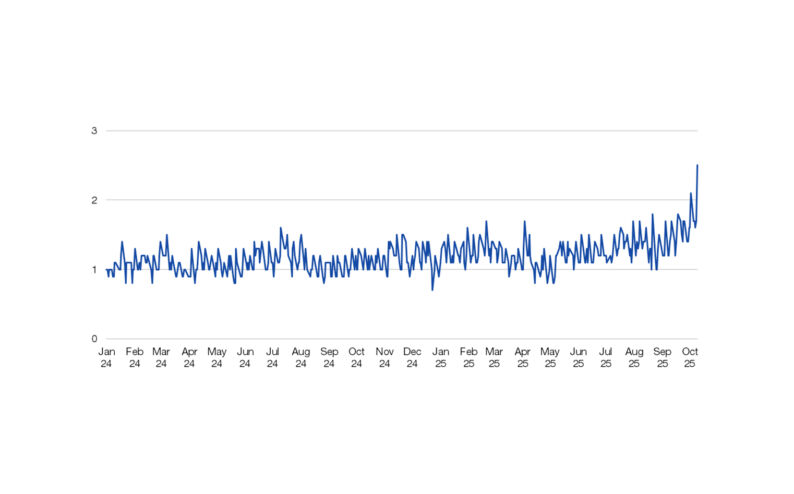
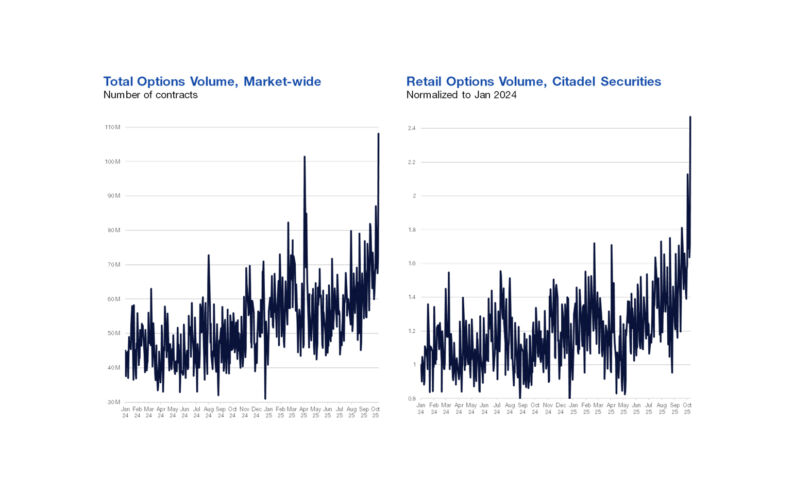
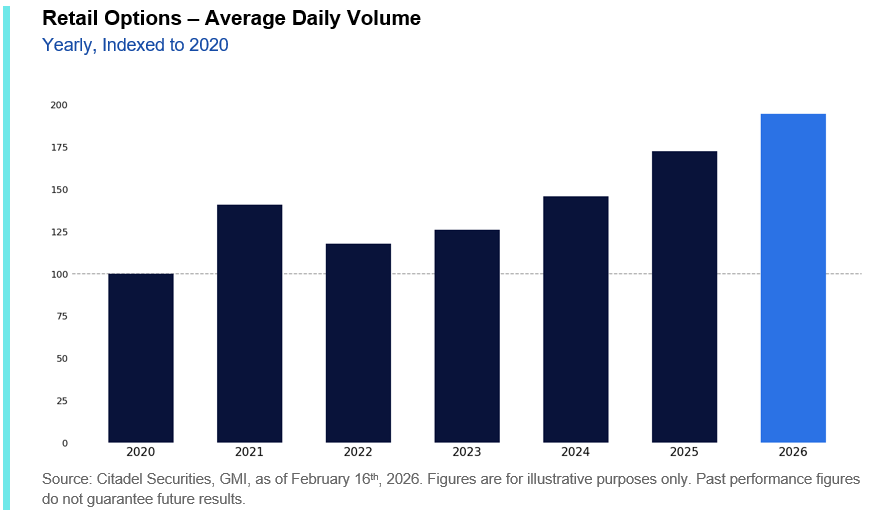
This strength is not limited to cash equities. Retail options participation in 2026 is already running at historically elevated levels. Average daily options volume year-to-date is more than 15% above last year’s pace and nearly 50% above the 2020-2025 average.
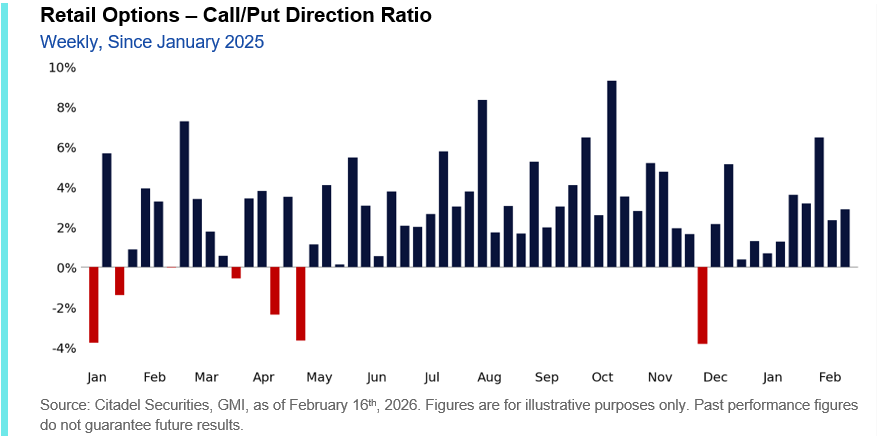
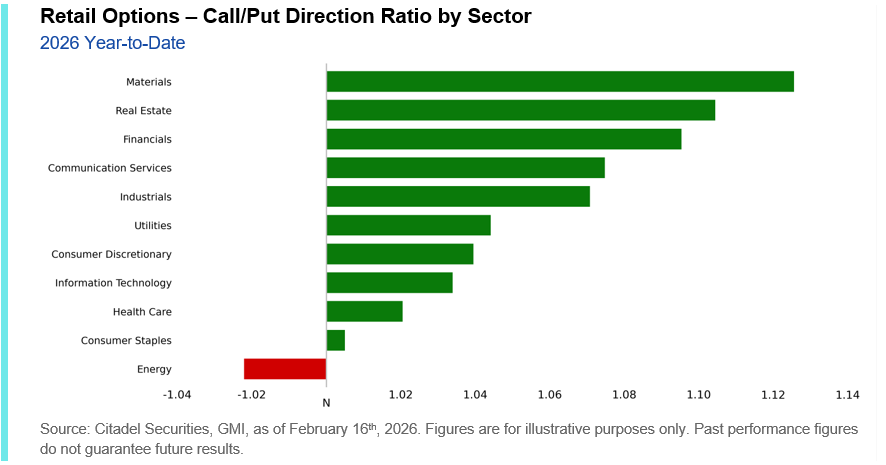
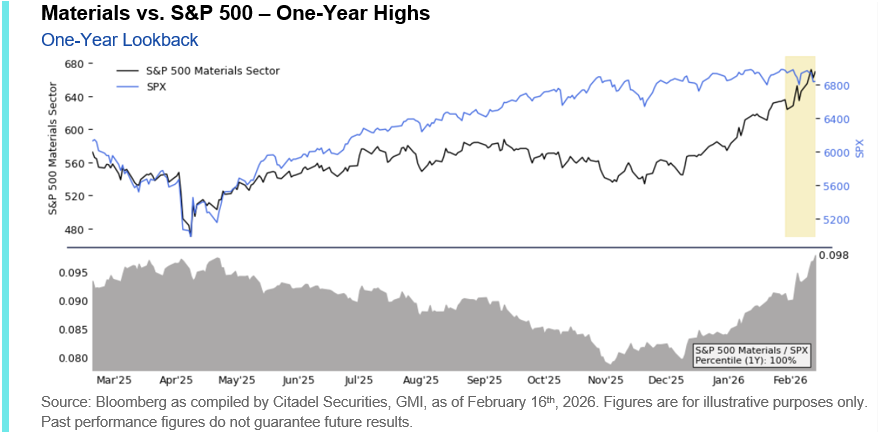
Retail options investors have been skewed better to buy in 41 of the last 42 weeks – a level of consistency that underscores sustained risk appetite rather than episodic positioning. Year-to-date, the largest buy skews have emerged in Materials, Real Estate, Financials, Communication Services, and Industrials, while Energy stands out as the only major sector exhibiting a more pronounced sell skew.
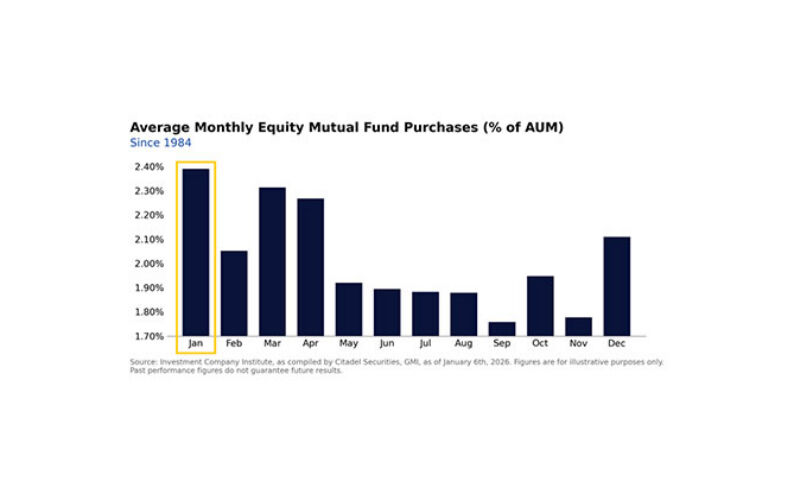
As we’ve highlighted in prior notes around the #JanuaryEffect, retail flows are typically front-loaded. January historically represents the largest share of annual net notional, with February stepping down meaningfully in proportion. The seasonal pattern suggests that early-year intensity often moderates as the quarter progresses.
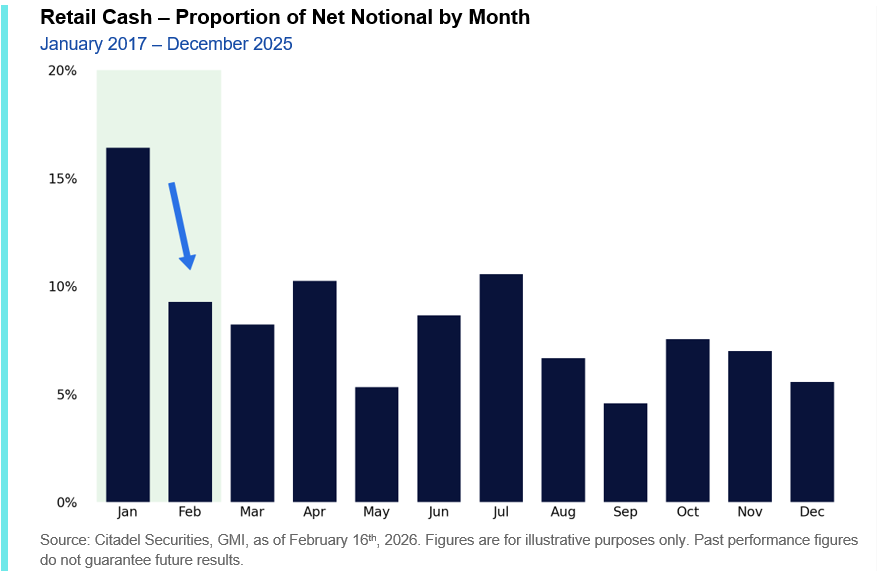
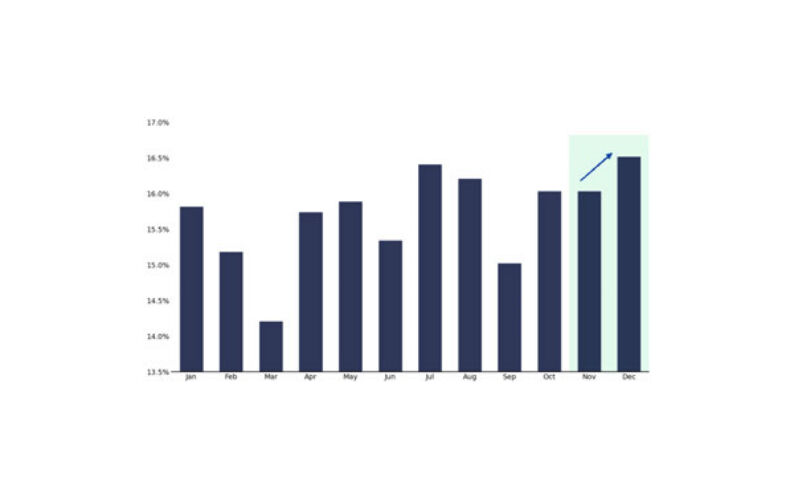
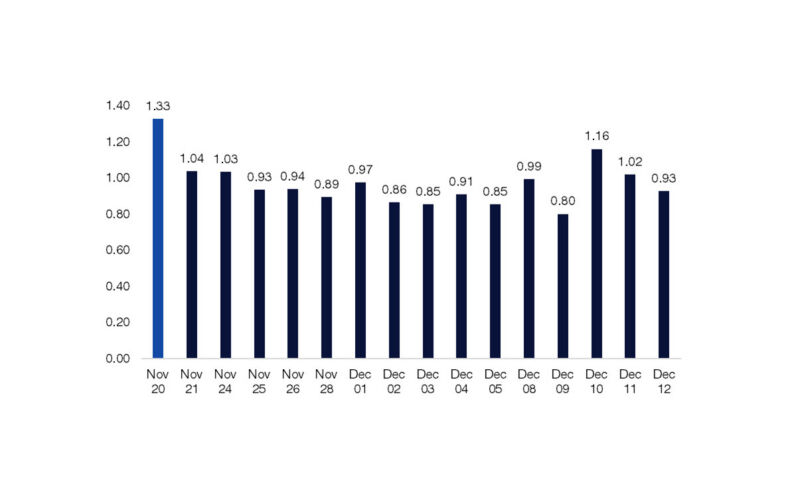
So far, however, February flows have continued at a pace more consistent with January’s strength than with the historical step-down. Participation has remained elevated into mid-month.
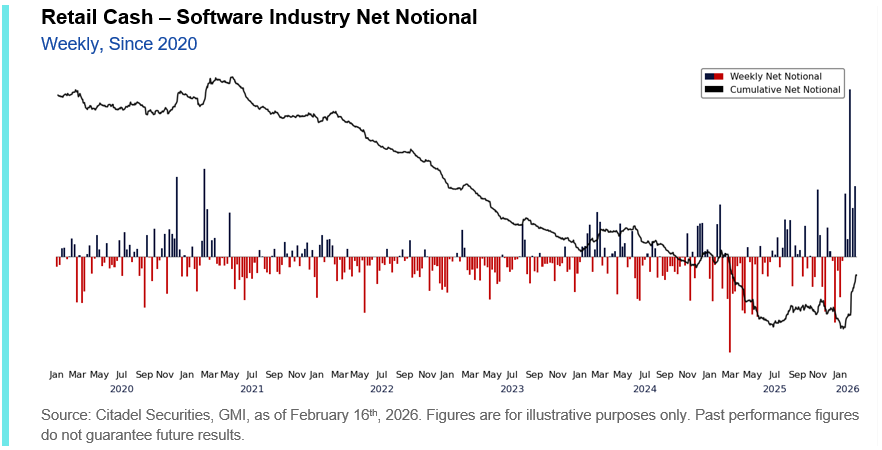
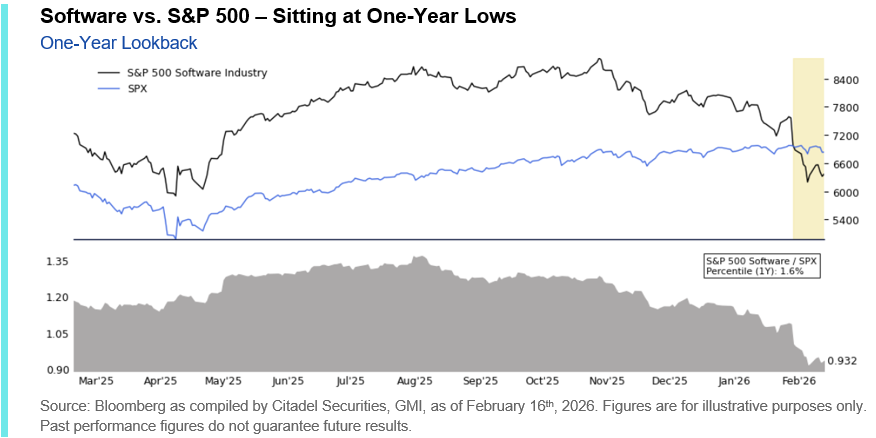
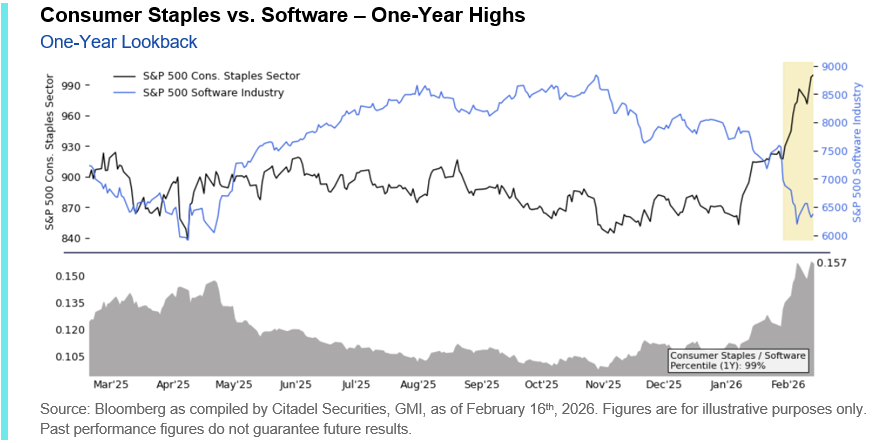
Importantly, part of this resilience appears reactive, particularly in sectors that have borne the brunt of recent factor moves. Software is the clearest example – as the group has come under pressure, retail investors have leaned aggressively into the weakness, driving flows decisively into single-stock software names.
As our colleague Thomas Sozzi highlighted last week, this buying has reached historically extreme levels. The magnitude of recent inflows already amounts to roughly two-thirds of the total net flow seen across all of 2025 – despite that year ultimately ending with retail as a strong net seller of the group.
In other words, continued February strength has been supported in part by concentrated dip-buying within one of the market’s most volatile segments. If flows were to normalize toward more typical February proportions, the incremental bid behind retail-favored themes – several of which have led year-to-date – could begin to soften. Retail does not need to reverse outright to influence price dynamics. We are monitoring for signs of a moderation in intensity, which could be sufficient to alter momentum in areas that have relied heavily on sustained dip-buying and concentrated participation.
II. Rotation: Sell First, Questions Later
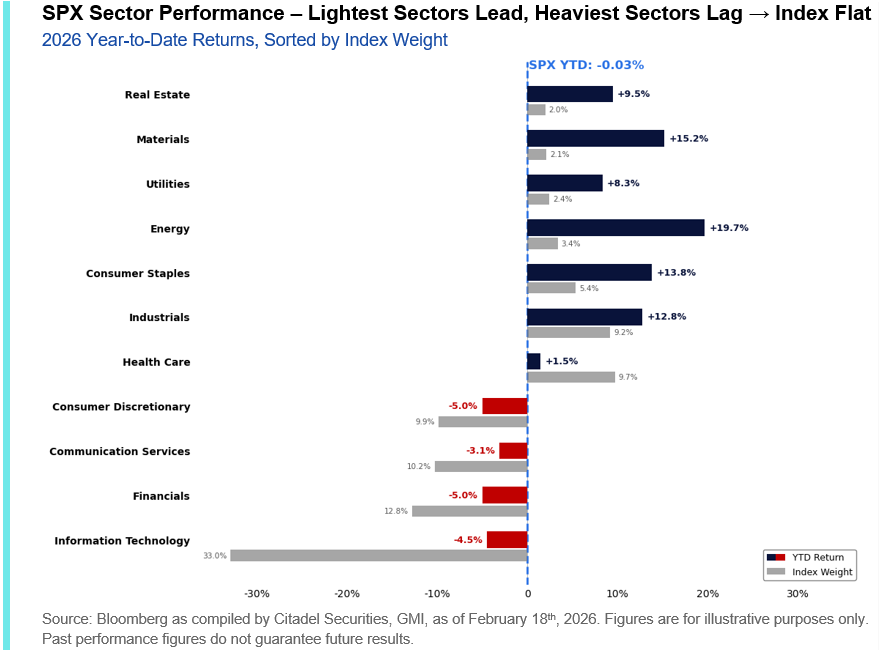
At the index level, performance appears relatively muted, with the S&P 500 -3bps year-to-date. Beneath the surface, however, the magnitude of sector and factor divergence has been significant.
Capital is not exiting risk – it is being aggressively reallocated.
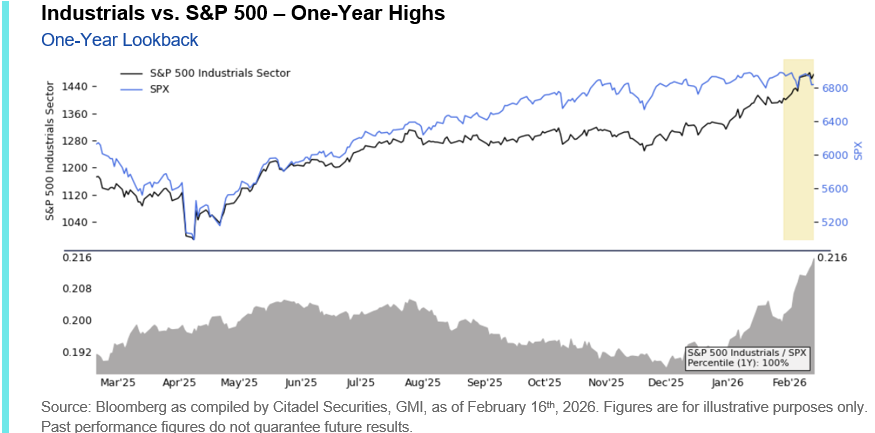
The rotation into cyclicals and value-sensitive segments is not new. Capital continues to rotate away from the narrow mega-cap monolith that has defined US index leadership and toward a more reflationary backdrop characterized by accelerating nominal growth and real-asset outperformance – a dynamic we expect to remain in place through 2026.
For much of the past decade, that leadership (tech) was anchored by asset-light business models, high incremental margins, and digital scalability. Quality was synonymous with capital efficiency, and growth was largely defined by software and platform economics.
The pattern has been consistent: sectors perceived as structurally vulnerable are repriced rapidly, often before the magnitude or timing of fundamental disruption is fully understood. This has produced a “sell first, ask questions later” tone to the latest leg of the rotation.
The accelerated de-rating has reinforced the shift toward more cyclical and defensive sectors, deepening the rotation that was already underway.
Importantly, this does not resemble a brief factor unwind. If the market is reassessing the relative value of asset-heavy versus asset-light models, and questioning the durability of prior US mega-cap dominance, positioning may remain misaligned for weeks and months rather than days.
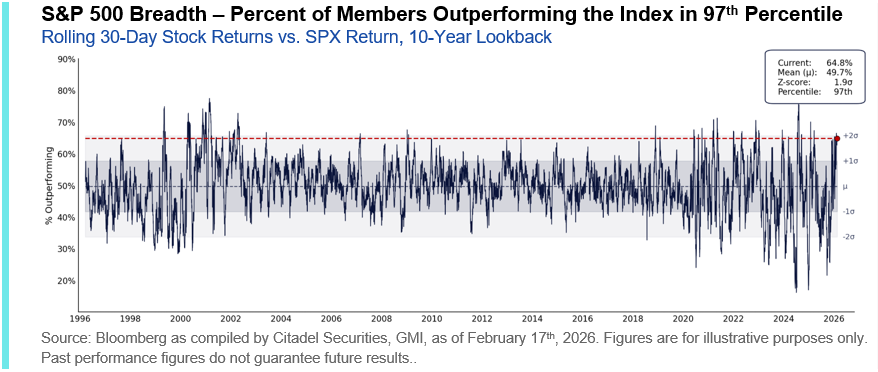
The internal shift is also evident in breadth, which has inflected decisively higher: 65% of S&P 500 constituents have outperformed the index over the past 30 days, a 97th percentile reading relative to the last 30 years. This marks a sharp reversal from the narrow leadership observed in late October 2025, when breadth fell to just 25%.
Year-to-date, the Russell 2000 has meaningfully outperformed the S&P 500, reflecting a move away from prior mega-cap concentration and toward more economically sensitive exposures.
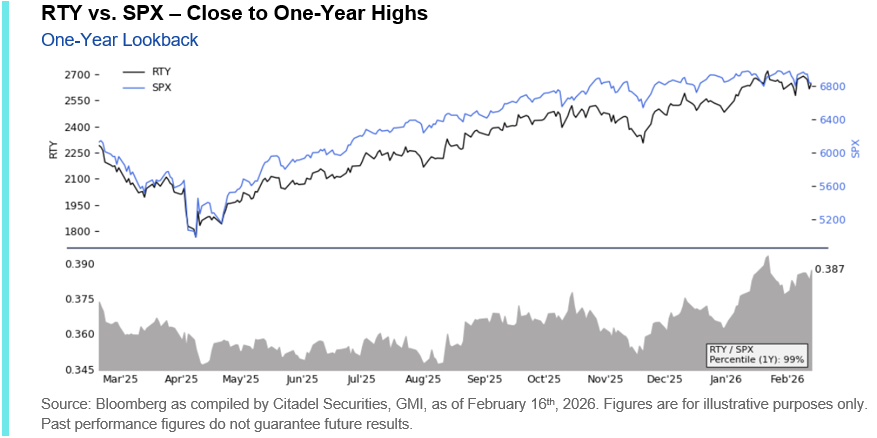
This relative strength is consistent with a broader reallocation underway – one that extends beyond a simple cyclical bounce and instead reflects a reassessment of where durable value accrues in an AI-intensive economy.
III. Positioning: Thin Liquidity, Elevated Hedges, and Extreme Dispersion
The consequence of the recent internal rotation has been a meaningful shift in market structure.
Liquidity has thinned notably during the selloffs. ES1 depth fell to the 5th percentile relative to the past two years, as ETF share of total volume climbed to the 97th percentile.
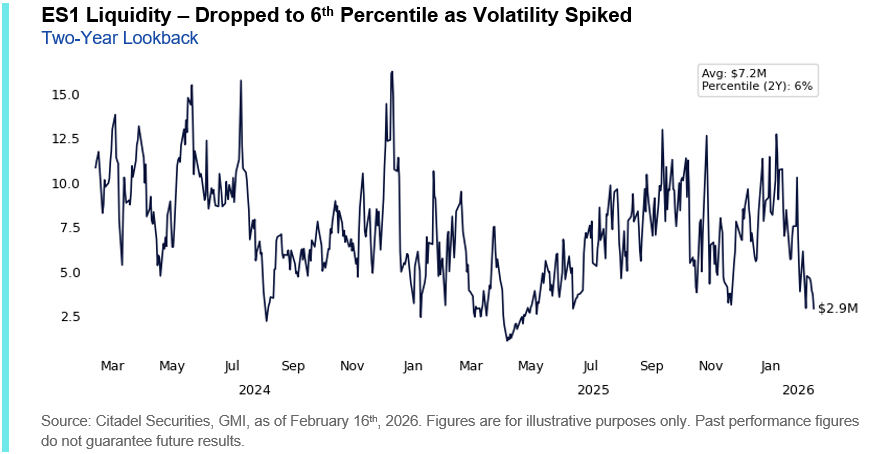
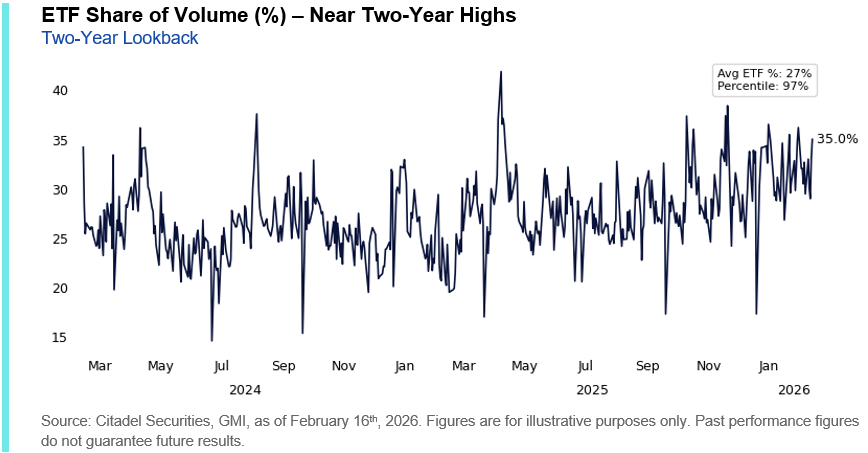
When liquidity compresses and trading activity concentrates in passive vehicles, incremental flows can have outsized price impact. In this environment, reallocation moves are amplified.
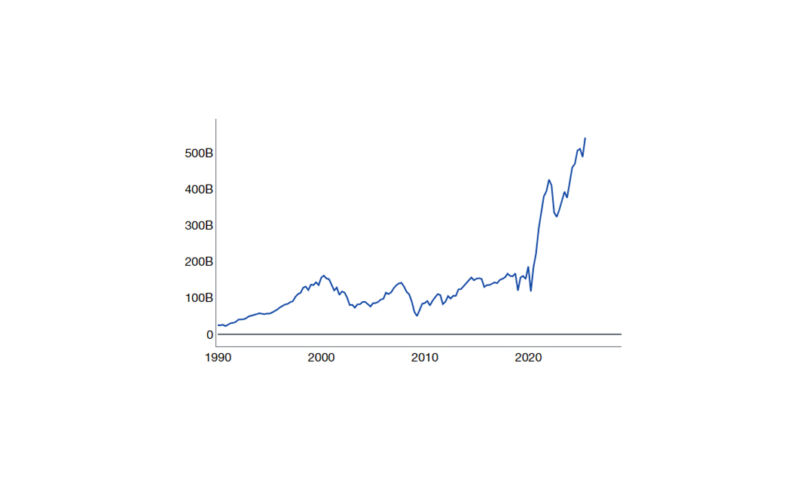
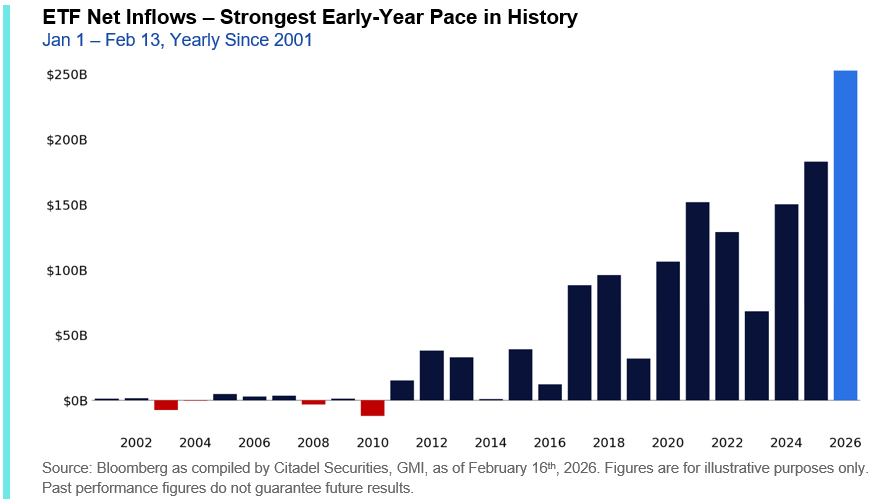
The scale of ETF flows underscores that point. We are just 31 trading days into the year, yet ETFs have already attracted nearly $253 billion in inflows – roughly 40% higher than at this point last year. For context, the average full-year ETF inflow through 2020 was approximately $244 billion. In just six weeks, ETF flows have already exceeded what once represented a typical entire year.
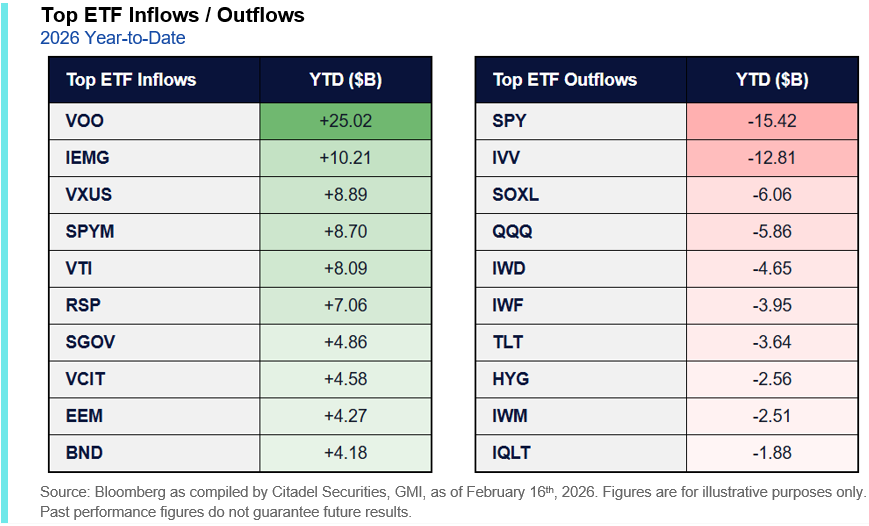
The composition of flows is equally instructive. Broad beta vehicles such as VOO and VTI dominate inflows, alongside meaningful allocations to equal-weight exposure (RSP) and international equities. Fixed income ETFs have also attracted capital.
By contrast, outflows have been concentrated in traditional large-cap index ETFs such as SPY and IVV, as well as technology-heavy exposures including QQQ.
The divergence underscores that capital is being redistributed within the equity complex rather than withdrawn, with passive vehicles playing an increasingly dominant role in determining where marginal flows are expressed.
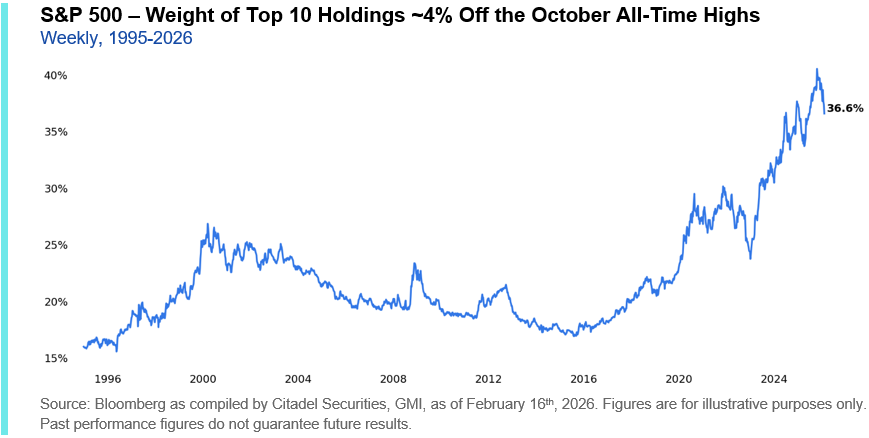
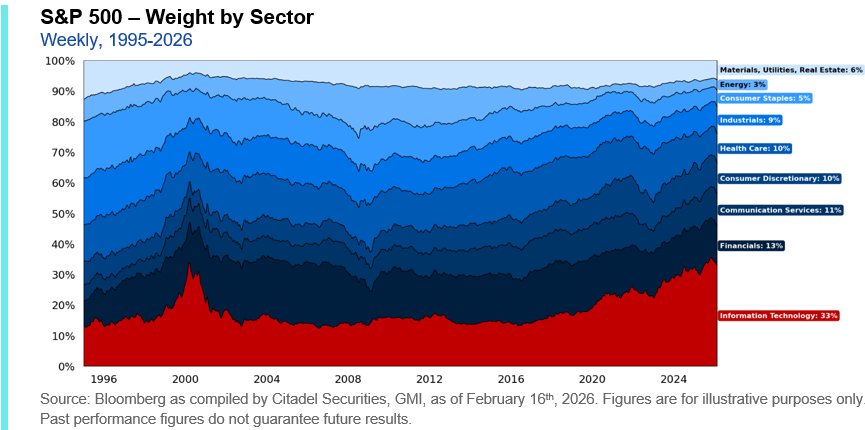
That redistribution is also visible in index concentration. The aggregate weight of the top 10 S&P 500 constituents has declined from a peak of approximately 40.5% in October to roughly 37% today, marking a meaningful compression in mega-cap dominance.
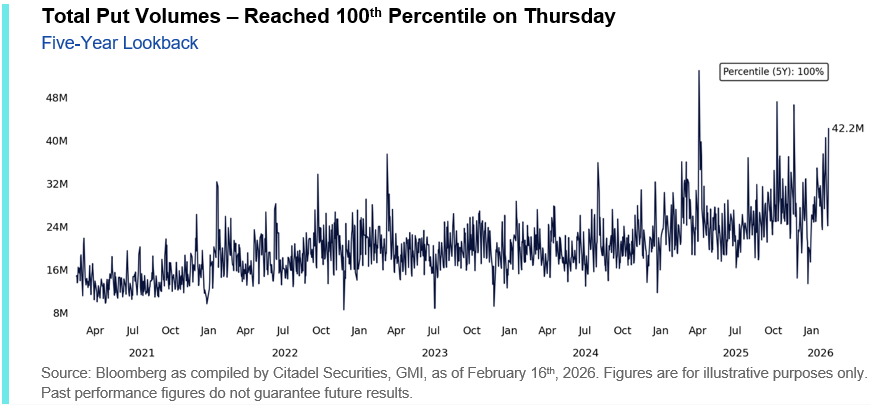
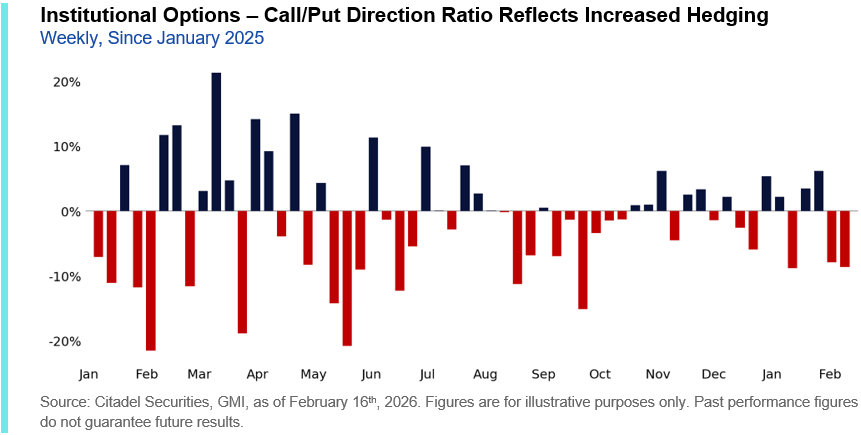
At the same time, hedging demand has increased. Total put volumes spiked, and volatility has begun to reprice higher across the index complex.
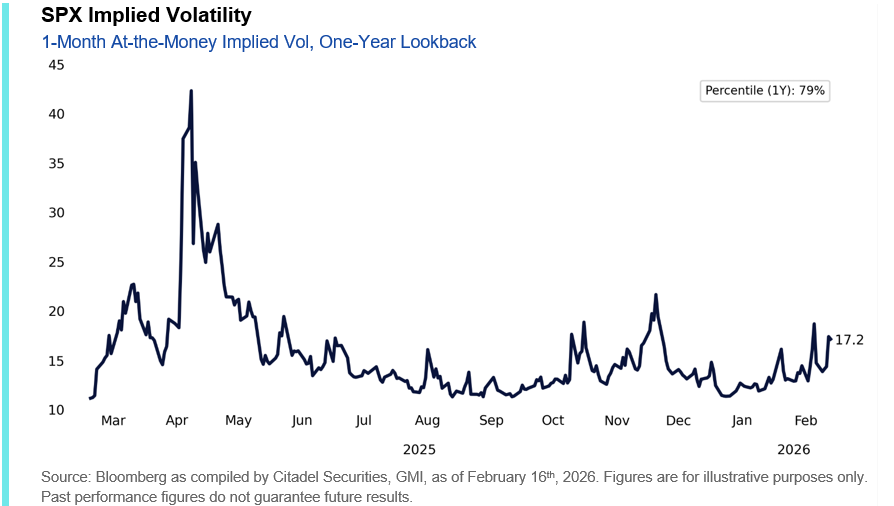
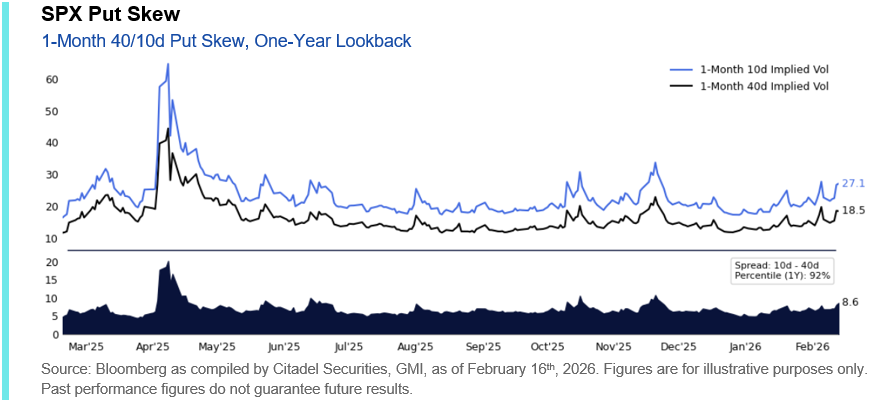
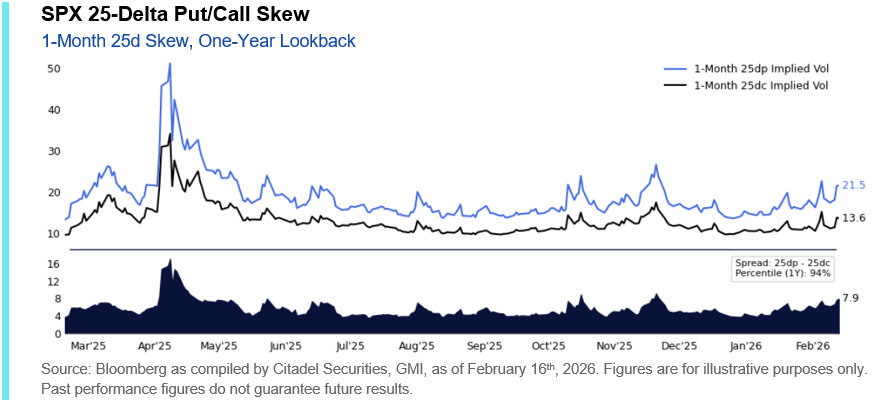
SPX one-month at-the-money volatility is now in the ~80th percentile of its one-year range, while skew measures have moved into the 90th percentiles. The market is demanding downside protection even as the index itself has remained relatively contained.
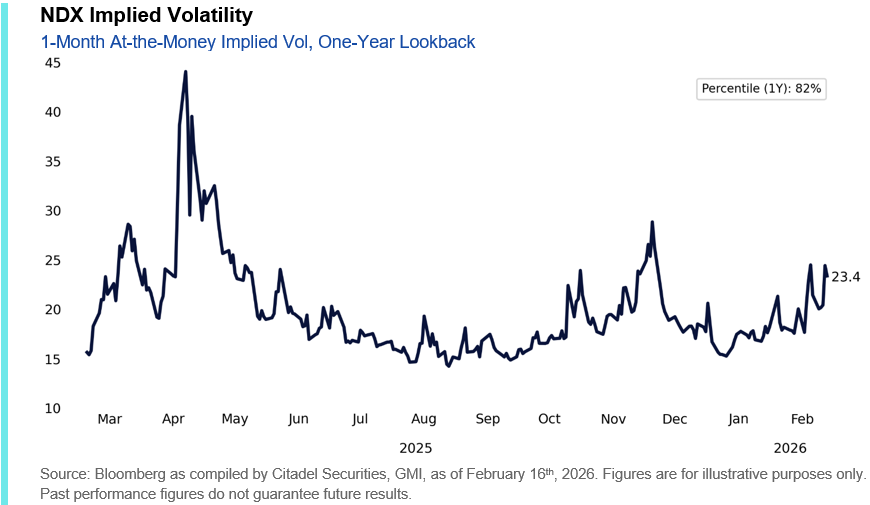
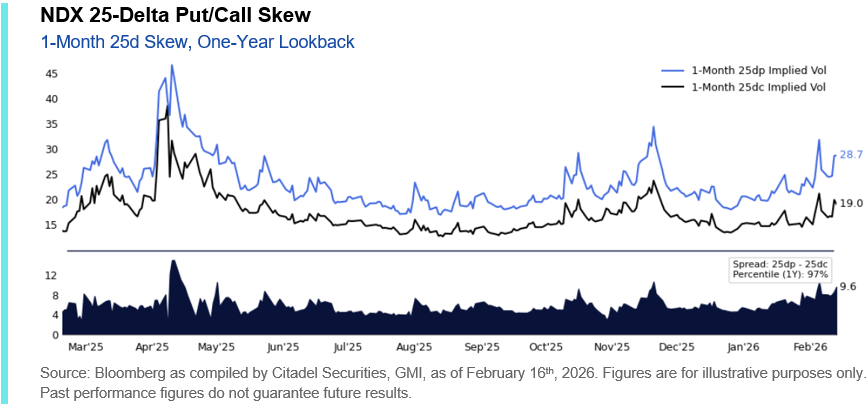
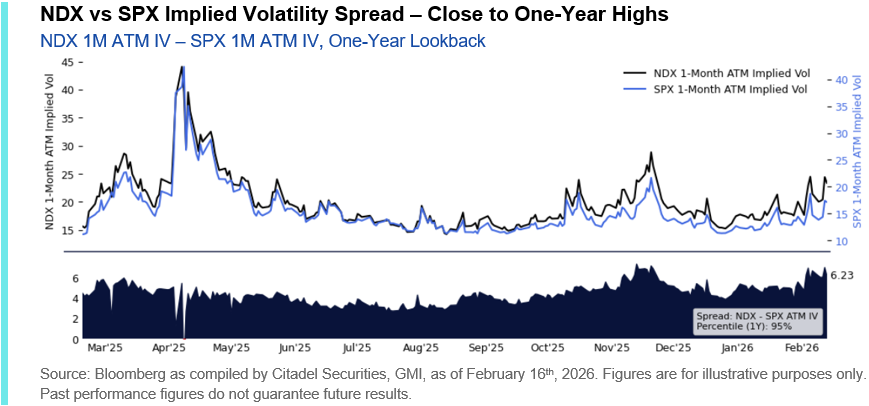
The repricing is even more pronounced within technology. NDX one-month ATM volatility and skew metrics have moved into the low-to-mid 90th percentiles, with the spread between NDX and SPX volatility near one-year extremes.
In addition to elevated dispersion (highlighted above), downside breadth has reached statistically extreme levels.
In the five trading sessions ending last week, the number of S&P 500 constituents experiencing −3σ downside moves (relative to their own 1-year volatility) surged into the top 5% of historical observations. This type of clustered, statistically extreme selling has historically coincided with positioning stress and forced deleveraging episodes.
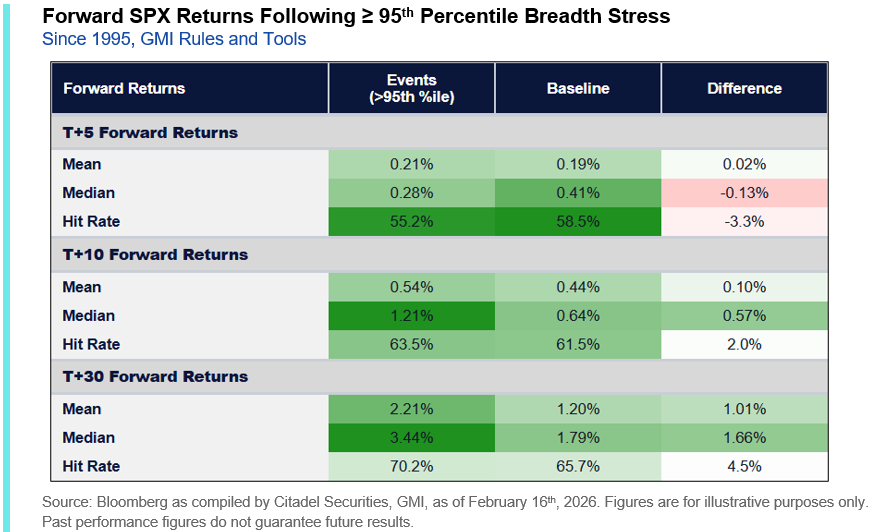
Historically, episodes where 5-day breadth stress reaches the 95th percentile or higher have often been followed by stronger SPX T+30 performance compared to normal conditions:
- Mean return: +2.2% vs +1.2% baseline
- Median return: +3.4% vs +1.8% baseline
- Hit rate: ~70%
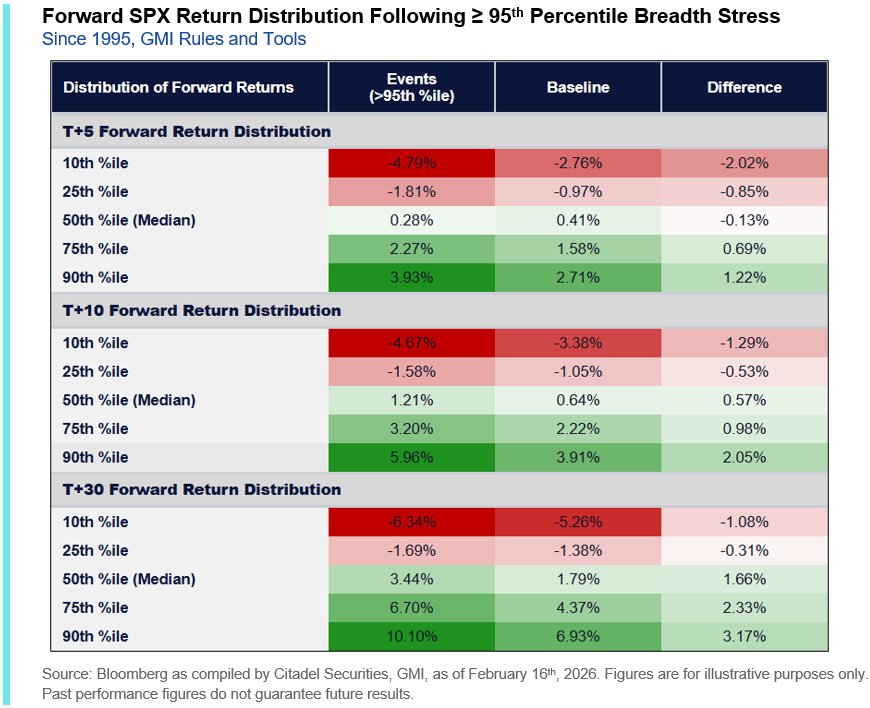
The shift is not limited to average returns. More notably, the forward return distribution widens materially following breadth stress episodes:
- 30-day downside tail (10th percentile) deteriorates: -6.3% vs -5.3% baseline
- 30-day upside tail (90th percentile) expands: +10.1% vs +6.9% baseline
In other words, breadth stress episodes have historically coincided with wider forward return distributions – fatter tails in both directions rather than a clean directional bias. The data reinforces what intuition would suggest: when positioning stress surfaces, volatility expands and forward outcomes become more dispersed.
Institutional positioning reflects that caution. We have seen a notable increase in demand for protection in recent sessions, with hedging activity skewing increasingly short-dated. Rather than extending duration or materially reducing exposure, investors appear focused on managing near-term downside protection amid heightened factor volatility.
Sector-specific hedging has also increased, and small caps have emerged as a preferred vehicle for broader protection. In addition to its recent outperformance, the Russell 2000’s greater exposure to retail-favored and higher-beta themes leaves it more sensitive to any normalization in retail demand.
IV. Profits: Capex Rising, Buybacks Falling
We are now roughly 75% of the way through S&P 500 earnings season. Approximately 75% of companies have exceeded sales expectations, and nearly 80% have surpassed EPS forecasts. Beat rates have been strongest in Energy, Information Technology, and Communication Services, while Materials, Utilities, and Real Estate have delivered comparatively weaker results.
While headline earnings have been constructive, the more consequential shift this quarter may lie in capital allocation.
Upward revisions to hyperscaler capital expenditure plans have continued. Projected spending for FY26 now approaches ~$650 billion, with additional growth anticipated into FY27 and FY28. Investment commitments remain substantial, and in several cases are accelerating rather than plateauing.
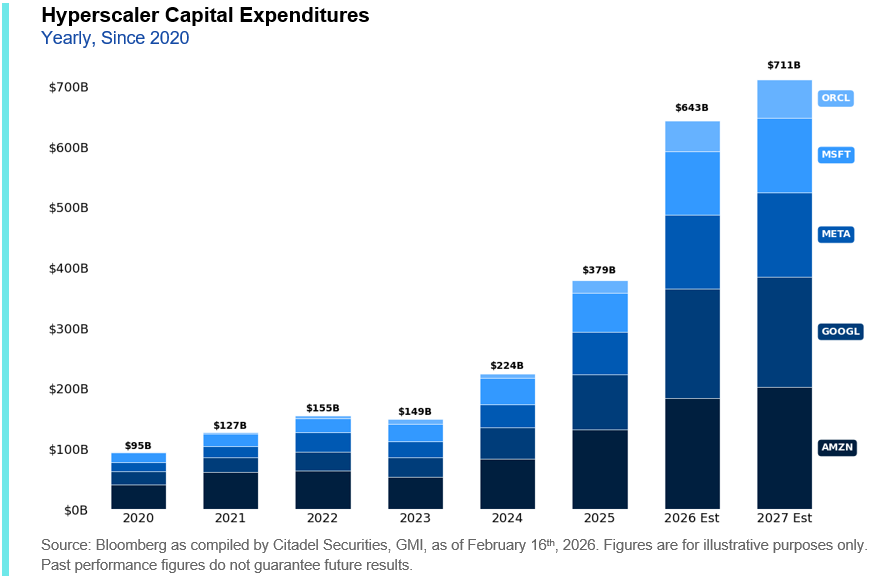
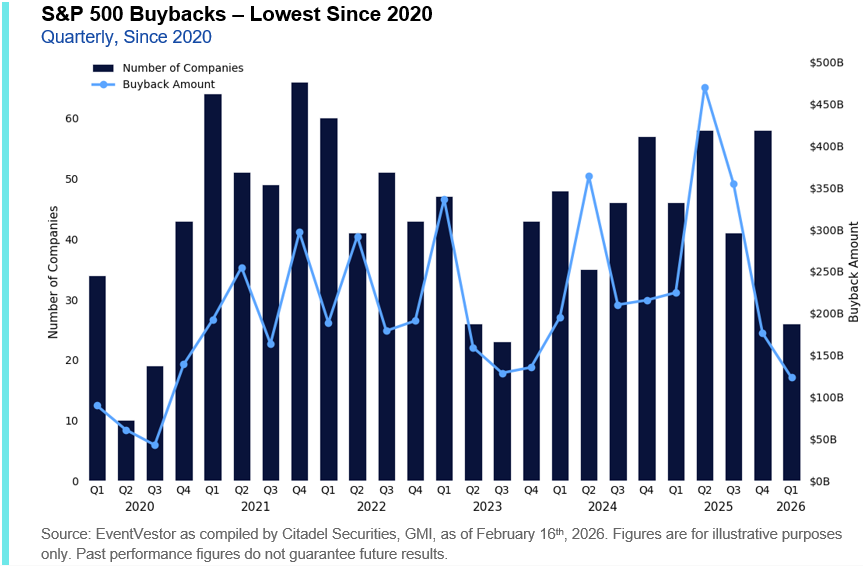
This surge in investment has coincided with moderation in share repurchase activity. Aggregate buyback volumes have softened to their lowest levels since 2020 as incremental cash flow is increasingly directed toward compute, data center expansion, and AI infrastructure.
V. GMI BOTTOM LINE

The index may look calm, but the underlying crosscurrents are not.
Retail flows remain elevated, rotation across sectors and the cap spectrum continues, and institutional positioning reflects heightened sensitivity to incremental change. Liquidity compression and passive flow concentration have amplified price moves, while capital allocation is shifting toward investment over distribution, reinforcing both disruption risk and structural dispersion.
This is less an index-driven market and more a reallocation-driven one.
In dispersion regimes, volatility creates opportunity – particularly when positioning and flows become crowded or one-sided. Dislocations driven by rapid factor repricing and concentrated hedging activity can create attractive entry points in high-quality equities.
We remain focused on delivering real-time market color, differentiated flow intelligence, and dependable liquidity as conditions evolve. Please reach out to discuss where we can be helpful.

Copyright © Citadel Enterprise Americas LLC or one of its affiliates. All rights reserved.
Legal Entities Disseminating this Material: This material is disseminated in the United Kingdom by Citadel Securities (Europe) Limited (“CDGE”) authorized and regulated by the Financial Conduct Authority (“FCA”) (Registered company number: 05462867); in the European Union by Citadel Securities GCS (Ireland) Limited (“CSGI”) and its Paris Branch authorized and regulated by the Central Bank of Ireland (“CBI”) (Registration Number: C173437); in Hong Kong by Citadel Securities (Hong Kong) Limited (“CDHK”) licensed by the Securities and Futures Commission of Hong Kong (“SFC”), in Japan by Citadel Securities Japan Co., Ltd (“CSJC”) registered as a Type 1 financial instruments business operator with the Japan Financial Services Agency (“JFSA”); and in the United States of America by Citadel Securities LLC (“CDRG”) registered with the Securities Exchange Commission (“SEC”), Financial Industry Regulatory Authority (“FINRA”), and Securities Investor Protection Corporation (“SIPC”), Citadel Securities Institutional LLC (“CSIN”) registered with the SEC, FINRA, and SIPC, or Citadel Securities Swap Dealer LLC (“CSSD”) registered with the SEC, Commodities Futures Trading Commission (“CFTC”), and National Futures Association (“NFA”). Unless governing law permits otherwise, you must contact a Citadel Securities entity in your home jurisdiction if you want to use our services in effecting a transaction in any financial instruments or securities, including derivatives.
FOR INSTITUTIONAL USE ONLY; FOR PROFESSIONAL CLIENTS AND ELIGIBLE COUNTERPARTIES ONLY. This material is not intended as and does not constitute investment research. Contents of this material will be strictly limited to non-specific, generic information (i.e. macro events/topics) and are not subject to the Markets in Financial Instruments directive (MiFID II) or FINRA research rules. This material does not constitute an offer, solicitation, invitation, or inducement to purchase, acquire, subscribe to, provide, or sell any financial instrument or otherwise engage in investment activity. Please see additional important disclosures, including disclosures that may be relevant to your country of residence or business at www.citadelsecurities.com/GlobalSalesTrading.
Explore
Global Market Intelligence - What We Do