-
Who We Are
- What We Do
Series: Global Market IntelligenceNovember
By Scott Rubner
Over the past several weeks, I’ve been on the road meeting clients across the globe. The consistent message: institutional investors remain cautious and are hesitant to add risk. However, today’s CPI print gives equities the green light in the absence of near-term economic headwinds.
As we head into November, several important flow-of-funds and technical dynamics come into play — many of which begin next week. The following highlights are drawn from my latest GMI presentation, which I’m sharing more broadly. I remain constructive on U.S. equities and expect these themes to dominate client discussions into the weekend, as new all-time highs are made today.
This morning marked the highest volume of incoming client inquiries since I joined Citadel Securities.
GMI November Checklist ✅
📌 10 Themes: The GMI Year-End Rally Setup
- Retail Equity Flow: Persistent retail equity demand continues to act as a price setter of equities. Retail equity volumes are highest since Feb 2021
- Retail Call Option Frenzy: Retail call buying is hitting new record levels — a clear sign of renewed confidence.
- Seasonal Tailwinds: The best seasonal window of the year begins next week, historically a strong period for equities.
- Corporate Buyback Blackout Ending: Corporate repurchase activity resumes next week, adding incremental demand.
- Institutional Caution: Institutional sentiment remains deeply negative — positioning still reflects skepticism.
- Performance Chase Underway: Growing investor focus on “what can move the most” — high beta and cyclical exposure are back in focus. Positive equity years tend to continue into year-end.
- Discretionary Positioning: After recent de-grossing and factor rotations, discretionary portfolios remain underexposed to an upside move.
- CTA Supply Absent: Systematic selling failed to trigger — key technical levels held, avoiding mechanical deleveraging.
- Volatility Reset: November historically sees a sharp volatility decline, particularly following the recent spike.
- Earnings and Mutual Fund Year-End: Next week is the “Super Bowl” of earnings season — 40% of S&P 500 market cap reports, including 5 of the Mag 7 — coinciding with mutual fund fiscal year-end repositioning.
These are my favorite new charts this week:
- Retail investors remain a significant new force in the U.S. equity market, and I view this cohort as a positive macro signal reflecting underlying consumer and investor confidence.
- Option volumes continue to set new weekly records, while cash equity volumes have risen to their highest levels of the year. Retail participation in the equity market (~22%) now stands at its strongest since February 2021.
- While some peers have offered varying interpretations of this activity, our data show retail flows have been consistently resilient since April, underscoring the persistence of this trend. These are my favorite charts from our GMI presentation.
Citadel Securities Retail Option Volume
Normalized to January 2024 (Jan 2024-Oct 2025)
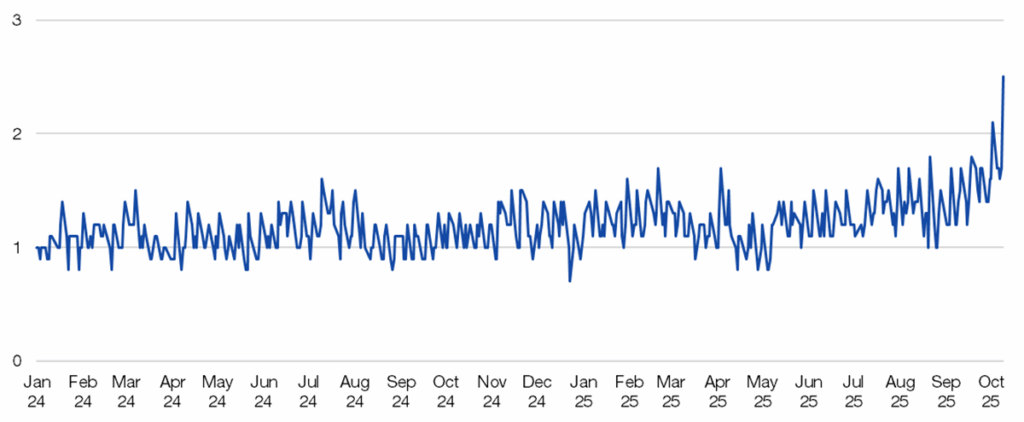
Source: Citadel Securities, as of October 24th, 2025. Figures are for illustrative purposes only. Past performance figures do not guarantee future results.Citadel Securities Total Shares Executed
January 2017-October 2025
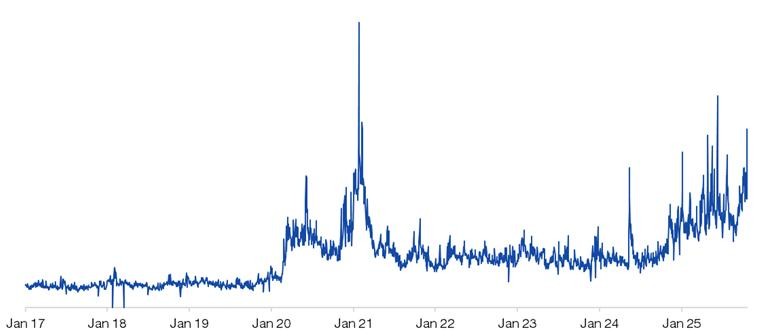
Source: Citadel Securities, as of October 24th, 2025. Figures are for illustrative purposes only. Past performance figures do not guarantee future results.Retail % of Total Cash Market (Shares)
January 2018-October 2025
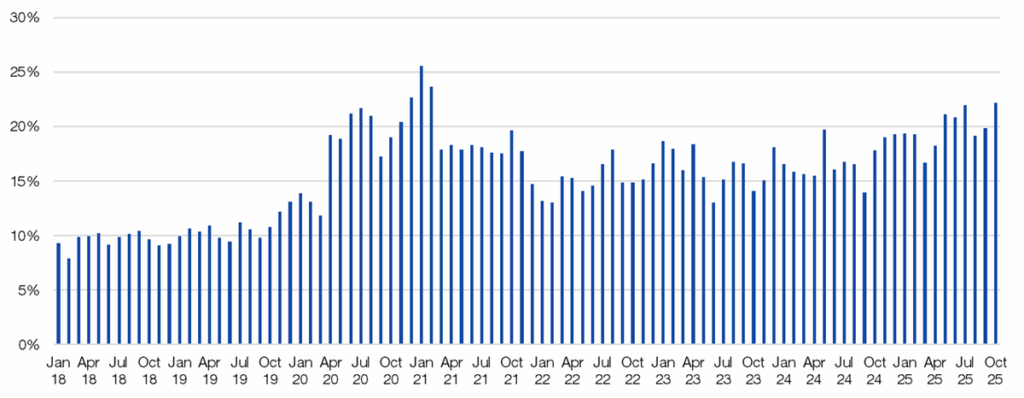
Source: Citadel Securities, as of October 24th, 2025. Figures are for illustrative purposes only. Past performance figures do not guarantee future results.Retail Sub-dollar % of Industry (Shares)
October 2020-October 2025
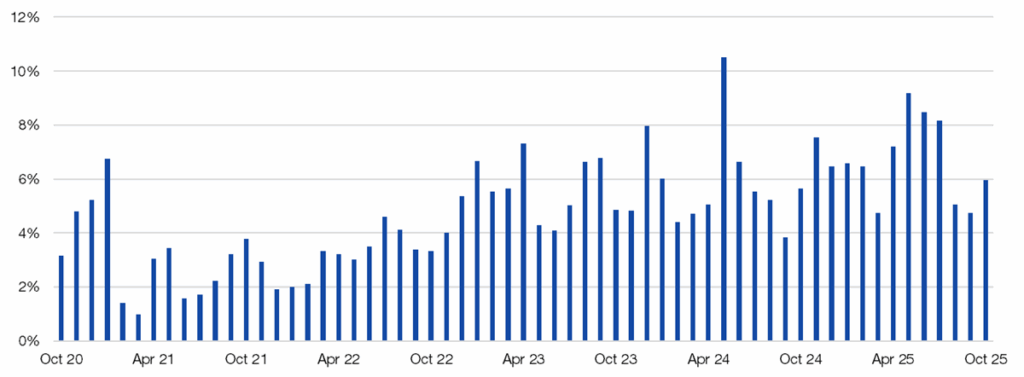
Source: Citadel Securities, as of October 24th, 2025. Figures are for illustrative purposes only. Past performance figures do not guarantee future results.US Daily Market Equity Volume (Shares)
January 2018-October 2025
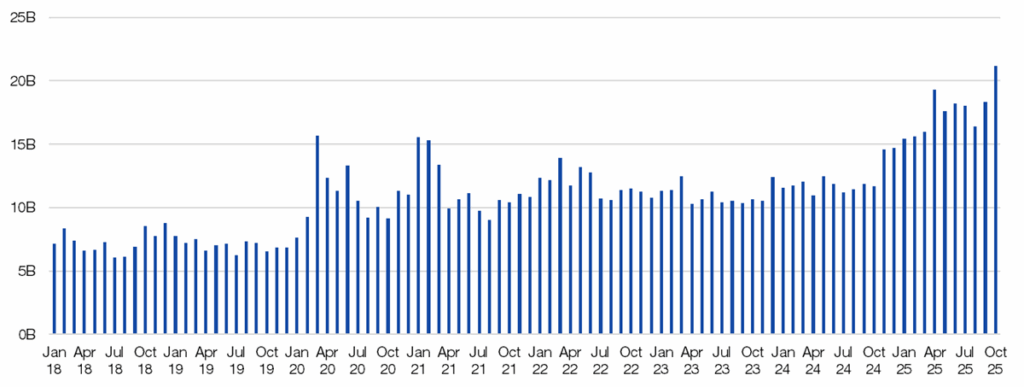
Source: Citadel Securities, as of October 24th, 2025. Figures are for illustrative purposes only. Past performance figures do not guarantee future results.It’s time for a thread. 🧵
I. Client Activity (Citadel Securities)
Takeaway: Retail investors adding to “any weakness” and are the new price setters:
- Retail Equities: Net buyers in 23 of last 27 weeks
- Retail Options: 25-week net buying streak (a record)
- Retail ETFs: ETF buyers in 220 of 222 trading days, 160 straight days
- Institutions: Bearish “macro” longs 9 of last 10 weeks
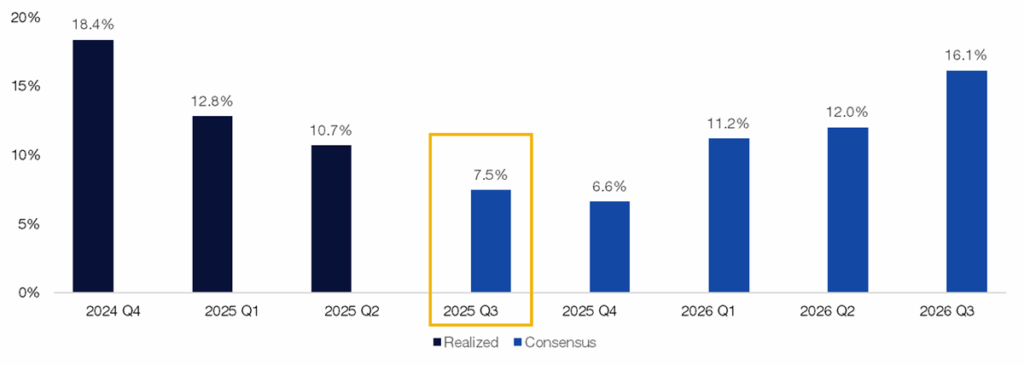
II. S&P Q3 Earnings – Superbowl of Earnings Next Week
Next week >40% of the S&P 500 reports earnings next week: “In Mag7, We Trust”
- MSFT / GOOGL / META report Q3 earnings on Wednesday October 29th post close
- AAPL / AMZN report Q3 earnings on Thursday October 30th post close
Corporate earnings have been very solid so far:
- Q2 recap: Consensus +5% YoY; delivered +11%, with 81% beating estimates
- Q3 setup: Bar is modestly higher; consensus +7.5% YoY
- SPX 3-month implied correlation remains low — a stock pickers’ market
- Options imply ~4.7% earnings-day move — the highest since 2022; Tech tops at ~5.9%
- There is a big spread between Index and Single Stock Skew
SPX EPS (% YoY)
Q4 2024 – Q3 2026
Source: Bloomberg as compiled by Citadel Securities, as of October 24th, 2025. Figures are for illustrative purposes only. Past performance figures do not guarantee future results.SPX 3 Month Implied Correlation moving lower again
January 2024 – October 2025
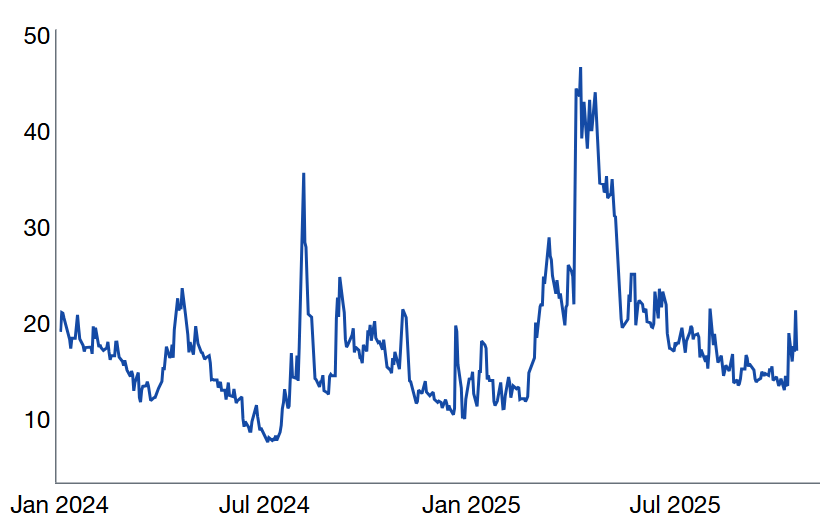
Source: Bloomberg as compiled by Citadel Securities, as of October 24th, 2025. Figures are for illustrative purposes only. Past performance figures do not guarantee future results.III. Year-End Seasonality | Starting October 26
Takeaways from 100 Years of Data:
- October ranks among the choppiest months for equities
- On average, October 26th marks the Q4 low for the S&P 500, while October 27 marks the Q4 low for the Nasdaq 100 (NDX). Happy Halloween 👻 🎃
- Late-October dips typically set up powerful year-end rallies
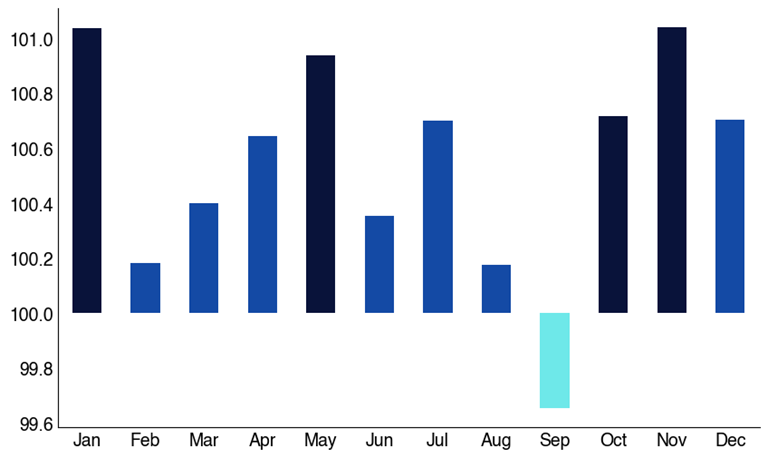
S&P 500 Monthly November Performance by Day
Since 1928
Source: Bloomberg as compiled by Citadel Securities, as of October 24th, 2025. Figures are for illustrative purposes only. Past performance figures do not guarantee future results.S&P 500 Daily Heat Map
Since 1928
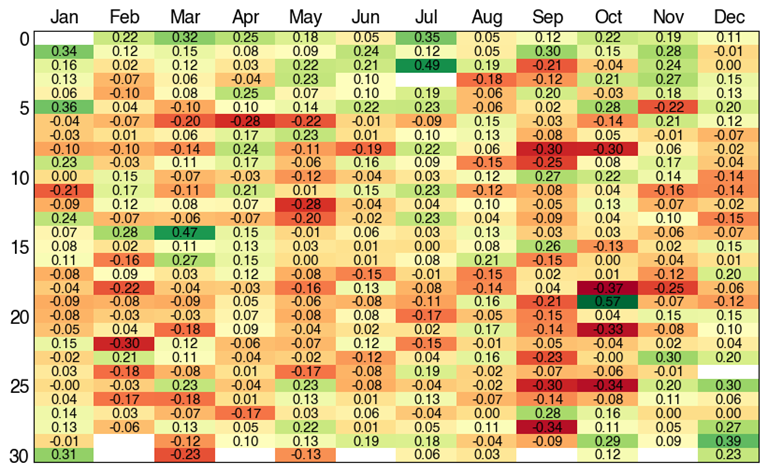
Source: Bloomberg as compiled by Citadel Securities, as of October 24th, 2025. Figures are for illustrative purposes only. Past performance figures do not guarantee future results.S&P 500 Yearly Performance
Since 1928
Source: Bloomberg as compiled by Citadel Securities, as of October 24th, 2025. Figures are for illustrative purposes only. Past performance figures do not guarantee future results.NDX Monthly Performance
Since 1985
Source: Bloomberg as compiled by Citadel Securities, as of October 24th, 2025. Figures are for illustrative purposes only. Past performance figures do not guarantee future results.NDX Daily November Performance
Since 1985
Source: Bloomberg as compiled by Citadel Securities, as of October 24th, 2025. Figures are for illustrative purposes only. Past performance figures do not guarantee future results.IV. Retail Positioning — Persistent Strength
1. Retail Demand: Citadel Securities’ Retail Equities clients: Net buyers in 23 of the last 27 weeks, rebounding after April weakness.
Retail Cash Equities – Net Notional by Week (Std Dev)
January – October 2025
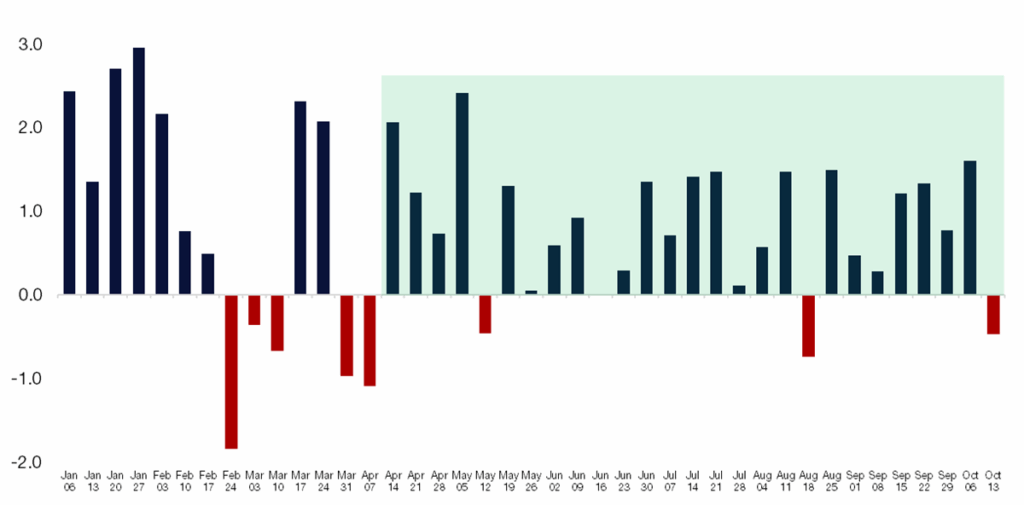
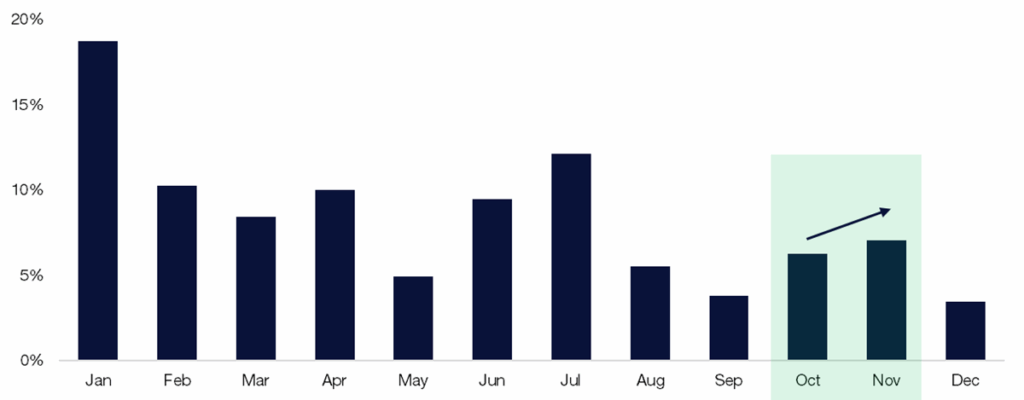
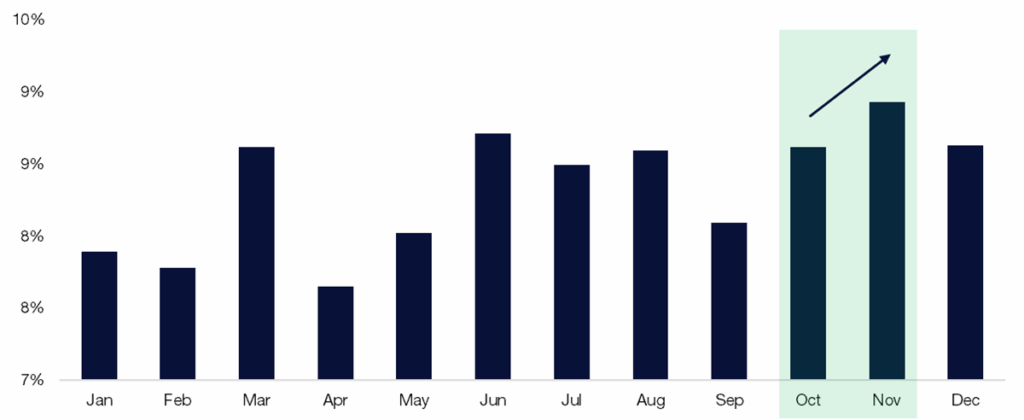
Source: Citadel Securities, as of October 24th, 2025. Figures are for illustrative purposes only. Past performance figures do not guarantee future results.2. Citadel Securities’ Retail Equity client seasonal demand trends from the last 8 years: Sep weakest → Oct builds → Nov strongest
Retail Cash – Proportion of Net Notional by Month
August 1, 2017 – September 29, 2025
Source: Citadel Securities, as of October 24th, 2025. Figures are for illustrative purposes only. Past performance figures do not guarantee future results.V. Volatility & Options Positioning
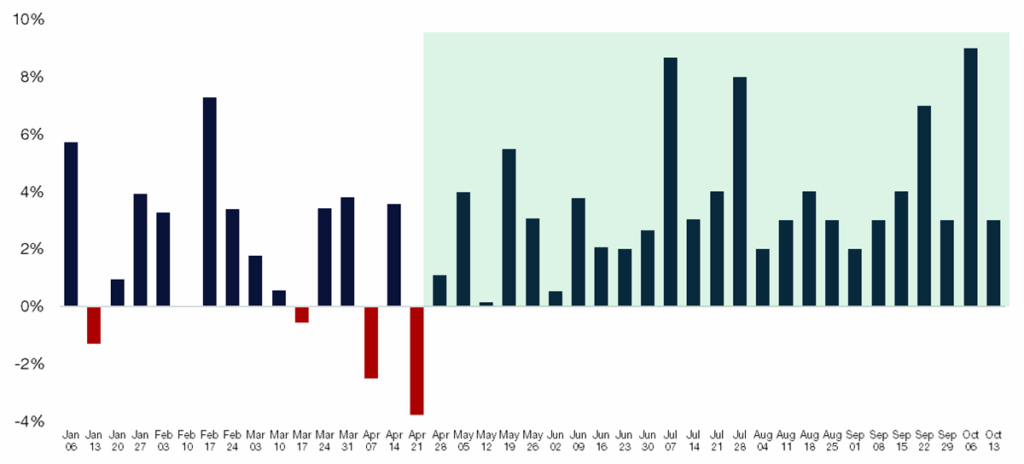
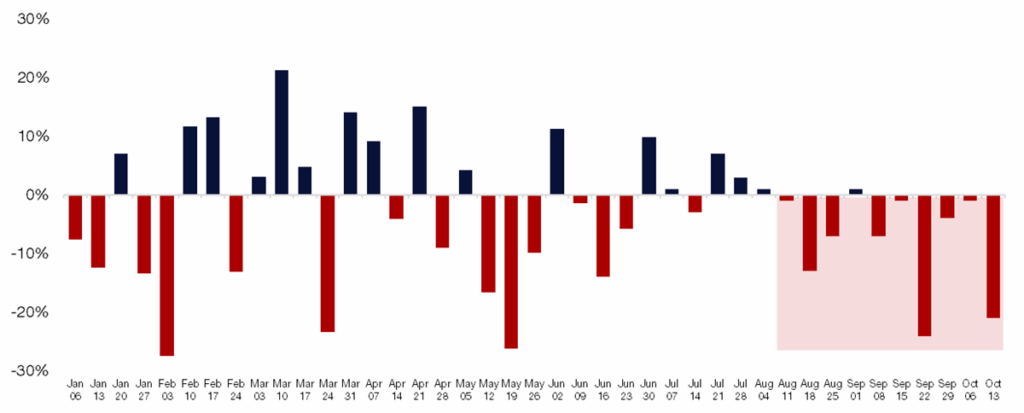
3. Citadel Securities’ Retail Options client bullish streak watch
- Retail options demand: 25 straight weeks (record) 🐂
Retail Options – Call / Put Direction Ratio by Week (%)
January – October 2025
Source: Citadel Securities, as of October 24th, 2025. Figures are for illustrative purposes only. Past performance figures do not guarantee future results.4. Longest Retail Weekly Option Buying Streaks on Record, since 2020.
Starting month, # of weeks
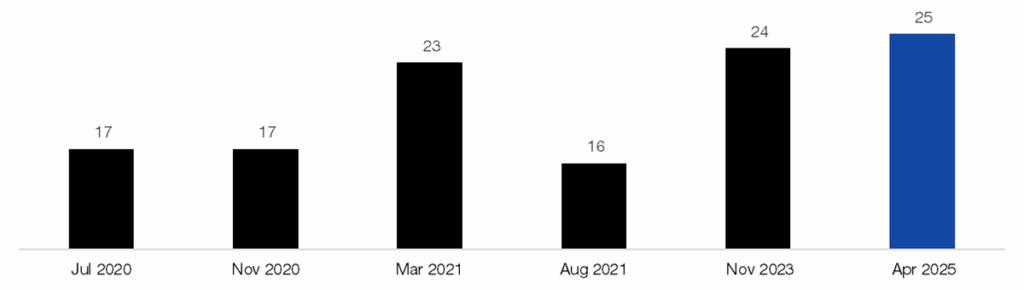
Source: Citadel Securities, as of October 24th, 2025. Figures are for illustrative purposes only. Past performance figures do not guarantee future results.5. Retail Option acceleration in Q4
Citadel Securities’ Retail Options client volume typically wanes in September before rebounding into the final quarter of the calendar year. Activity picks back up in Q4, with November the strongest month of the year.
Retail Options – Proportion of Contract Volume by Month
January 2020 – December 2024
Source: Citadel Securities, as of October 24th, 2025. Figures are for illustrative purposes only. Past performance figures do not guarantee future results.6. Citadel Securities’ Institutional Options clients turned to hedging demand
- Bearish in 9 of the last 10 weeks
- Implied volatility has reset lower – hedges are attractive while staying in long positions
- FOMU – “fear of material underperformance” to benchmark indices has accelerated and kept longs in play given consecutive moves in the largest cap equities
Institutional Options — Call/Put Direction Ratio by Week (Bearish Flows)
January – October 2025
Source: Citadel Securities, as of October 24th, 2025. Figures are for illustrative purposes only. Past performance figures do not guarantee future results.VI. Corporates Return Next Week
- Open window starts next week. Blackout typically begins ~2 weeks before quarter-end and ends a day or two after Q3 earnings. August saw strong executions during the open window.
- EventVestor: U.S. authorizations have surpassed $1.3T (fastest pace on record) for Russell 3000; could reach $1.5T by year-end. Assuming a 90% execution rate means $1.35T actual executions (a record). S&P 500 companies have seen $1T authorizations YTD. Keep an eye on this dynamic after reported Q3 results.
- Buyback math: ~$1.35T of VWAP executions over 251 trading days ≈ $5.3B of implied daily buyback demand.
- Nov–Dec are historically the strongest buyback execution months for U.S. corporates. I expect corporates to fill their authorizations by end of 2025.
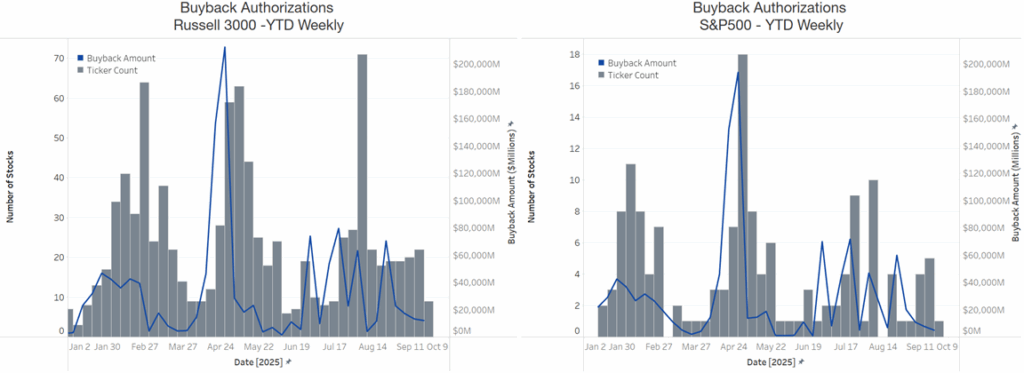
Source: EventVestor as compiled by Citadel Securities, as of September 29th, 2025. Figures are for illustrative purposes only. Past performance figures do not guarantee future results.VII. Systematic Positioning — Recovering and now adding?
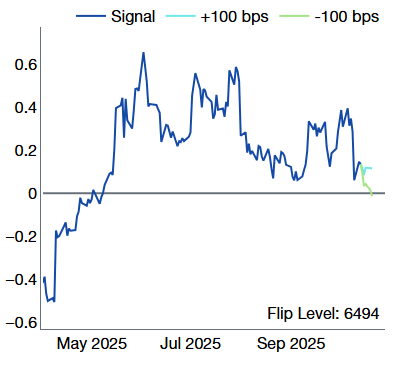
7. CTA/Trend following and Trigger Levels
Citadel Securities’ estimates that equity trend signals are getting weaker from here (+.4 to .+15 and now +.25) z-scores, suggesting orderly reduction in exposure to slightly long in medium term strategies.
US Equity CTA Signals (Z-score)
January 2024 – Sep 2025
Source: Citadel Securities, as of October 24th, 2025. Figures are for illustrative purposes only. Past performance figures do not guarantee future results.Trigger / Threshold Levels did NOT trigger.
We are watching 6494 as the big medium term threshold level which flips CTAs from long to short. We have distance from this level now.
US Equity CTA Signals (Z-score)
January 2024 – Sep 2025
Source: Citadel Securities, as of October 24th, 2025. Figures are for illustrative purposes only. Past performance figures do not guarantee future results.
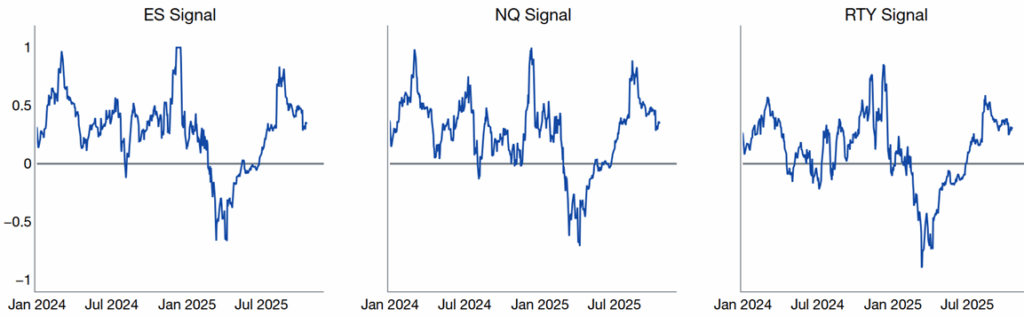
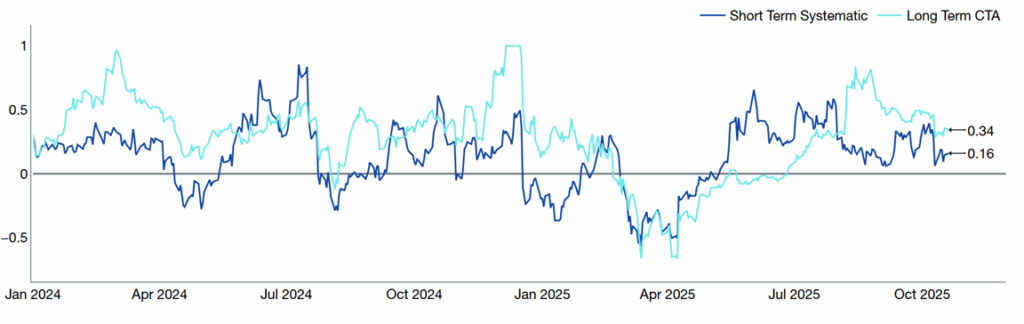
8. Systematic Thresholds in SPX- Short-term threshold signal continues to improve after becoming close to breaching key levels.
- Long-term threshold signal is back at neutral – this is a big signal, holding for now.
CTA ES1: Short-term and long-term signals (z-score)
January 2024 – October 2025
Source: Citadel Securities, as of October 24th, 2025. Figures are for illustrative purposes only. Past performance figures do not guarantee future results.
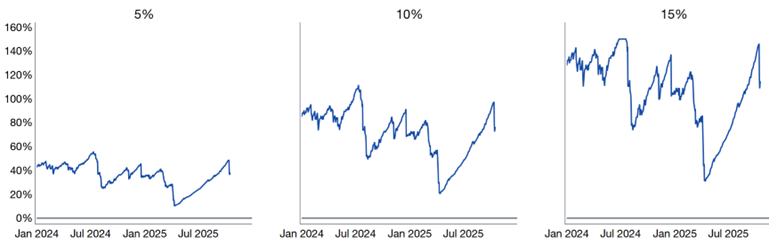
9. Vol-Control strategies – Significant Reduction in Equity Exposure during the Friday Vol-Shock
Theme Watch: There was a substantial reduction in exposure given outperformance of volatility. This cohort substantially reduced exposure in a short period and have paused further selling from here. Exposure has started to increase.Vol Target Exposure with 5%, 10%, 15%, Risk Control
Exposure Rank since 2020
Source: Bloomberg as compiled by Citadel Securities, as of October 24th, 2025. Figures are for illustrative purposes only. Past performance figures do not guarantee future results.VIX Monthly Performance
Since 1990
Source: Bloomberg as compiled by Citadel Securities, as of October 24th, 2025. Figures are for illustrative purposes only. Past performance figures do not guarantee future results.
10. Risk Parity strategies have also de-levered equities.
Risk Parity Allocation Change WoW: (-ES, +TY, +CL, -GC)Risk Parity strategies are driven by lower cross-asset volatility. Systematic positioning in equities has declined in the past two weeks.
Risk Parity Exposure
Jan 2022 – October 2025
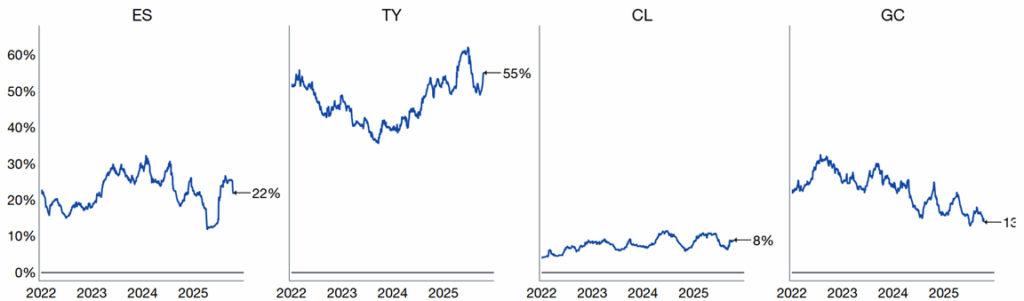
Source: Citadel Securities, as of October 24th, 2025. Figures are for illustrative purposes only. Past performance figures do not guarantee future results.
11. Sentiment remains broadly negative:
AAII Bull – AAII Bear Spread, saw another large decline this week.
January 2024 – October 2025
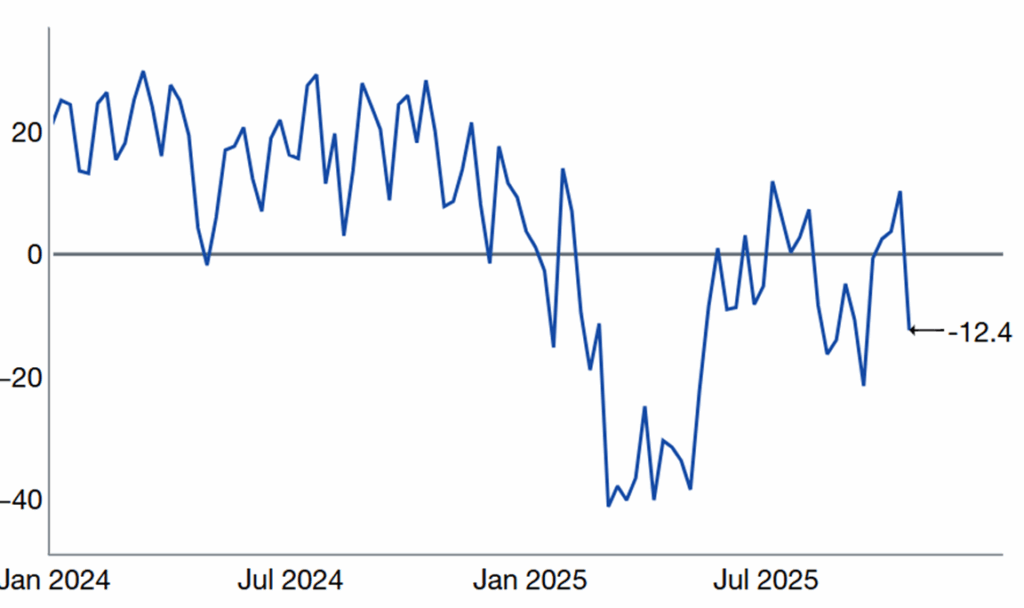
Source: AAII, as reported by Bloomberg and compiled by Citadel Securities, as of October 24th, 2025. Figures are for illustrative purposes only. Past performance figures do not guarantee future results.GMI Bottom Line: Supply and Demand Mismatch
A clear supply–demand imbalance persists in equities, with buyers positioned higher and underlying demand still intact.
In the near term, investors should use the options market to navigate headline risk and manage short-term volatility. Next week’s earnings from the largest global tech companies will be pivotal — stronger results could catalyze institutional re-engagement after a period of caution.
Meanwhile, financial conditions remain accommodative, and the global growth trajectory points toward recovery into 2026.
Copyright © Citadel Enterprise Americas LLC or one of its affiliates. All rights reserved.
Legal Entities Disseminating this Material: This material is disseminated in the United Kingdom by Citadel Securities (Europe) Limited (“CDGE”) authorized and regulated by the Financial Conduct Authority (“FCA”) (Registered company number: 05462867); in the European Union by Citadel Securities GCS (Ireland) Limited (“CSGI”) and its Paris Branch authorized and regulated by the Central Bank of Ireland (“CBI”) (Registration Number: C173437); in Hong Kong by Citadel Securities (Hong Kong) Limited (“CDHK”) licensed by the Securities and Futures Commission of Hong Kong (“SFC”), in Japan by Citadel Securities Japan Co., Ltd (“CSJC”) registered as a Type 1 financial instruments business operator with the Japan Financial Services Agency (“JFSA”); and in the United States of America by Citadel Securities LLC (“CDRG”) registered with the Securities Exchange Commission (“SEC”), Financial Industry Regulatory Authority (“FINRA”), and Securities Investor Protection Corporation (“SIPC”), Citadel Securities Institutional LLC (“CSIN”) registered with the SEC, FINRA, and SIPC, or Citadel Securities Swap Dealer LLC (“CSSD”) registered with the SEC, Commodities Futures Trading Commission (“CFTC”), and National Futures Association (“NFA”). Unless governing law permits otherwise, you must contact a Citadel Securities entity in your home jurisdiction if you want to use our services in effecting a transaction in any financial instruments or securities, including derivatives.
FOR INSTITUTIONAL USE ONLY; FOR PROFESSIONAL CLIENTS AND ELIGIBLE COUNTERPARTIES ONLY. This material is not intended as and does not constitute investment research. Contents of this material will be strictly limited to non-specific, generic information (i.e. macro events/topics) and are not subject to the Markets in Financial Instruments directive (MiFID II) or FINRA research rules. This material does not constitute an offer, solicitation, invitation, or inducement to purchase, acquire, subscribe to, provide, or sell any financial instrument or otherwise engage in investment activity. Please see additional important disclosures, including disclosures that may be relevant to your country of residence or business at www.citadelsecurities.com/GlobalSalesTrading.
Explore
Market Insights - What We Do