-
Who We Are
- What We Do
Series: Global Market Intelligence“What’s the RUB?”
By Scott Rubner
Equities sit at a pivotal inflection point, with competing forces in play. The macro hinge remains the inflation–Fed easing trajectory: stabilization enables policy support, while persistence forces repricing. Execution on AI and Q3 earnings is equally critical — mega-cap leaders must deliver against high expectations to sustain stretched multiples. Geopolitical and trade frictions, plus shutdown risk, linger as exogenous shocks. Market breadth remains the key tell: broadening supports durability, while Mag7 concentration signals fragility.
I’ve been fielding repeated client questions this weekend on the bull vs. bear setup. My stance: constructive into year-end, with technical headwinds fading and a rally base forming.
Framework: Client activity through positioning and flows.
Bull Case
- Technology & AI: Structural productivity gains as leaders execute.
- Fed Support: Stable inflation preserves optionality for rate cuts, supportive for risk assets.
- Economic Resilience: Healthy consumer and corporate balance sheets contain little recession risk.
- Discretionary Positioning & Neutral Sentiment: Cooling post-euphoria creates runway for Q4 upside.
- Global Growth: Forward estimates re-accelerating, tilt toward cyclicals.
- Consumer Balance Sheets: Household equity exposure up +542% since 2020 provides incremental demand.
Value of Equities Held by bottom 50% of Household net worth
1990-2025, $billions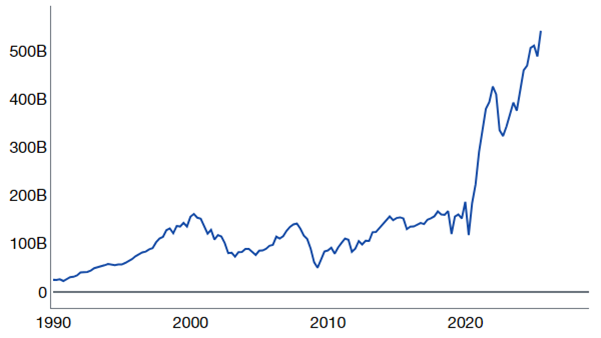
Source: Federal Reserve as compiled by Citadel Securities, as of September 29th, 2025. Figures are for illustrative purposes only. Past performance figures do not guarantee future results.
Bear Case
- Valuations: Tech/AI multiples risk bubble dynamics.
- Earnings Bar: High expectations, particularly in mega-cap tech, create risk of disappointment.
- Macro Headwinds: Inflation, tariffs, and trade frictions threaten Fed easing; Oct. 15 CPI is a pivot risk.
- Breadth: ~$0.35 of every SPY $ goes into Mag7; concentration heightens factor fragility.
- Complacency: Momentum dominance + crowded positioning raise shock risk.
It is time for a thread.

I. Client Activity (Citadel Securities)
- Retail Equities: Net buyers in 21 of the last 24 weeks; we had one of our largest buy skew this week since May 5th (increasing demand into any equity weakness).
- Retail Options: 22-week net buying streak; this week was the 2nd most bullish week of 2025
- Retail ETFs: ETF buyers in 183 of 185 trading days YTD
- Institutions: Hedging “macro” longs 5 of last 6 weeks (with latest hedges tied to shutdown and jobs report)
Takeaway: Retail buys micro ‘storybook’ names. Institutions hedge macro but stay benchmark long.
II. S&P Q3 Earnings Setup — Bar Is High
Q3 earnings season begins the week of October 13, led by major banks.
- Q2 recap: Consensus +5% YoY; delivered +11%, 81% beat estimates
- Q3 setup: The bar is higher, particularly in IT; results must prove exceptional, not just strong.
- Consensus forecasts: S&P 500 +18.7% YoY; Information Technology +30.0% YoY
SPX EPS (% YoY)
Q1 2024 – Q4 2026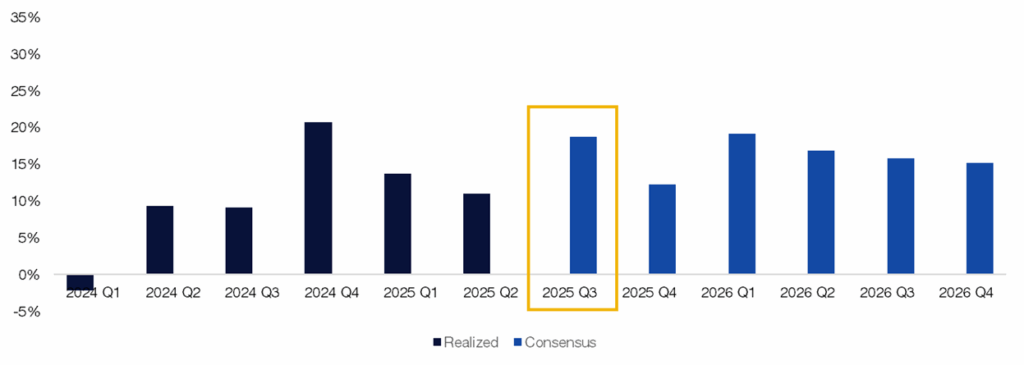
Source: Bloomberg as compiled by Citadel Securities, as of September 29th, 2025. Figures are for illustrative purposes only. Past performance figures do not guarantee future results.
Information Technology Earnings (% YoY)
Q1 2024 – Q4 2026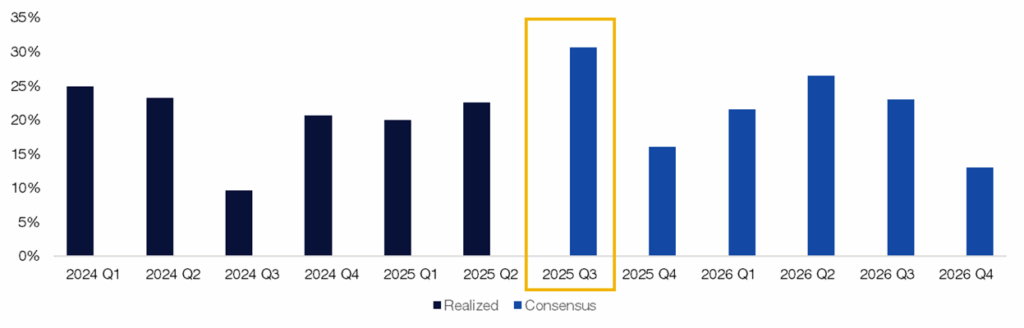
Source: Bloomberg as compiled by Citadel Securities, as of September 29th, 2025. Figures are for illustrative purposes only. Past performance figures do not guarantee future results.
III. Year-End Seasonality (starting October 26)
October Seasonality: Key Takeaways (100-year perspective)
- Over 100 years of data, October ranks among the choppiest months for equities.
- On average, October 26th marks the Q4 low for the S&P 500, while October 27 marks the Q4 low for the Nasdaq 100.
- Late-October dips typically precede the strongest trading stretch of the year.
S&P 500 Monthly Performance by Day
Since 1928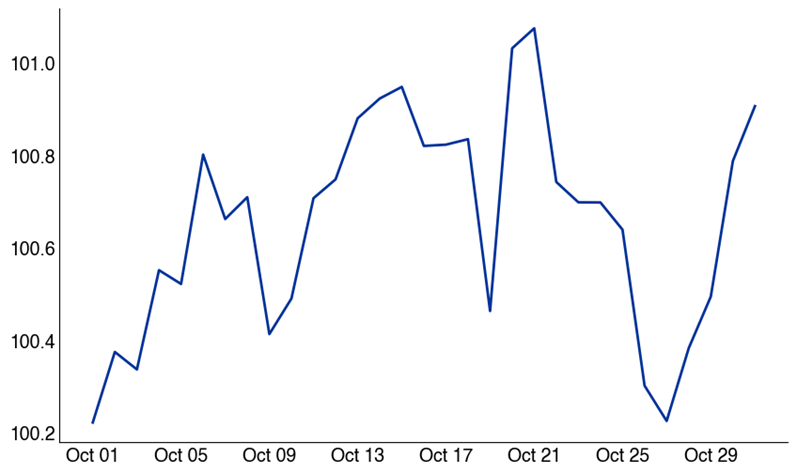
Source: Bloomberg as compiled by Citadel Securities, as of September 29th, 2025. Figures are for illustrative purposes only. Past performance figures do not guarantee future results.
S&P 500 Yearly Performance
Since 1928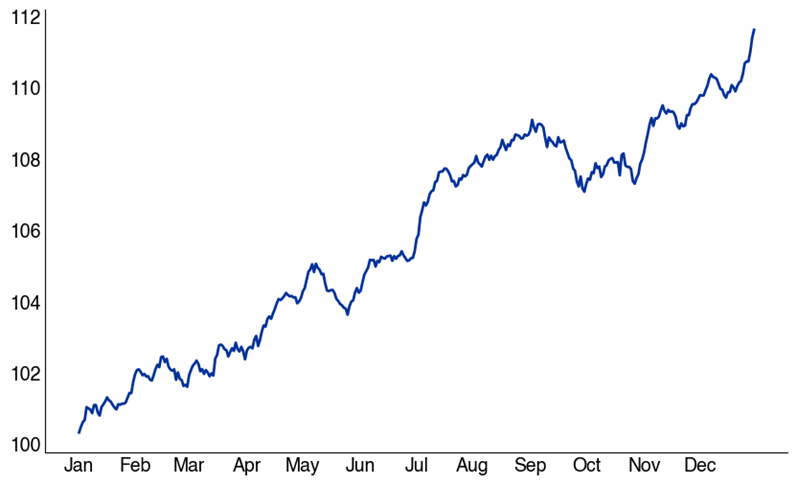
Source: Bloomberg as compiled by Citadel Securities, as of September 29th, 2025. Figures are for illustrative purposes only. Past performance figures do not guarantee future results.NDX Monthly Performance by Day
Since 1985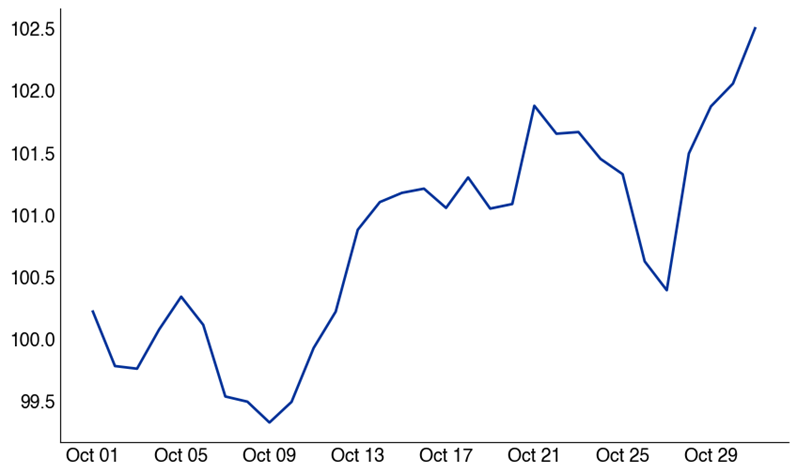
Source: Bloomberg as compiled by Citadel Securities, as of September 29th, 2025. Figures are for illustrative purposes only. Past performance figures do not guarantee future results.NDX Yearly Performance
Since 1985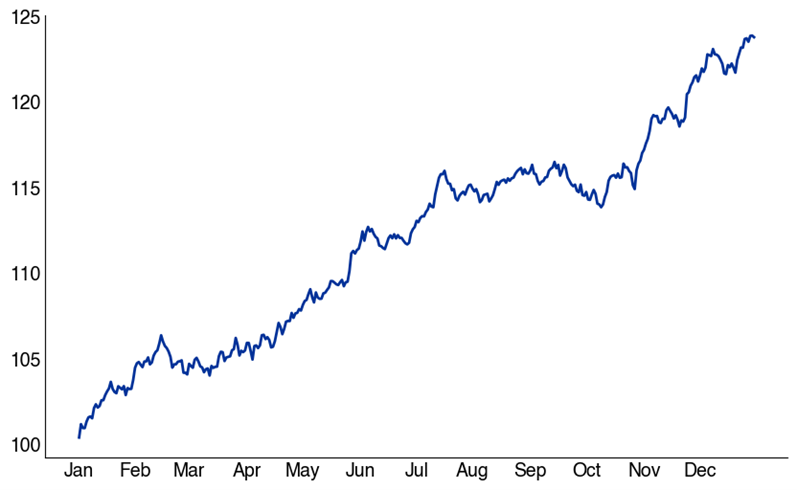
Source: Bloomberg as compiled by Citadel Securities, as of September 29th, 2025. Figures are for illustrative purposes only. Past performance figures do not guarantee future results.IV. Retail Positioning – Persistent Strength
1. Retail Demand
Citadel Securities’ Retail Equities clients: Net buyers in 21 of the last 24 weeks, rebounding after April weakness
Retail Cash Equities – Net Notional by Week (Std Dev)
January – September 2025
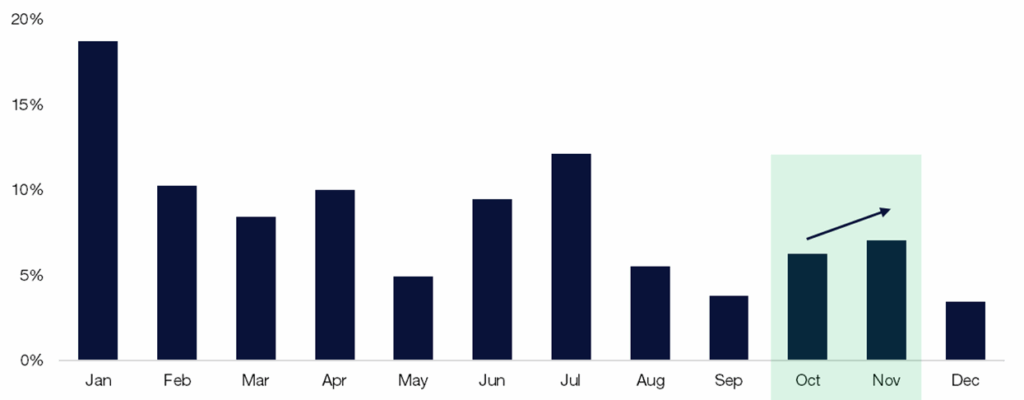
Source: Citadel Securities, as of September 29th, 2025. Figures are for illustrative purposes only. Past performance figures do not guarantee future results.2. Citadel Securities’ Retail Equity client seasonal demand trends from the last 8 years: Sep weakest → Oct builds → Nov strongest
Retail Cash – Proportion of Net Notional By Month
August 1, 2017 – September 29, 2025
Source: Citadel Securities, as of September 29th, 2025. Figures are for illustrative purposes only. Past performance figures do not guarantee future results.3. Leverage
Funding spreads rising sharply suggest increased leverage — not yet concerning, but worth monitoring.
Funding vs. SPX
September 2020 – September 2025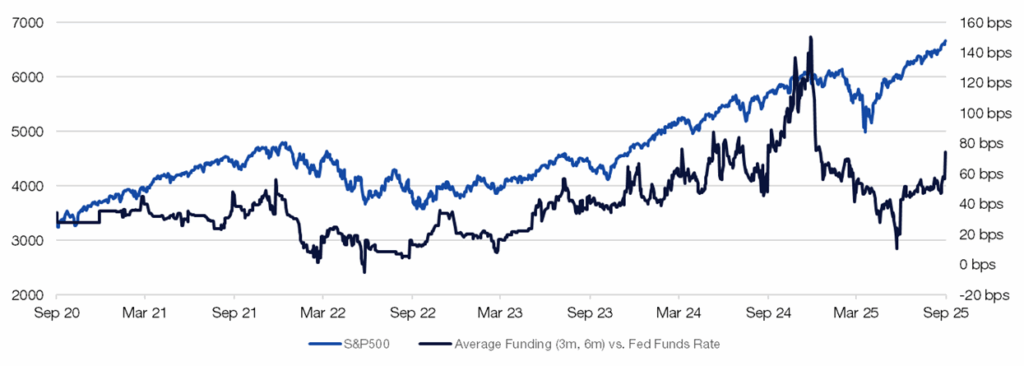
Source: Citadel Securities, as of September 29th, 2025. Figures are for illustrative purposes only. Past performance figures do not guarantee future results.
4. Liquidity
The ability to transfer risk quickly, as measured by liquidity in the SPX futures remain very healthy. S&P 500 E-mini top book still strong = $20M (vs. $3M during April lows).
S&P 500 E-mini Top of Book Depth
September 2023 – September 2025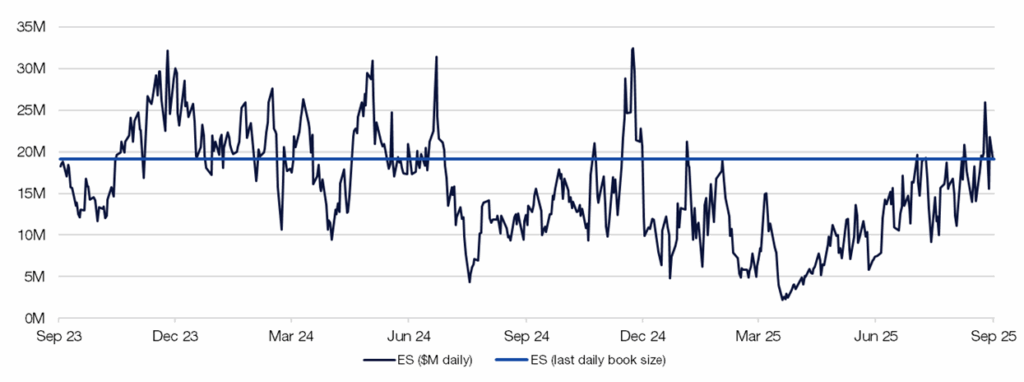
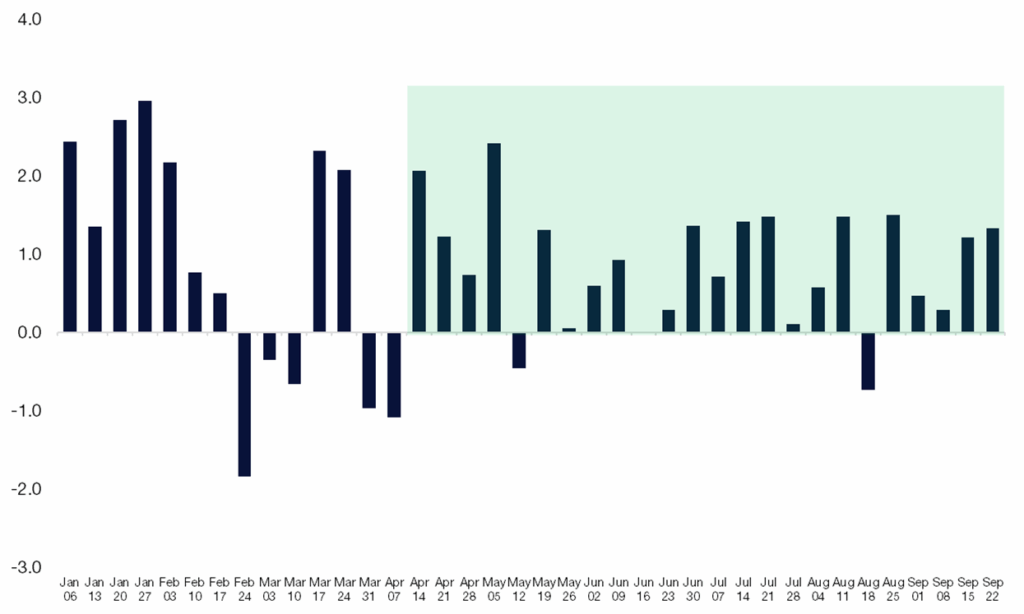
Source: Citadel Securities, as of September 29th, 2025. Figures are for illustrative purposes only. Past performance figures do not guarantee future results.V. Volatility and Options Positioning
5. Citadel Securities’ Retail Options client bullish streak watch
- Retail options demand: 22 straight weeks; last week was the 2nd-most bullish week of 2025
- This exceeds the longest streaks on record since 2020
Retail Options – Call / Put Direction Ratio by Week (%)
January – September 2025
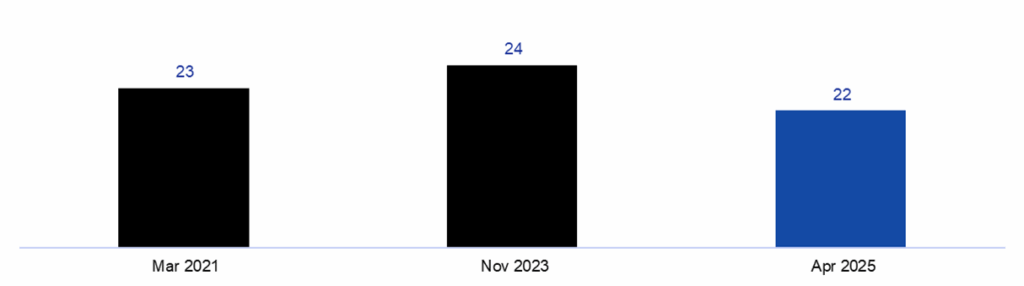
Source: Citadel Securities, as of September 29th, 2025. Figures are for illustrative purposes only. Past performance figures do not guarantee future results.6. Longest Retail Weekly Option Buying Streaks on Record, since 2020.
Starting month, # of weeks
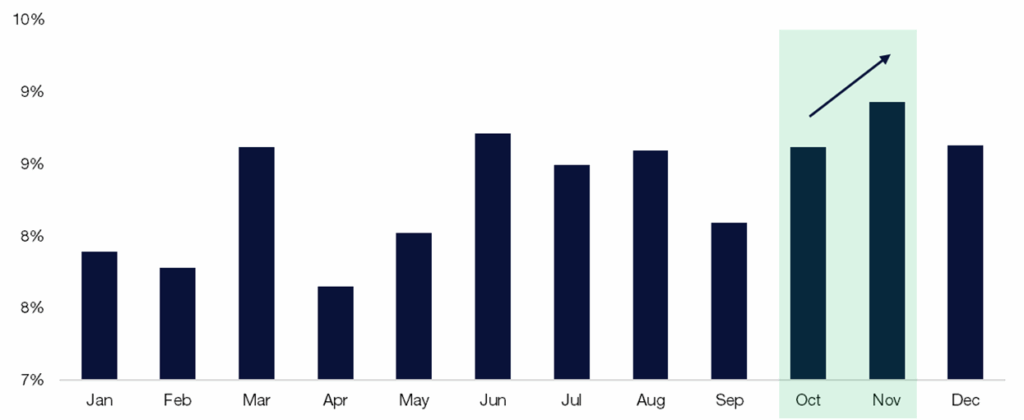
Source: Citadel Securities, as of September 29th, 2025. Figures are for illustrative purposes only. Past performance figures do not guarantee future results.7. Retail Option acceleration in Q4
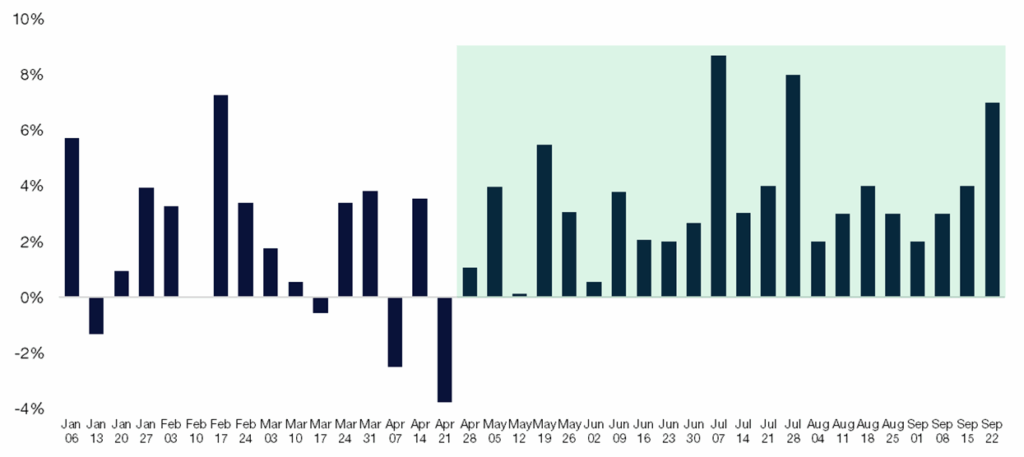
Citadel Securities’ Retail Options client volume typically rebounds into the final quarter of the calendar year. Activity picks back up in Q4, with November the strongest month of the year.
Retail Options – Proportion of Contract Volume by Month
January 2020 – December 2024
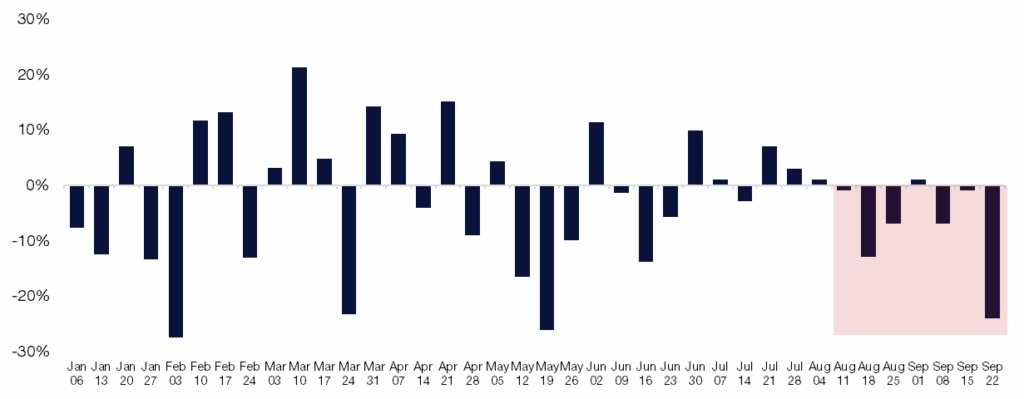
Source: Citadel Securities, as of September 29th, 2025. Figures are for illustrative purposes only. Past performance figures do not guarantee future results.8. Citadel Securities’ Institutional Options clients turned to hedging demand
- Bearish in 5 of the last 6 weeks
- Implied volatility has reset lower – hedges are attractive while staying in long positions
- FOMU – “fear of material underperformance” to benchmark indices has accelerated and kept longs in play given consecutive moves in the largest cap equities
Institutional Options –Call/Put Direction Ratio by Week (Bearish Flows)
January – September 2025
 s.
s.
Source: Citadel Securities, as of September 29th, 2025. Figures are for illustrative purposes only. Past performance figures do not guarantee future resultVI. Corporate Demand — On Pause
- Buyback blackout window started last week. Blackout typically begins ~2 weeks before quarter-end and ends a day or two after Q3 earnings.
- EventVestor: U.S. authorizations have surpassed $1.3T (fastest pace on record) for Russell 3000; could reach $1.5T by year-end. Assuming a 90% execution rate means $1.35T actual executions (a record). S&P 500 companies have seen $1T authorizations YTD. 139 S&P 500 companies announced a buyback authorization in 2025.
- Buyback math: ~$1.35T of VWAP executions over 251 trading days ≈ $5.3B of implied daily buyback demand.
- Nov–Dec are historically the strongest buyback execution months for U.S. corporates.
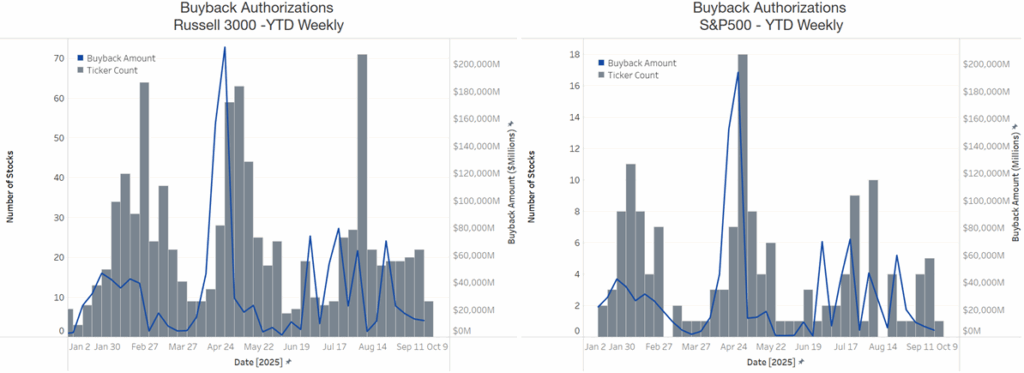
Source: EventVestor as compiled by Citadel Securities, as of September 29th, 2025. Figures are for illustrative purposes only. Past performance figures do not guarantee future results.VII. Volatility Dynamics – Equity vol is no longer heading lower
- Hedge funds / large specs extremely short VIX
- Takeaway: Crowded short volatility trade = asymmetric risk if shocks emerge
CFTC VIX Consolidated % Long
January 2022 – Sep 2025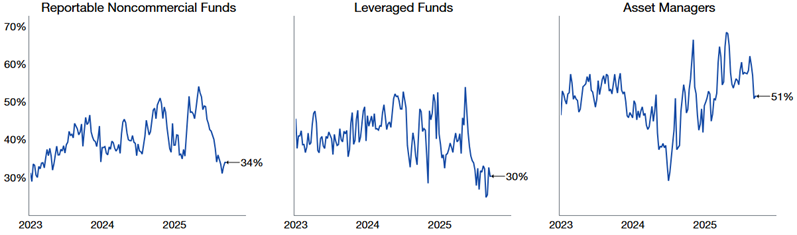
Source: COT report, as compiled by Citadel Securities, as of September 29th, 2025. Figures are for illustrative purposes only. Past performance figures do not guarantee future results.VIII. Systematic Positioning — Full but Fragile
9. CTA/Trend following
Citadel Securities’ Macro Strategy team estimates that equity trend signals are getting weaker from here, given elevated exposure.
US Equity CTA Signals
January 2024 – Sep 2025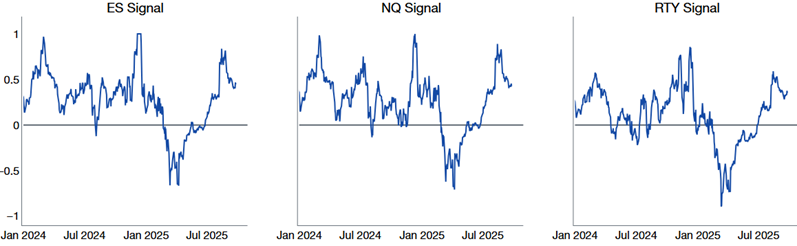
Source: Citadel Securities, as of September 29th, 2025. Figures are for illustrative purposes only. Past performance figures do not guarantee future results.10. Systematic Thresholds in SPX
- Short-term threshold signal continues to weaken
- Long-term threshold signal is back at neutral
CTA ES1: Short-term and long-term signals
January 2024 – September 2025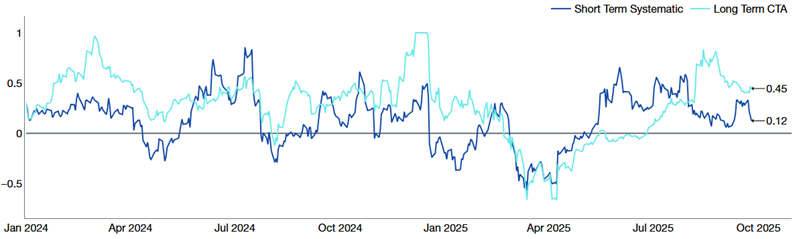
Source: Citadel Securities, as of September 29th, 2025. Figures are for illustrative purposes only. Past performance figures do not guarantee future results.11. Vol-Control strategies
Vol Control strategies which take cues from the realized volatility market – have already increased exposure substantially. This is one of the sharpest rebounds in equity exposure we’ve seen.
No incremental demand from Vol-Control given the recent increase in volatility.
Vol Target Exposure with 5%, 10%, 15%, Risk Control
Exposure Rank since 2020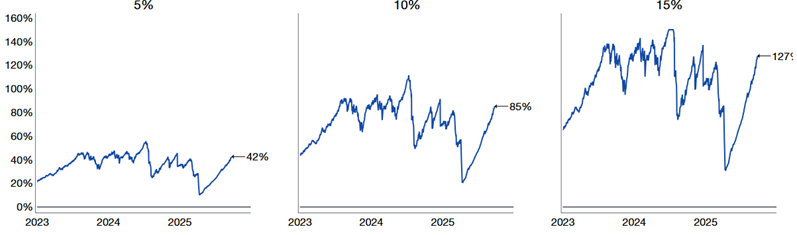
Source: Bloomberg as compiled by Citadel Securities, as of September 29th, 2025. Figures are for illustrative purposes only. Past performance figures do not guarantee future results.12. Risk Parity strategies
Risk Parity strategies are driven by lower cross-asset volatility – now hold equity exposure near their 3-year average of 25% exposure.
Systematic positioning remains elevated, but no unwind trigger. Positioning is fragile: shallow pullbacks risk turning into larger drawdowns. MOVE (FI vol) hit the lowest level since 2022 this week.
Risk Parity Exposure
Jan 2022 – Sep 2025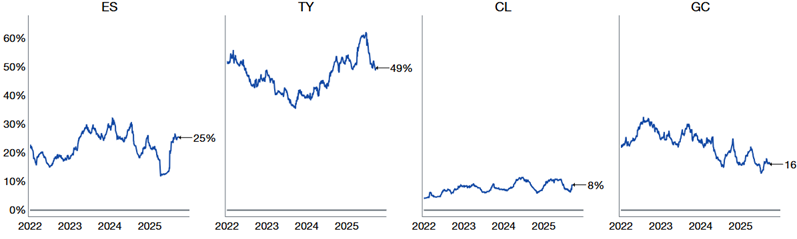
Source: Citadel Securities, as of September 29th, 2025. Figures are for illustrative purposes only. Past performance figures do not guarantee future results.13. Sentiment and Asset Allocations:
AAII Equity Asset Allocation (%)
January 2022 – September 2025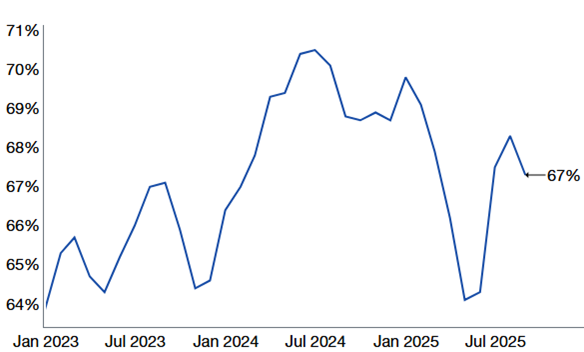
Source: AAII, as reported by Bloomberg and compiled by Citadel Securities, as of September 29th, 2025. Figures are for illustrative purposes only. Past performance figures do not guarantee future results.AAII Bull – AAII Bear Spread, saw a rebound this week, but remains in neutral territory.
January 2022 – September 2025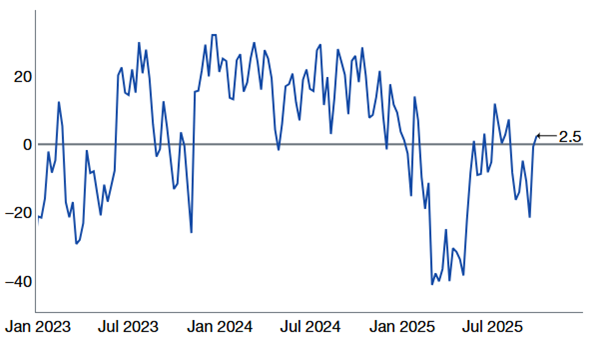
Source: AAII, as reported by Bloomberg and compiled by Citadel Securities, as of September 29th, 2025. Figures are for illustrative purposes only. Past performance figures do not guarantee future results.Takeaway: If markets slip, systematic flows could exacerbate drawdowns.
GMI | October Takeaways ✅
📌Theme: Structural Bull, 1H October Tactical Worry
- Structural Bull: Retail demand accelerating, buybacks resuming, passive flows, AI supportive.
- Tactical Risk: October fragility; hedge crowded names into earnings.
- Forward View: Year-end FOMO rally likely; treat 2H October dips as buy opportunities.
- Rotation: Watch lagging sectors (Energy, Value, International) as catch-up trades.
Copyright © Citadel Enterprise Americas LLC or one of its affiliates. All rights reserved.
Legal Entities Disseminating this Material: This material is disseminated in the United Kingdom by Citadel Securities (Europe) Limited (“CDGE”) authorized and regulated by the Financial Conduct Authority (“FCA”) (Registered company number: 05462867); in the European Union by Citadel Securities GCS (Ireland) Limited (“CSGI”) and its Paris Branch authorized and regulated by the Central Bank of Ireland (“CBI”) (Registration Number: C173437); in Hong Kong by Citadel Securities (Hong Kong) Limited (“CDHK”) licensed by the Securities and Futures Commission of Hong Kong (“SFC”), in Japan by Citadel Securities Japan Co., Ltd (“CSJC”) registered as a Type 1 financial instruments business operator with the Japan Financial Services Agency (“JFSA”); and in the United States of America by Citadel Securities LLC (“CDRG”) registered with the Securities Exchange Commission (“SEC”), Financial Industry Regulatory Authority (“FINRA”), and Securities Investor Protection Corporation (“SIPC”), Citadel Securities Institutional LLC (“CSIN”) registered with the SEC, FINRA, and SIPC, or Citadel Securities Swap Dealer LLC (“CSSD”) registered with the SEC, Commodities Futures Trading Commission (“CFTC”), and National Futures Association (“NFA”). Unless governing law permits otherwise, you must contact a Citadel Securities entity in your home jurisdiction if you want to use our services in effecting a transaction in any financial instruments or securities, including derivatives.
FOR INSTITUTIONAL USE ONLY; FOR PROFESSIONAL CLIENTS AND ELIGIBLE COUNTERPARTIES ONLY. This material is not intended as and does not constitute investment research. Contents of this material will be strictly limited to non-specific, generic information (i.e. macro events/topics) and are not subject to the Markets in Financial Instruments directive (MiFID II) or FINRA research rules. This material does not constitute an offer, solicitation, invitation, or inducement to purchase, acquire, subscribe to, provide, or sell any financial instrument or otherwise engage in investment activity. Please see additional important disclosures, including disclosures that may be relevant to your country of residence or business at www.citadelsecurities.com/GlobalSalesTrading.
Explore
Market Insights - What We Do