By Scott Rubner
As I share my ninth note, I remain grateful to be part of this world-class ecosystem. In these early months, I’ve reflected on the unique insights that stem from Citadel Securities’ #1 position in equity flows — spanning on-exchange market making, retail activity, and direct institutional coverage.
Thank you to those who have already shared perspectives. I welcome your feedback on what else you’d find valuable as I continue to learn, grow, and build.
On the Road: Market Sentiment Balanced but Fragile
Recent global client conversations highlight optimism offset by caution:
- Bullish case: AI-driven CapEx, liquidity tailwinds, resilient consumer, and a supportive Fed backdrop (soft landing still in play).
- Bearish case: Stretched valuations (22x fwd P/E), late-cycle credit fragility, stagflation risks, and priced-in rate-cut optimism.
- Takeaway: Stay constructive on structural demand but hedge near-term risks. September–October remains a vulnerable window.
Citadel Securities Flow Insights
Our flow data show both risk-taking (“Sword”) and protection (“Shield”):
- Sword: Fed-cut rotation into highly shorted names and anti-momentum call options.
- Shield: Record ETF and passive inflows (~40% of S&P 500 now concentrated in the top 10).
- Takeaway: Maintain exposure to structural flows (passive, buybacks, retail) but hedge against rotation shocks.
These crosscurrents in sentiment and flows point to a market already on edge – and the stakes are rising for how quickly momentum could swing.
It is time for a thread.

I. Bulls vs. Bears – Who Looks More Convincing?
What the Bulls are saying:
- AI CapEx boom as durable growth driver
- Resilient consumer supports soft-landing hopes
- Cooling inflation keeps Fed cuts live
- Capital return (buybacks/M&A/deregulation) as structural support
- Stocks ≠ economy: strength can persist
- Growth rebound + liquidity sensitivity in 1H26
What the Bears are saying:
- Valuations stretched at 22x forward earnings
- Credit risks rising, stagflation narrative
- Late-cycle: softer jobs, sticky inflation
- Peak dovishness: rate-cut optimism priced in → “sell the news” risk
- Global yields pressured by fiscal imbalances
- Weak data is being treated as bad news again (no longer triggers easing optimism)
II. Client Activity (Citadel Securities)
Our client activity remains strong, even at all-time equity market highs (SPX/NDX).
- Retail Equities: Net buyers 19/22 weeks
- Retail Options: 20-week net buying streak
- Institutions: Hedging longs in 4/5 weeks
- Takeaway: Retail buys the micro, Institutions hedge the macro
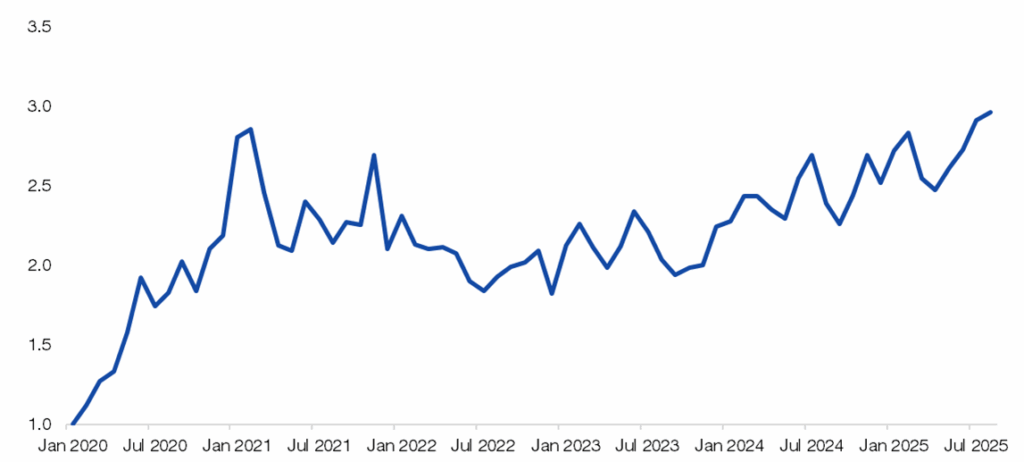
III. Stock-Picker’s Market Emerging
👉Low implied correlation signals a market where fundamentals matter more than macro—supportive for alpha from security selection.
- Typical late-cycle pattern, focus on earnings
- “Alpha > Beta; 490 > 10”
- Active > Passive
- Takeway: Investors want breadth expansion in Q4
SPX 3-Month Implied Correlation
Jan 2023 – Sep 2025
Source: Bloomberg as compiled by Citadel Securities, as of September 16th, 2025. Figures are for illustrative purposes only. Past performance figures do not guarantee future results.
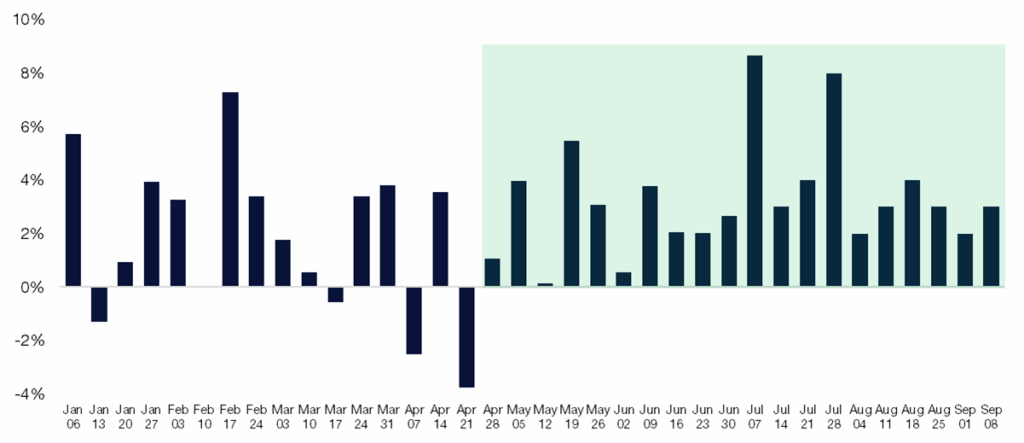
IV. Retail Positioning – Persistent Strength
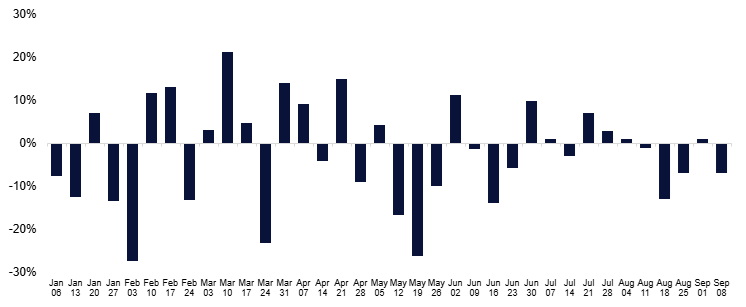
1. Citadel Securities’ Retail Equities clients: Net buyers in 19 of the last 22 weeks, rebounding after April weakness.
Retail Cash Equities – Net Notional by Week (Std Dev)
January – Sep 2025
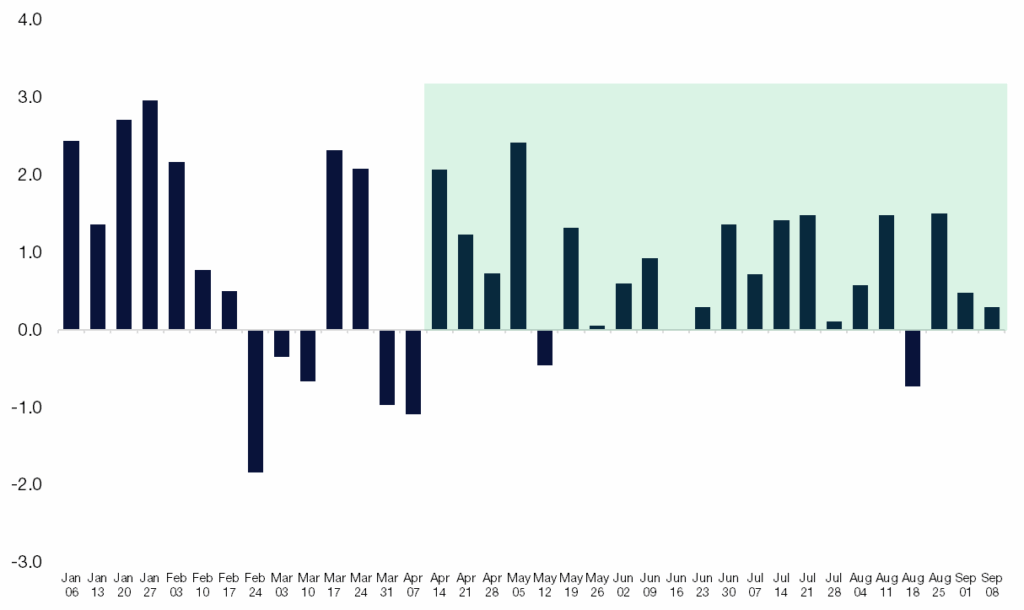
Source: Citadel Securities, as of September 16th, 2025. Figures are for illustrative purposes only. Past performance figures do not guarantee future results.
2. Retail Trend: Citadel Securities’ Retail Equity clients have been structural buyers for 20 consecutive months of both net notional and shares.
3. Citadel Securities’ Retail Equity clients seasonal demand trends from the last 8 years:
Seasonal trend: Sep weakest → Oct builds → Nov strongest
Retail Cash – Proportion of Net Notional By Month
August 1, 2017 – August 31, 2025
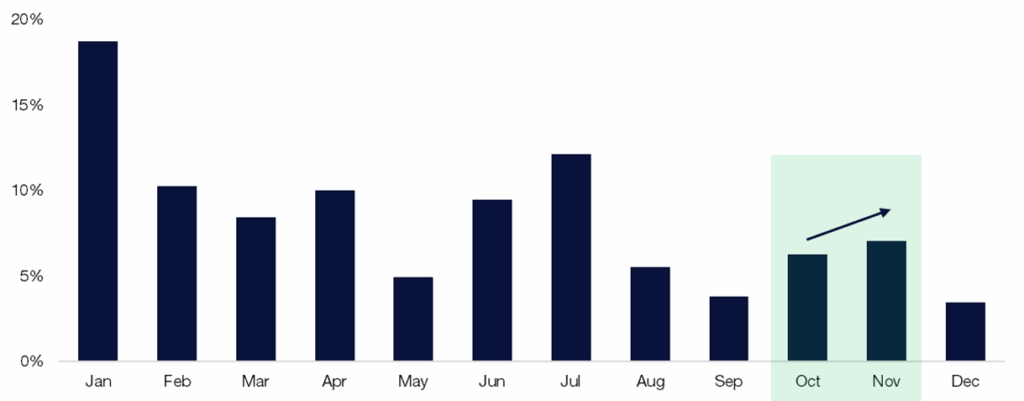
Source: Citadel Securities, as of September 16th, 2025. Figures are for illustrative purposes only. Past performance figures do not guarantee future results
4. Cash on the sidelines:
Boardroom question: $7.3T in money markets — when does cash rotate into risk assets given the decline in cash yields?
ICI Money Market Fund Assets at All-Time High: $7.3 Trillion
Jan 2020 – Sep 2025
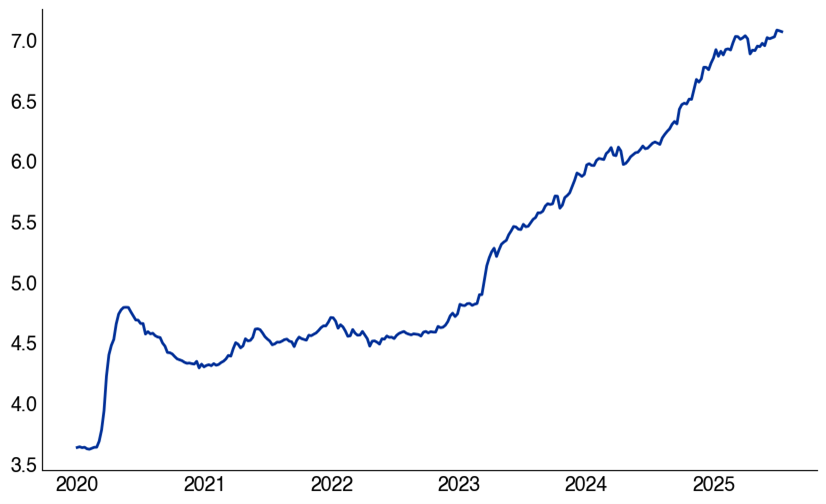
Source: ICI as compiled by Citadel Securities, as of September 16th, 2025. Figures are for illustrative purposes only. Past performance figures do not guarantee future results.
V. Volatility and Options Positioning
5. Citadel Securities’ Retail Options clients: August 2025 set a new monthly volume record.
Retail Options – Average Monthly Options Volume
Std Dev, normalized to January 2020
Source: Citadel Securities, as of September 16th, 2025. Figures are for illustrative purposes only. Past performance figures do not guarantee future results
6. Citadel Securities’ Retail Options client bullish streak watch
- This is now tied for 3rd-longest bullish streak since 2020, with 20 straight weeks of demand
- The top five streaks averaged 18 weeks – we have overshot historical demand
Retail Options – Call / Put Direction Ratio by Week (%)
January – Sep 2025
Source: Citadel Securities, as of September 16th, 2025. Figures are for illustrative purposes only. Past performance figures do not guarantee future results.
Longest Retail Weekly Option Buying Streaks on Record, since 2020.
Starting month, # of weeks
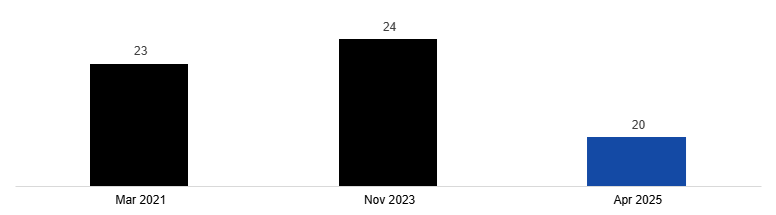
Source: Citadel Securities, as of September 16th, 2025. Figures are for illustrative purposes only. Past performance figures do not guarantee future results
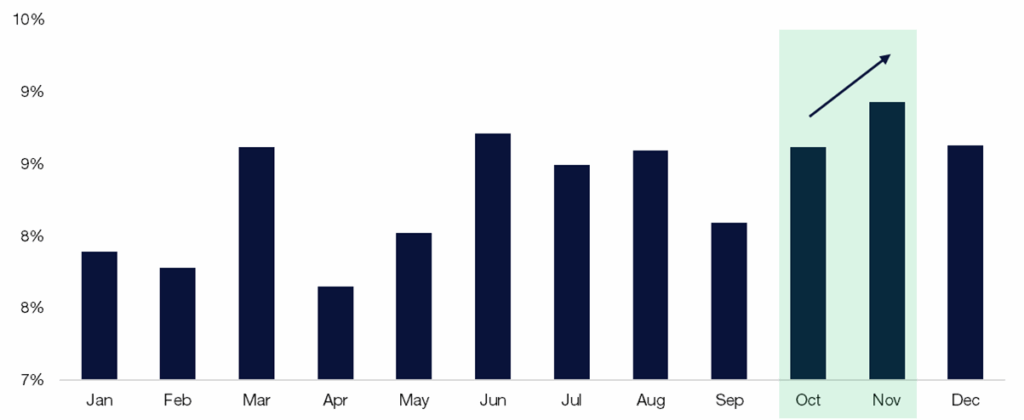
7. Retail Option acceleration in Q4
Citadel Securities’ Retail Options client volume typically wanes in September before rebounding into the final quarter of the calendar year. Activity picks back up in Q4, with November the strongest month of the year.
Retail Options – Proportion of Contract Volume by Month
January 2020 – December 2024
Source: Citadel Securities, as of September 16th, 2025. Figures are for illustrative purposes only. Past performance figures do not guarantee future results
8. Citadel Securities’ Institutional Options clients turned to hedging demand
- Turned bearish in 4 of the last 5 weeks
- Implied volatility has reset lower — hedges are attractive while staying in long positions
- FOMU – “fear of material underperformance” to benchmark indices has accelerated and kept longs in play given consecutive moves in the largest cap equities
Institutional Options –Call/Put Direction Ratio by Week
January – Sep 2025
Source: Citadel Securities, as of September 16th, 2025. Figures are for illustrative purposes only. Past performance figures do not guarantee future results.
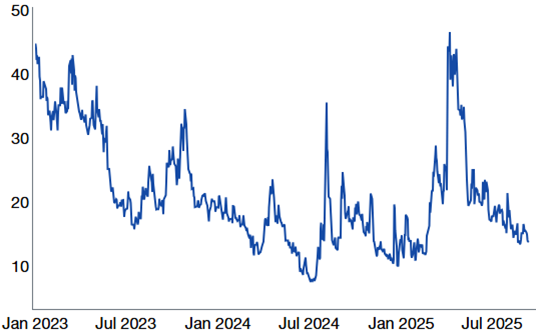
9. Volatility: September Triple-Witch Option Expiration (September 19th)
Three things to watch: zero-days-to-expiry (0DTE) volumes, record options volume, record long gamma positioning.
- CBOE notes that SPX 0DTE options averaged 2.4 million contracts per day in August – another record – and now make up 62% of overall SPX volume on the month. CBOE – Macro Volatility Digest
- CBOE also highlights that retail traders made up an estimated 53% of the volume. Last Friday was the eighth-largest volume day in history with 77 million contracts traded.
- Assets in vol-selling yield strategies are at a record.
This has contributed to a long dealer-gamma backdrop that can mute intraday moves. We estimate the long dealer-gamma positioning to be significant into triple-witch expiration and quarter-end.
SPX 3-month implied volatility
Jan 2023 – Sep 2025

Source: Bloomberg as compiled by Citadel Securities, as of September 16th, 2025. Figures are for illustrative purposes only. Past performance figures do not guarantee future results.
VI. Corporate Demand: Temporarily Paused
- Buyback blackout window started on September 15, 2025. Blackout typically begins ~two weeks before quarter-end and ends a day or two after Q3 earnings. August saw strong executions during the open window.
- EventVestor: U.S. authorizations have surpassed $1.2T (fastest pace on record) for Russell 3000; could reach $1.5T by year-end. Assuming a 90% execution rate → $1.35T actual executions (record). S&P 500 companies have seen $1T authorizations YTD.
- Buyback math: ~$1.35T of VWAP executions over 251 trading days ≈ $5.3B of implied daily demand.
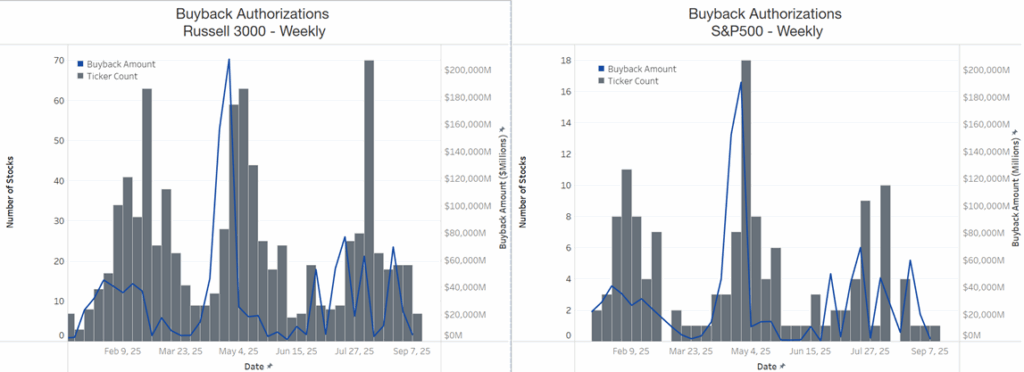
Source: EventVestor as compiled by Citadel Securities, as of September 16th, 2025. Figures are for illustrative purposes only. Past performance figures do not guarantee future results.
VII. Volatility Dynamics
- Hedge funds/large specs extremely short VIX.
- VIX down 69% in 20 weeks — largest decline on record.
- Takeaway: Crowded short volatility trade = asymmetric risk if shocks emerge.
CFTC VIX Consolidated % Long
January 2022 – Sep 2025
Source: COT report, as compiled by Citadel Securities, as of September 16th, 2025. Figures are for illustrative purposes only. Past performance figures do not guarantee future results.
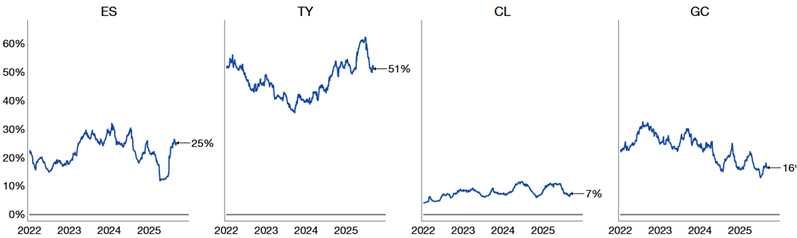
VIII. Systematic Positioning: Full but Fragile
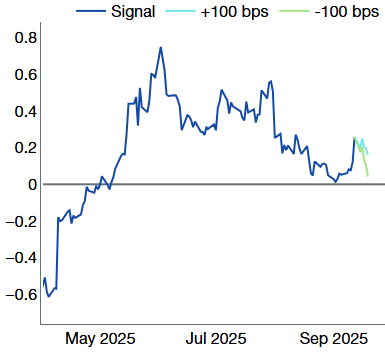
10. CTA/Trend following: Citadel Securities’ Macro Strategy team estimates that equity trend signals are getting weaker from here, given elevated exposure.
US Equity CTA Signals
January 2024 – Sep 2025
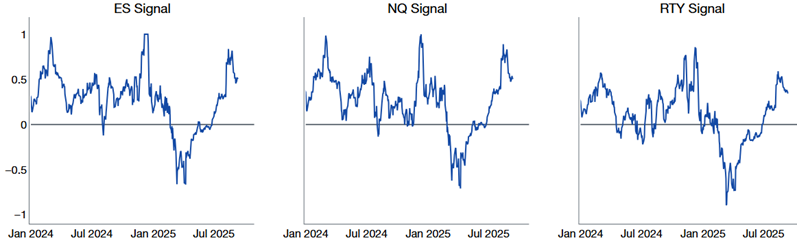
Source: Citadel Securities, as of September 16th, 2025. Figures are for illustrative purposes only. Past performance figures do not guarantee future results.
11. CTA thresholds for ES1 and NQA
ES1 (S&P 500) CTA Signals
January 2024 – Sep 2025
Source: Citadel Securities, as of September 16th, 2025. Figures are for illustrative purposes only. Past performance figures do not guarantee future results.
NQ1 (NDX) CTA Signals
January 2024 – Sep 2025
Source: Citadel Securities, as of September 16th, 2025. Figures are for illustrative purposes only. Past performance figures do not guarantee future results.
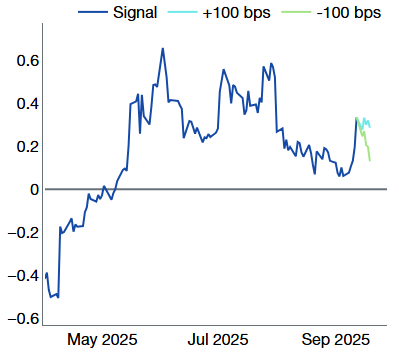
12. CTA ES1: Short-term and long-term signals
January 2022 – Sep 2025
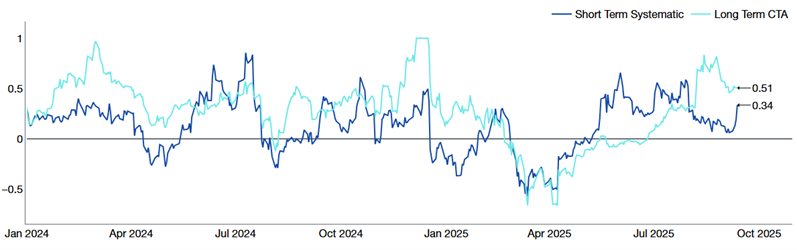
Source: Citadel Securities, as of September 16th, 2025. Figures are for illustrative purposes only. Past performance figures do not guarantee future results.
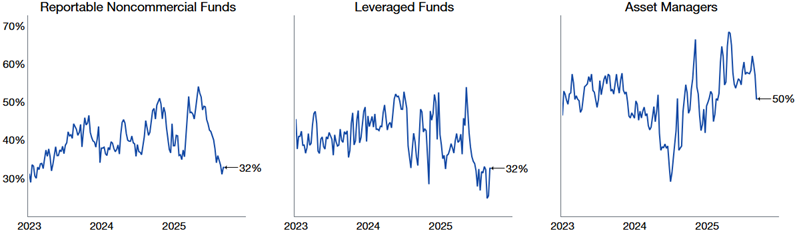
13. CFTC Net Longs: Positioning rising back toward historical averages
CFTC S&P 500 Consolidated % Long
January 2022 – Sep 2025
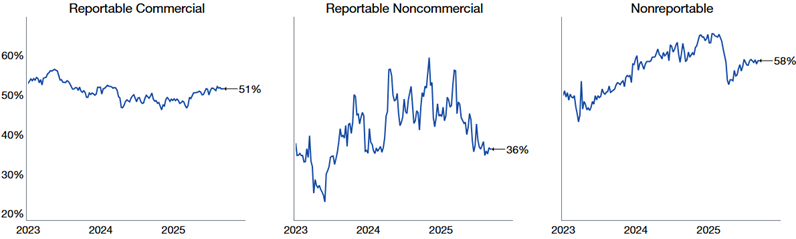
Source: COT report, as compiled by Citadel Securities, as of September 16th, 2025. Figures are for illustrative purposes only. Past performance figures do not guarantee future results.
CFTC NDX 100 Consolidated % Long
January 2022 – Sep 2025
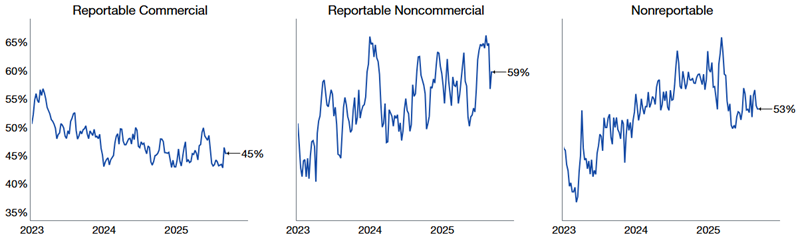
Source: COT report, as compiled by Citadel Securities, as of September 16th, 2025. Figures are for illustrative purposes only. Past performance figures do not guarantee future results.
14. Vol-Control strategies – which take cues from the realized volatility market – have already increased exposure substantially. This is one of the sharpest rebounds in equity exposure we’ve seen.
Vol Target Exposure with 5%, 10%, 15%, Risk Control
Exposure Rank since 2020
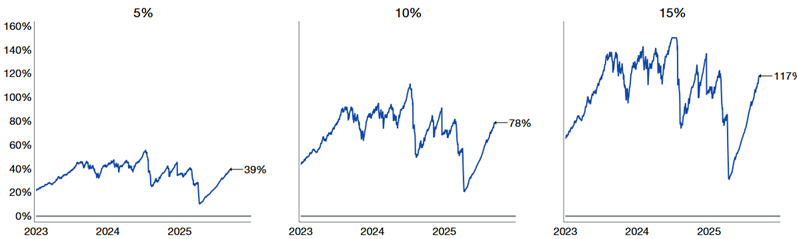
Source: Bloomberg as compiled by Citadel Securities, as of September 16th, 2025. Figures are for illustrative purposes only. Past performance figures do not guarantee future results
15. Risk Parity strategies – driven by lower cross-asset volatility – now hold equity exposure near their 3-year average of 25% exposure.
Systematic positioning remains elevated → but no unwind trigger. If we go down a little, we could go down a lot.
Risk Parity Exposure
Jan 2022 – Sep 2025
Source: Citadel Securities, as of September 16th, 2025. Figures are for illustrative purposes only. Past performance figures do not guarantee future results.
16. Sentiment has declined, yet retail remains resilient
AAII Equity Asset Allocation (%)
Jan 2022 – Sep 2025
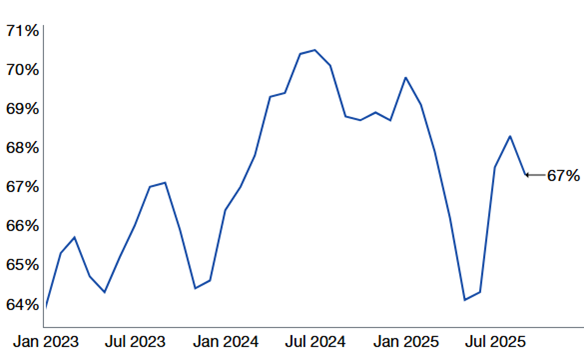
Source: AAII, as reported by Bloomberg and compiled by Citadel Securities, as of September 15th, 2025. Figures are for illustrative purposes only. Past performance figures do not guarantee future results.
AAII Bull – AAII Bear Spread, saw a big move lower
Jan 2022 – Sep 2025
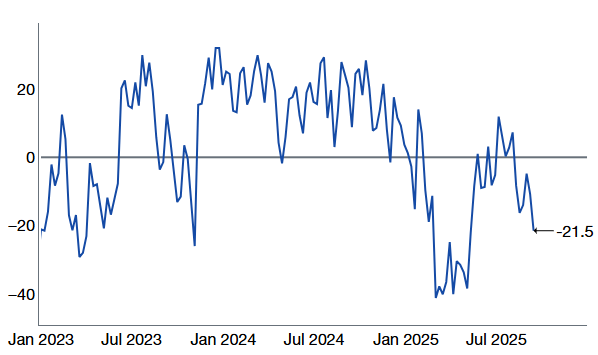
Source: AAII, as reported by Bloomberg and compiled by Citadel Securities, as of September 15th, 2025. Figures are for illustrative purposes only. Past performance figures do not guarantee future results.
17. US equities and US bonds are both driving returns for the 60/40 portfolio.
SPX and 10-year Rolling 60-day Correlation
Jan 2022 – Sep 2025
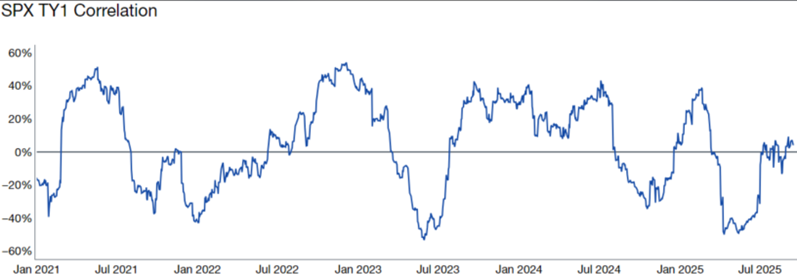
Source: Bloomberg as compiled by Citadel Securities, as of September 16th, 2025. Figures are for illustrative purposes only. Past performance figures do not guarantee future results.
Takeaway: If markets slip, systematic flows could exacerbate drawdowns.
GMI | September Watchlist ✅
- Q3 rebalancing flows into month-end after record stock rally
- Corporate blackout → weaker buyback support near-term
- Triple-witching (Sep 19) with record gamma, market to move more freely next week
- Elevated systematic positioning = downside skew
- Seasonal vol risk, masked by long-gamma
📌 GMI Key Takeaway: Structural Bull, Tactical Worry
- S&P 500 +33% since April lows (+$16T in market cap) — third-largest 5-month run in 20 years.
- Structural bull case remains intact: liquidity, retail, buybacks, AI.
- Tactical risk: Sep–Oct fragility; hedge exposures.
- Forward view: Expect year-end chase; treat short-term dips as buying opportunities.
Copyright © Citadel Enterprise Americas LLC or one of its affiliates. All rights reserved.
Legal Entities Disseminating this Material: This material is disseminated in the United Kingdom by Citadel Securities (Europe) Limited (“CDGE”) authorized and regulated by the Financial Conduct Authority (“FCA”) (Registered company number: 05462867); in the European Union by Citadel Securities GCS (Ireland) Limited (“CSGI”) and its Paris Branch authorized and regulated by the Central Bank of Ireland (“CBI”) (Registration Number: C173437); in Hong Kong by Citadel Securities (Hong Kong) Limited (“CDHK”) licensed by the Securities and Futures Commission of Hong Kong (“SFC”), in Japan by Citadel Securities Japan Co., Ltd (“CSJC”) registered as a Type 1 financial instruments business operator with the Japan Financial Services Agency (“JFSA”); and in the United States of America by Citadel Securities LLC (“CDRG”) registered with the Securities Exchange Commission (“SEC”), Financial Industry Regulatory Authority (“FINRA”), and Securities Investor Protection Corporation (“SIPC”), Citadel Securities Institutional LLC (“CSIN”) registered with the SEC, FINRA, and SIPC, or Citadel Securities Swap Dealer LLC (“CSSD”) registered with the SEC, Commodities Futures Trading Commission (“CFTC”), and National Futures Association (“NFA”). Unless governing law permits otherwise, you must contact a Citadel Securities entity in your home jurisdiction if you want to use our services in effecting a transaction in any financial instruments or securities, including derivatives.
FOR INSTITUTIONAL USE ONLY; FOR PROFESSIONAL CLIENTS AND ELIGIBLE COUNTERPARTIES ONLY. This material is not intended as and does not constitute investment research. Contents of this material will be strictly limited to non-specific, generic information (i.e. macro events/topics) and are not subject to the Markets in Financial Instruments directive (MiFID II) or FINRA research rules. This material does not constitute an offer, solicitation, invitation, or inducement to purchase, acquire, subscribe to, provide, or sell any financial instrument or otherwise engage in investment activity. Please see additional important disclosures, including disclosures that may be relevant to your country of residence or business at www.citadelsecurities.com/GlobalSalesTrading.