Markets entering the second half of 2026 bear little resemblance to the markets investors navigated for most of the past two decades.
The defining story of 2026 has not been a single macro event, it has been the structural transformation of equity markets.
Concentration, passive investing, retail participation, leverage, and volatility are no longer independent trends. Together, they increasingly determine how capital flows, prices are discovered, and risk is transferred. These structural forces are no longer simply influencing markets, they are increasingly defining them.
This marks my 21st semiannual Global Market Structure & Flows review. The 20 charts that follow highlight the structural developments we believe defined the first half of 2026, organized across five themes:
I. Market Structure and Concentration
II. Ownership and Passive Dominance
III. Retail Flow Revolution
IV. Leverage Ecosystem
V. Volatility and Market Character
Most market outlooks begin with the economy. This one begins with market structure. We believe these structural forces will remain the dominant drivers of market behavior throughout the second half of 2026, and we hope this review provides a useful framework for navigating them.

I. Market Structure and Concentration
The first half of 2026 reinforced one of the defining features of today’s market: historically high concentration and increasingly narrow leadership.
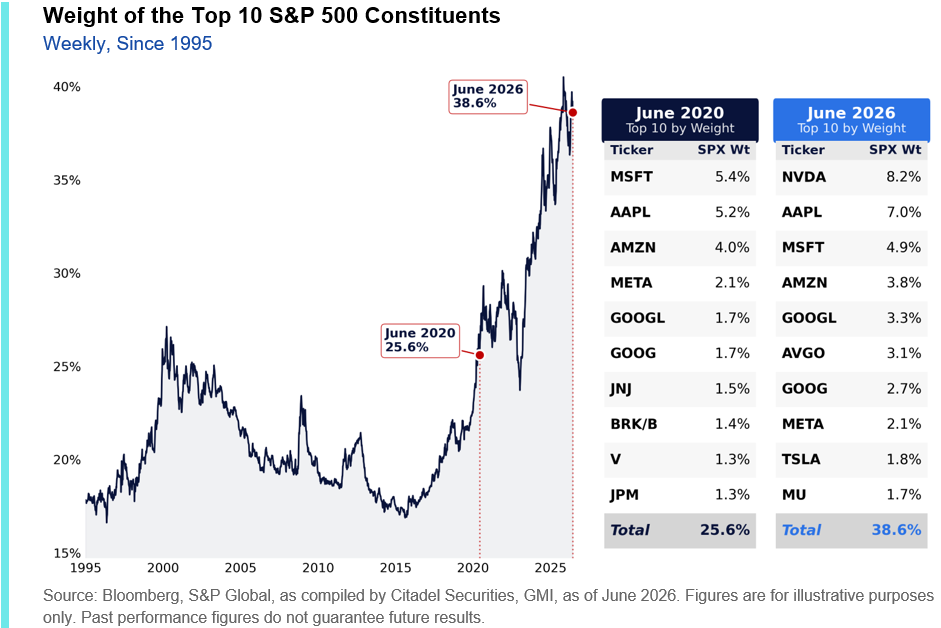
1. Concentration remains near historic highs.
The ten largest companies now account for nearly 40% of the S&P 500, remaining near record concentration levels. Their combined index weight has increased by ~10% since June 2023 and ~13% since June 2020.
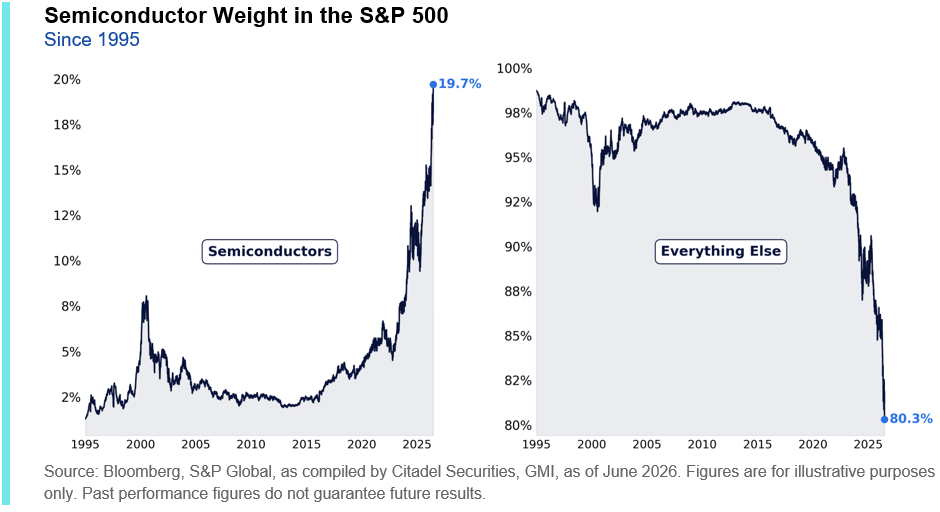
2. Semiconductors have become the market’s dominant leadership sector.
Semiconductor companies now represent nearly one-fifth of the S&P 500, the highest share on record. Their representation in the index has quadrupled since June 2020.
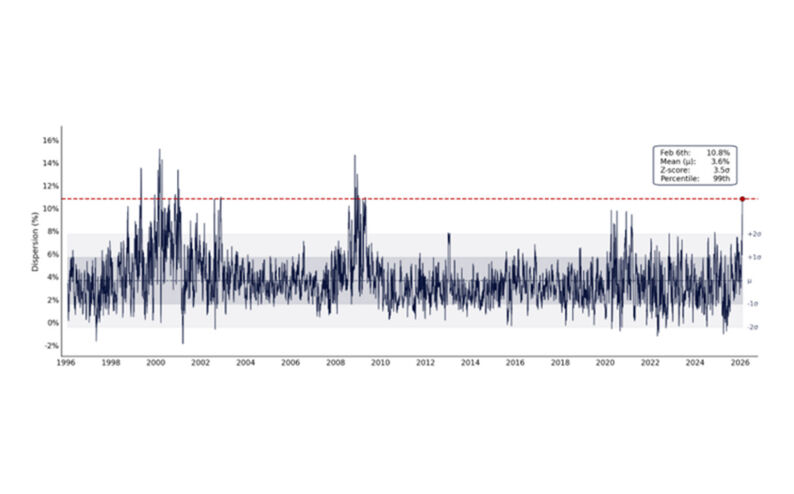
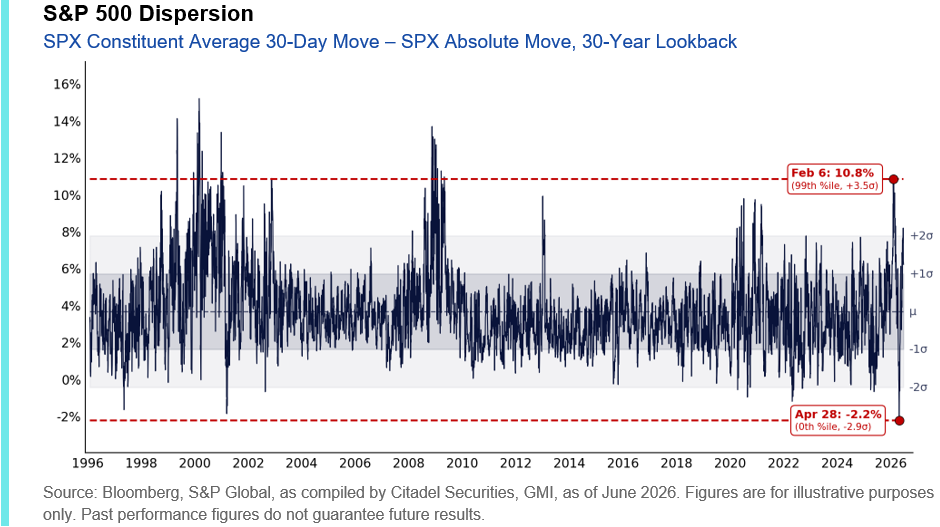
3. Dispersion swung from one extreme to another.
Our measure of single-stock dispersion reached both the highest and lowest historical percentiles in fewer than 60 trading days, reflecting the market’s transition from broad rotation to highly concentrated leadership.
II. Ownership and Passive Dominance
The ownership base of the US equity market continues to evolve as household ownership broadens and passive investing absorbs an increasing share of investor capital.
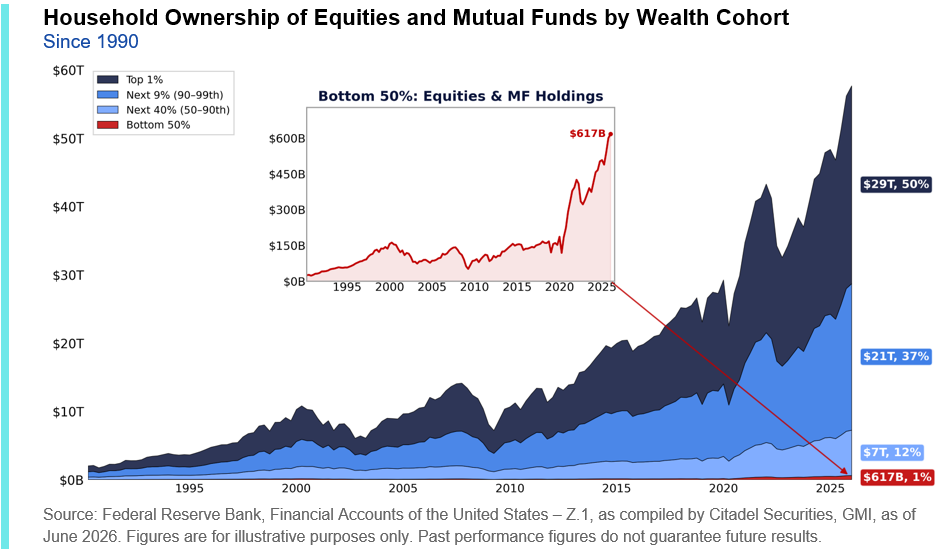
4. Household equity ownership continues to rise.
The fastest growth in equity ownership is occurring among households that historically had the lowest market participation rates. Today, the bottom 50% of US households own more than $615 billion of equities and mutual funds, a record high.
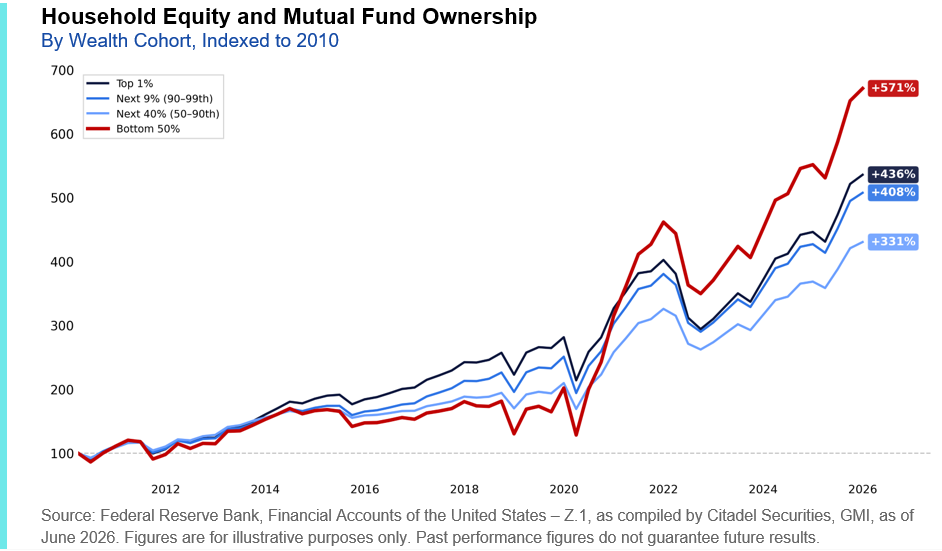
5. The fastest growth came from lower-wealth households.
Since 2010, equity and mutual fund ownership among the bottom 50% of US households has increased by more than 570%, outpacing every other wealth cohort.
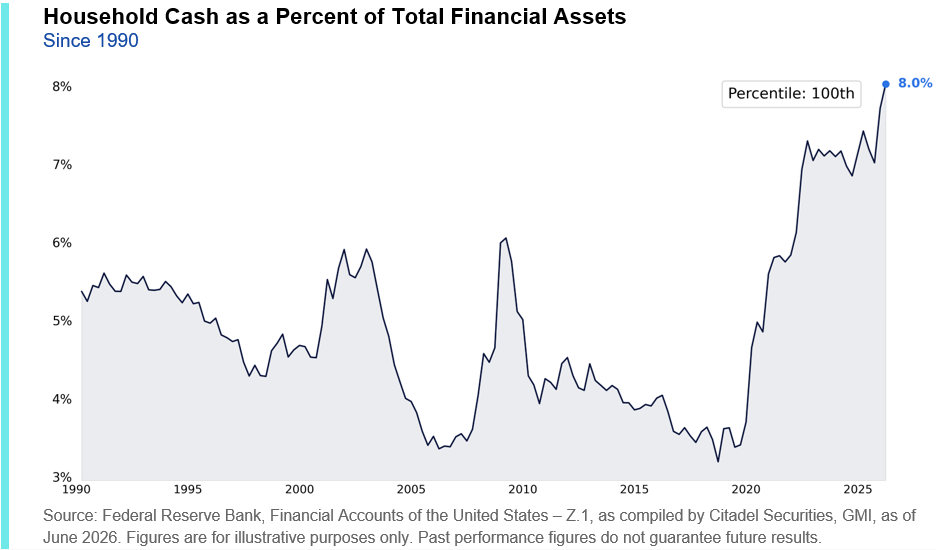
6. Households hold record cash balances.
Despite record equity ownership, household cash has risen to 8% of total financial assets, the highest level in more than three decades.
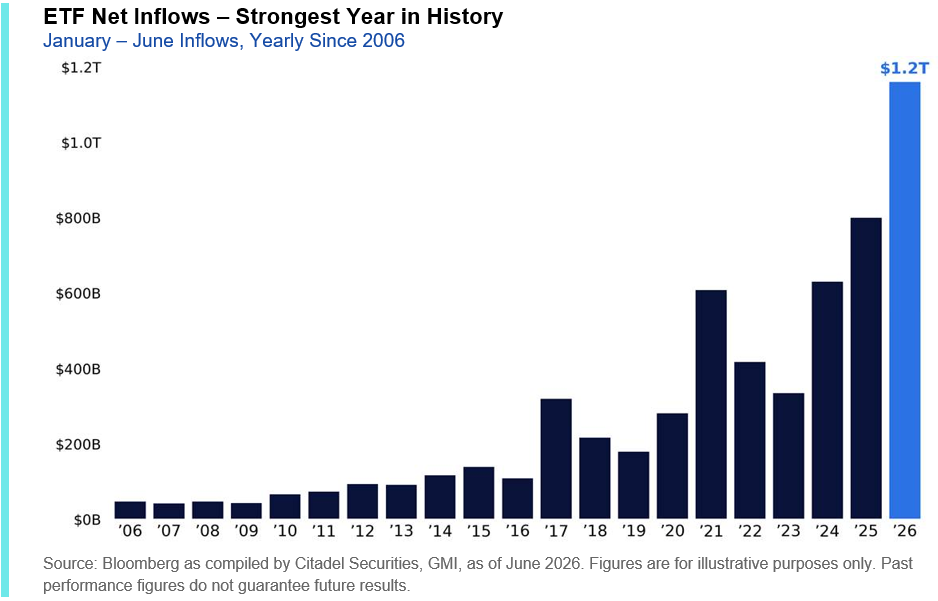
7. Passive flows continue to accelerate.
ETFs have already attracted $1.2 trillion in net inflows year-to-date, 45% ahead of last year’s record pace. In six months, investors have allocated ~2.5x what historically represented an entire year’s worth of ETF inflows.
III. Retail Flow Revolution
Through our position as the #1 retail market maker in the US, executing approximately 35% of all US-listed retail volume, we have a unique view into the evolution of retail investor behavior.
Retail participation has evolved from a cyclical phenomenon into a structural feature of modern markets, providing a persistent source of demand across US equities.
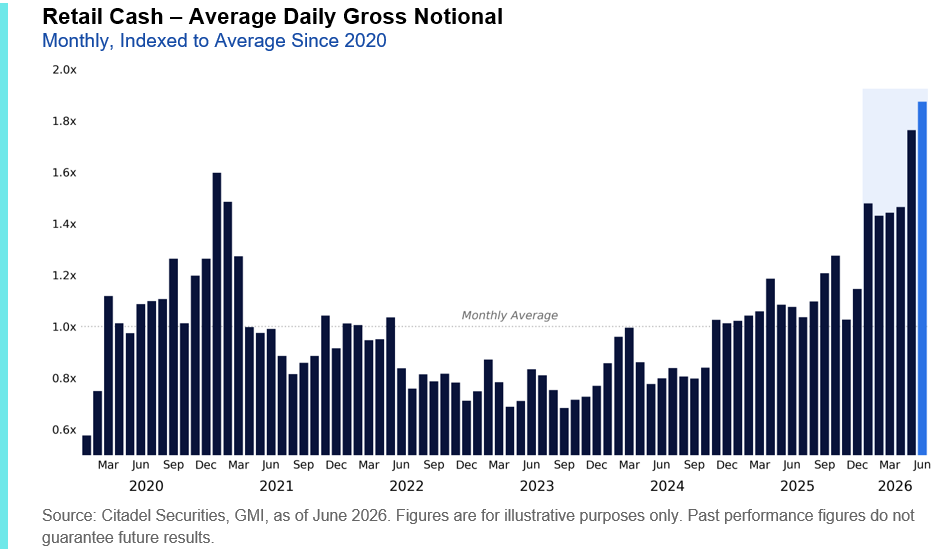
8. Retail activity is shattering records.
May and June shattered the previous monthly activity records, with average daily retail cash equity volumes running 65% above 2025 levels and more than double the 2024 average. 9 of the 10 most active trading days ever observed on our platform occurred within the past two months, including 7 during June alone.
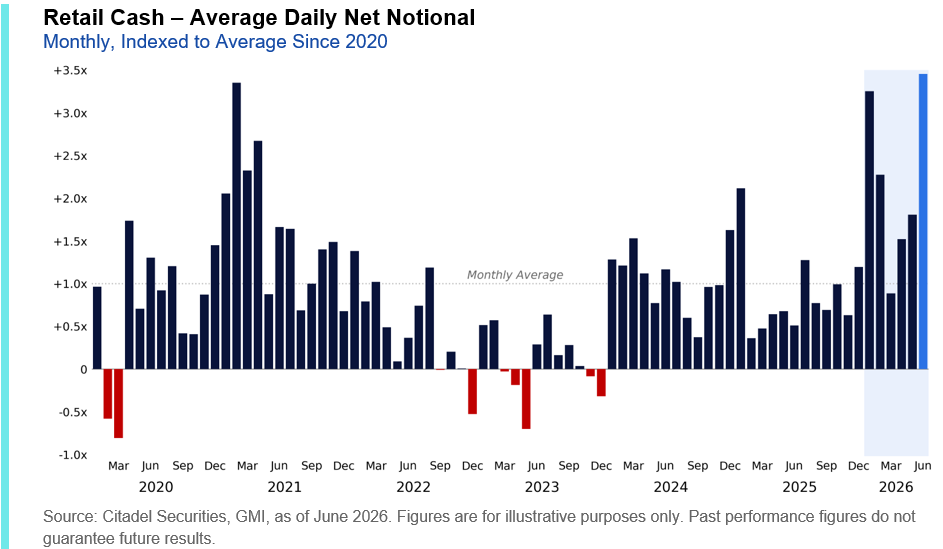
9. Retail has become the structural bid.
Retail investors are deploying capital at a record pace. June is on track to become the strongest month in our history, with daily purchases running nearly four times last year’s average.
June 12th marked the largest single day of retail net buying ever observed on our platform, surpassing the previous record by 50%.
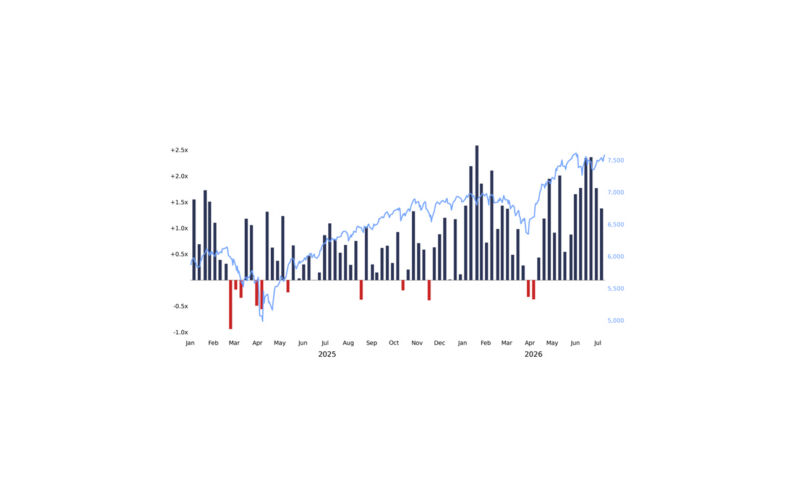
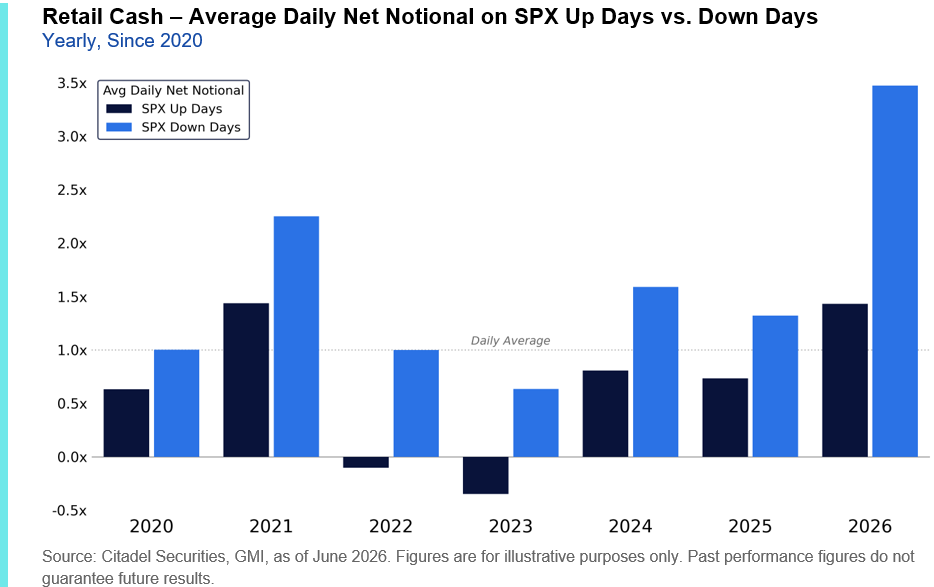
10. Buy-the-dip behavior reached a new extreme.
Retail investors purchased nearly 3.5x the average daily amount on SPX down days during the first half of 2026, the strongest buy-the-dip behavior in our dataset. Even on SPX rallies, they continued to buy nearly 1.5x the daily average.
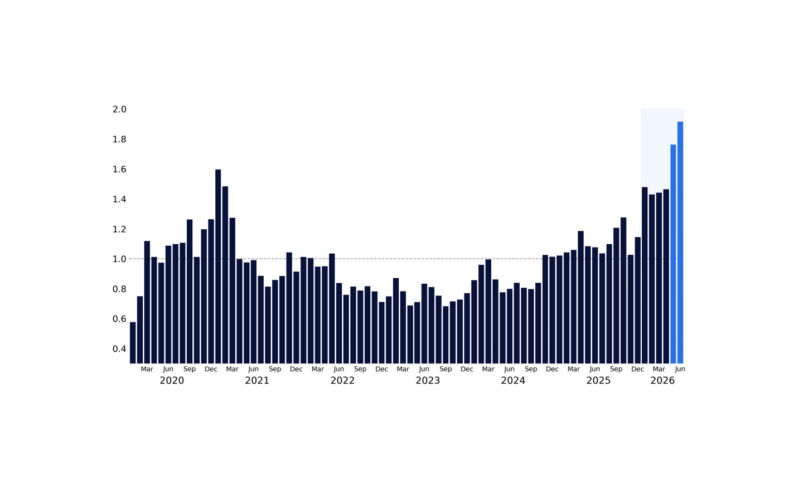
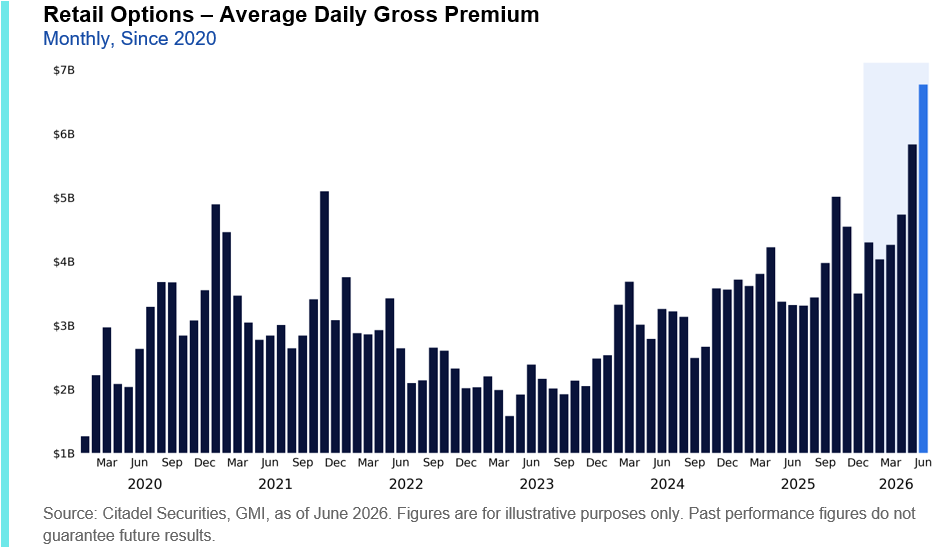
11. Retail options activity has entered a new regime.
Retail traded a record ~$6.8B of options premium per day in June on our platform, 17% above May’s previous record, 65% above the 2025 average, and more than double the historical average.
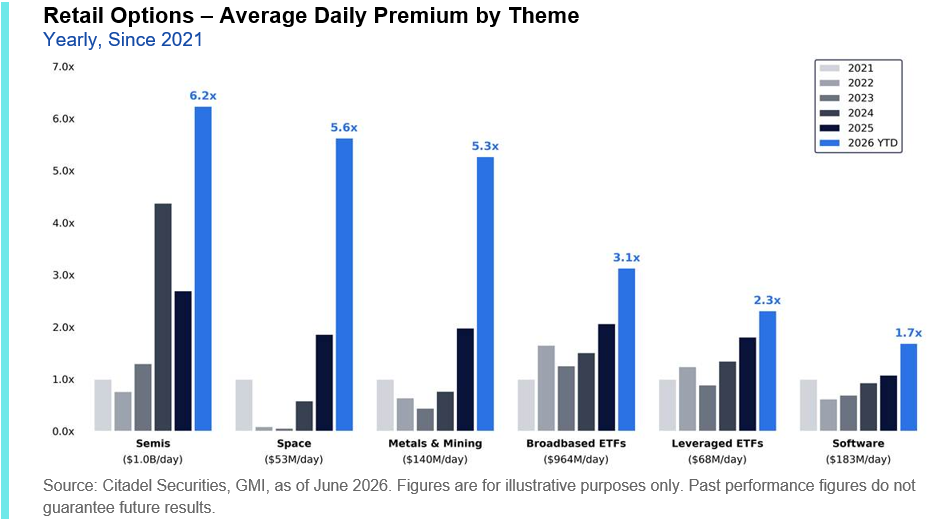
12. Retail is chasing leadership.
Unlike previous periods of elevated retail activity, today’s retail investor is increasingly concentrated in the same sectors driving benchmark performance, led by semiconductors and broad-based ETFs.
In June alone, retail traded approximately $1.9 billion of semiconductor options premium per day – 6x the historical average – with ~75% of that activity concentrated in call options.
IV. The Leverage Ecosystem
As investors crowd into market leadership, leverage has become the preferred way to express that view. Options, leveraged ETFs, and systematic strategies are increasingly amplifying moves in the underlying market.
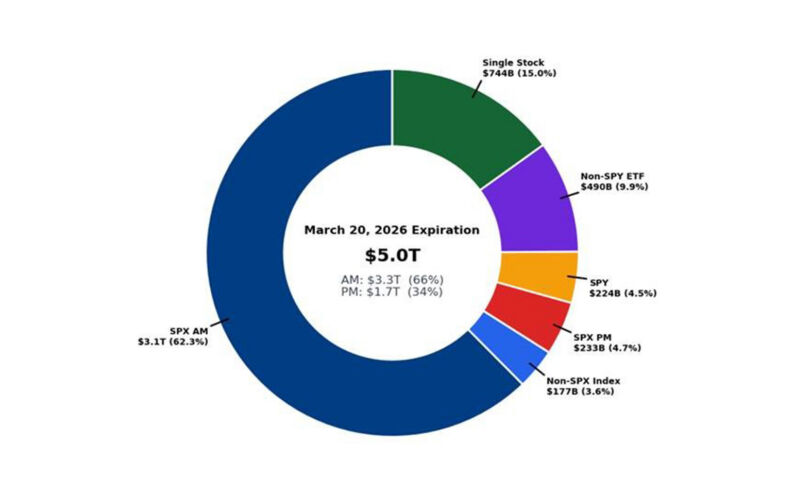
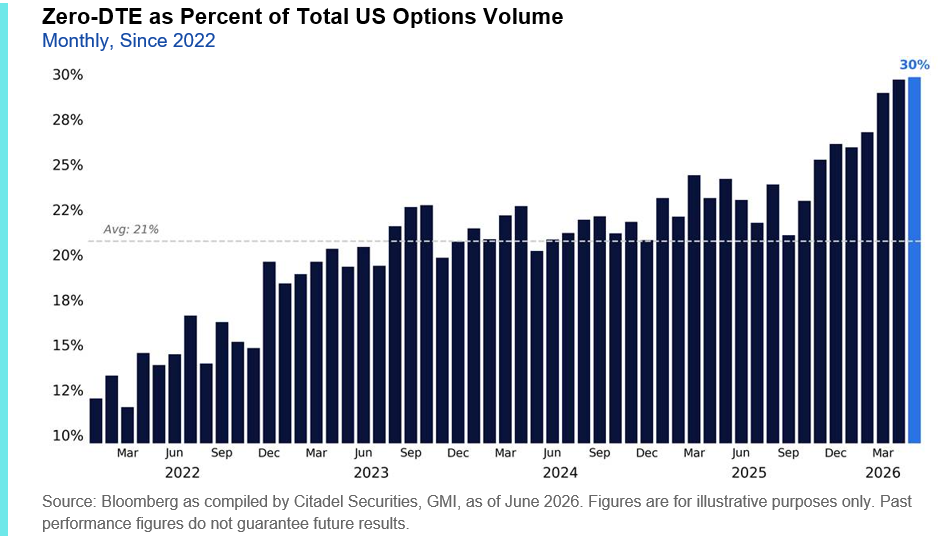
13. Zero days-to-expiration (0DTE) have become the dominant instrument.
One out of every three listed options traded in the US now expires the same day, roughly doubling 0DTE’s market share since daily expirations launched in 2022.
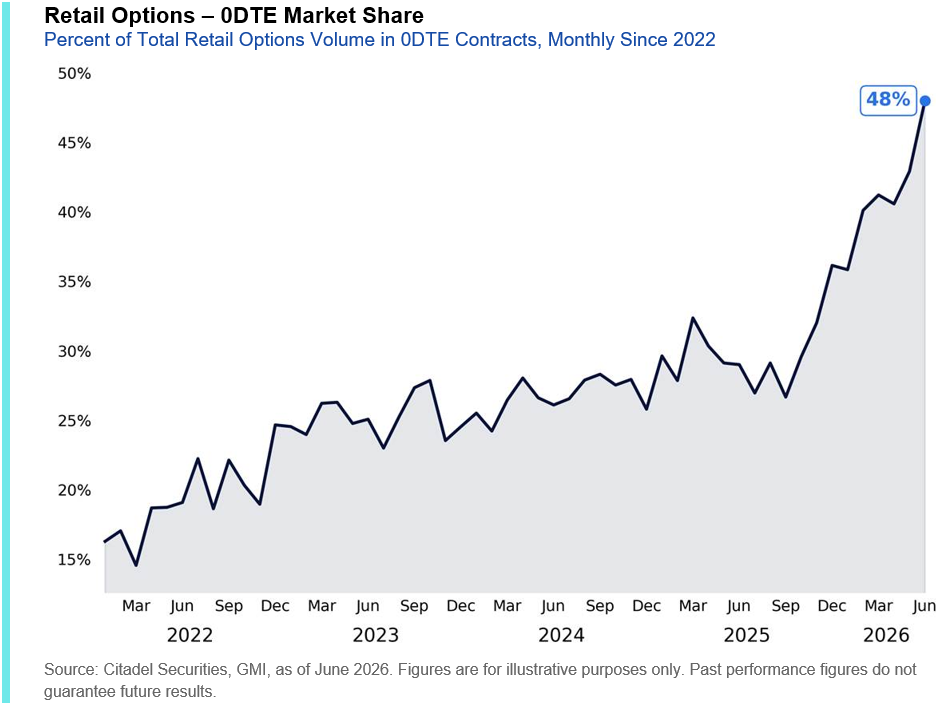
14. Half of retail options are now 0DTE.
Following the introduction of Monday and Wednesday expirations in single stocks at the beginning of this year, nearly half of all retail options volume executed by Citadel Securities now trades in 0DTE contracts, up from 30% in 2025 and just 13% in 2021. Average time to expiry on our platform is < 3 days.
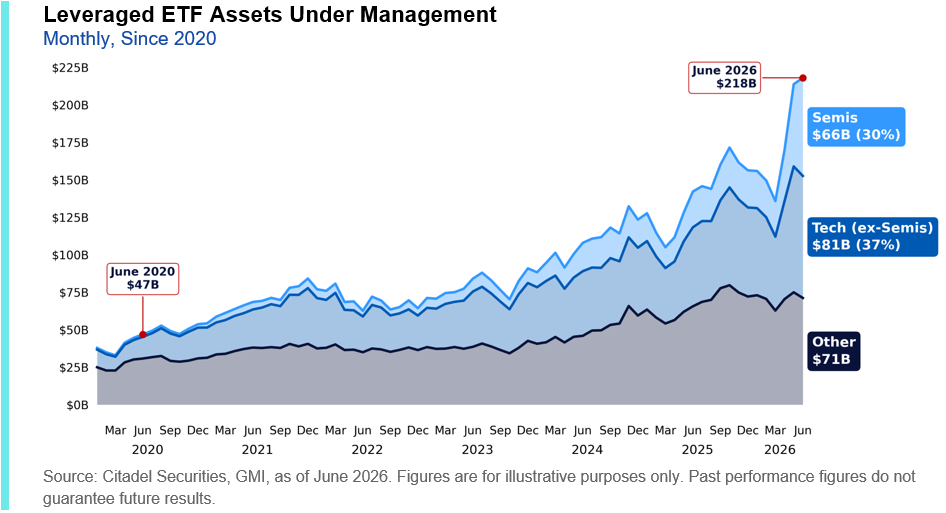
15. Leverage continues to concentrate in leadership.
Leveraged ETF assets reached a record ~$218 billion, more than 4.5x their levels from June 2020. Since the end of March alone, assets increased by roughly $82 billion (+60%), led by technology (+136%) and semiconductor (+175%) exposures.
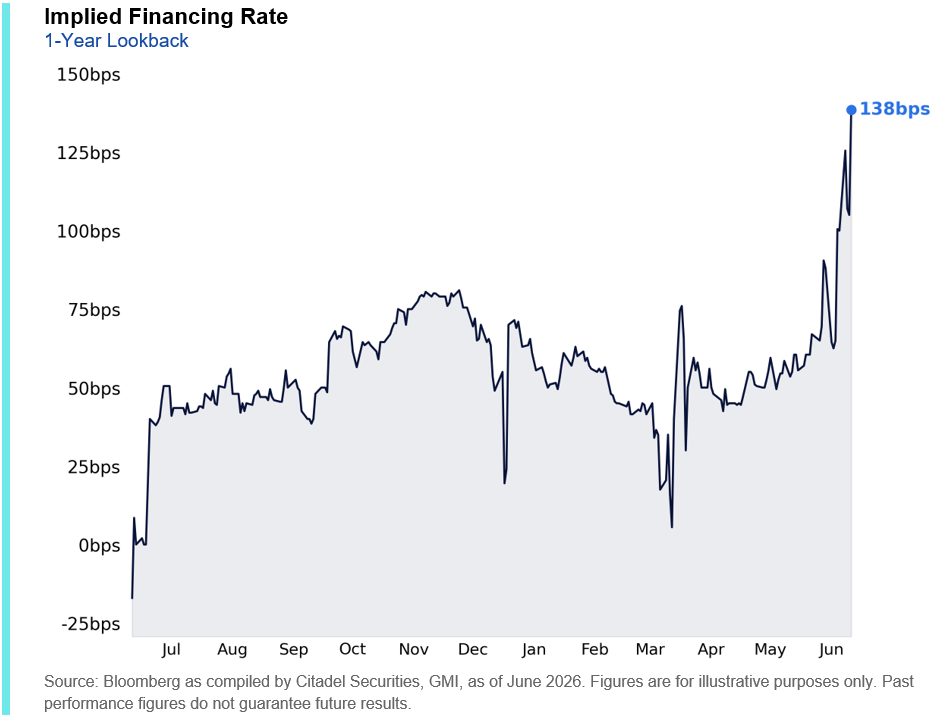
16. Leverage is becoming materially more expensive.
The combination of concentrated positioning, growing buyside leverage demand, and constrained balance sheet capacity has begun to tighten funding markets, pushing one-month equity financing spreads to as high as 138bps above SOFR.
V. Volatility and Market Character
Concentration, ownership, retail participation, and leverage have fundamentally altered the behavior of volatility.
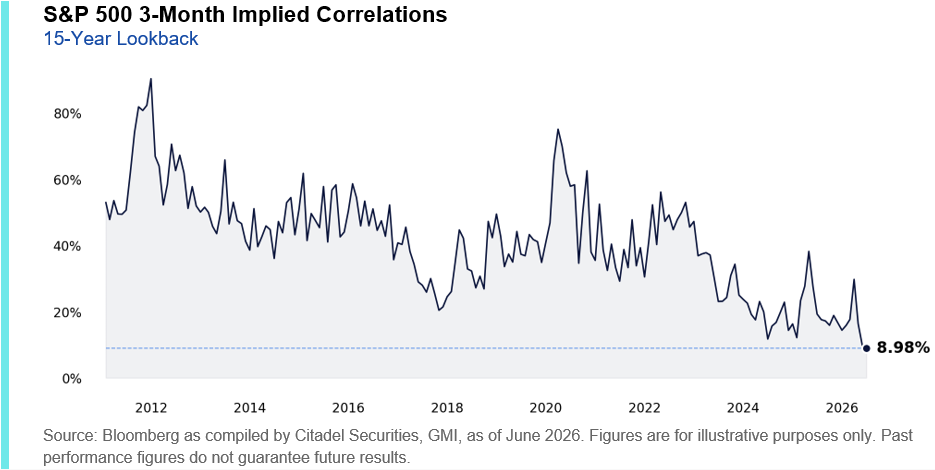
17. Stock selection has become increasingly important.
3-month implied correlations fell to their lowest level in more than 15 years, reflecting one of the strongest stock picker’s markets in history.
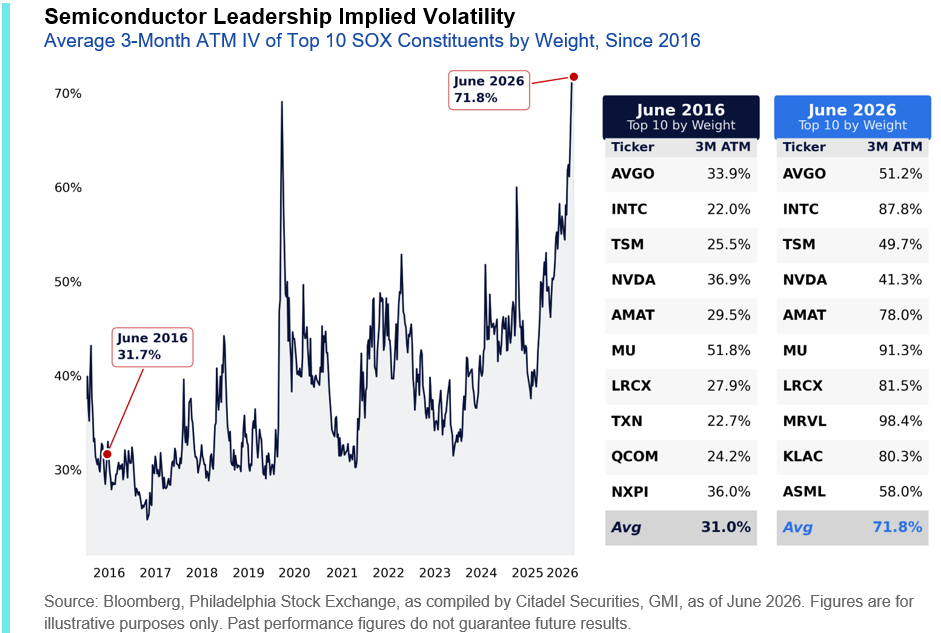
18. Semiconductors have entered a new volatility regime.
The average 3-month implied volatility of the ten largest semiconductor companies has more than doubled over the past decade, rising from 32% in 2016 to nearly 72% today, reflecting a structural repricing of the market’s most important leadership group.
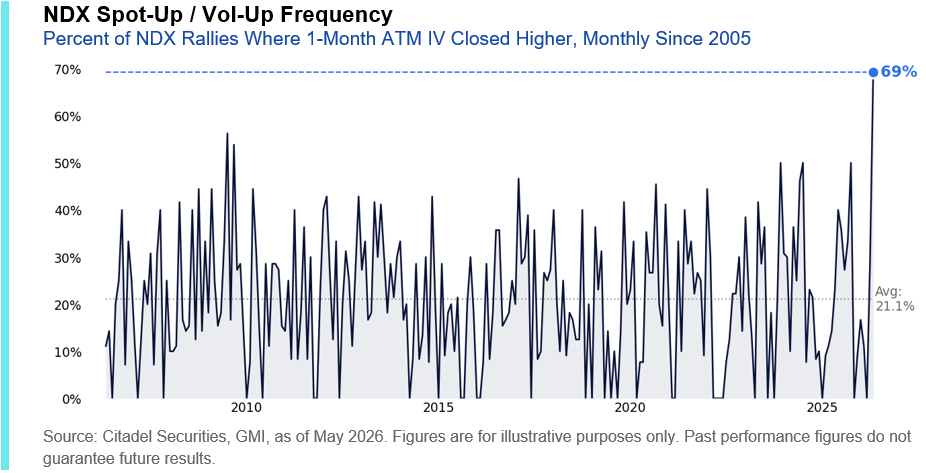
19. Spot-up / vol-up became the new normal.
Nearly 70% of Nasdaq rallies during May were accompanied by higher 1-month at-the-money implied volatility, the highest monthly frequency observed since 2005 and more than 3x the long-run average.
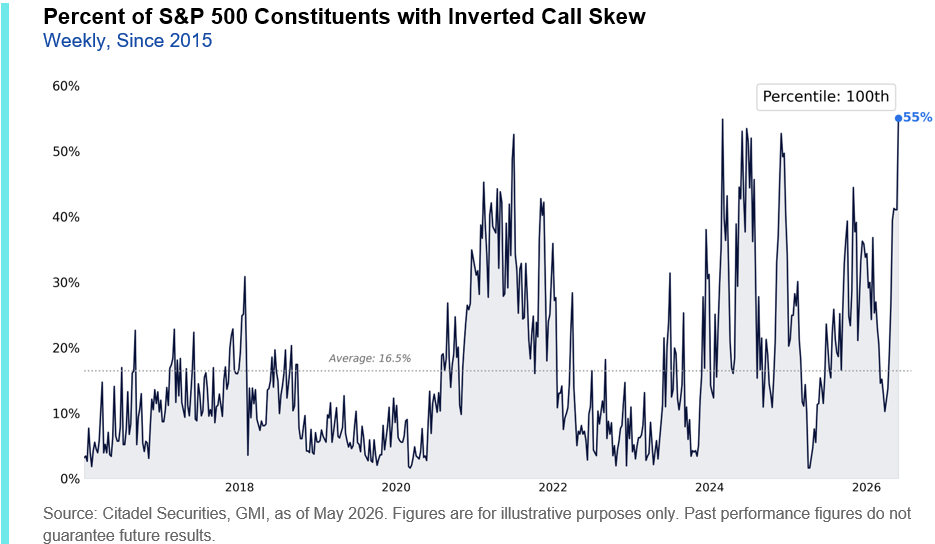
20. Investors chased upside at record levels.
By the end of May, 55% of S&P 500 constituents exhibited inverted 1-month call skew, the highest proportion observed in more than a decade as investors increasingly paid a premium for continued upside exposure.
GMI BOTTOM LINE
The defining story of the first half of 2026 was not a macro shock, it was the continued structural transformation of equity markets
Market concentration remains near historic highs. Passive investing continues to absorb capital at unprecedented rates. Retail investors have become a persistent source of demand. Leverage has migrated toward increasingly short-dated and concentrated exposures. Together, these forces are reshaping liquidity, price discovery, and the behavior of volatility.
As a result, understanding today’s market requires more than forecasting economic growth, inflation, or earnings. It requires understanding the structural forces that increasingly drive market behavior.
We believe these dynamics will remain the dominant influence on US equities throughout the second half of 2026. Investors who understand how capital moves through today’s market, not just why markets move, will be best positioned to navigate what comes next.
Thank you for your continued partnership and support throughout the first half of the year. We look forward to discussing these themes with you in the months ahead and wish you a successful second half of 2026.

Copyright © Citadel Enterprise Americas LLC or one of its affiliates. All rights reserved.
Legal Entities Disseminating this Material: This material is disseminated in the United Kingdom by Citadel Securities (Europe) Limited (“CDGE”) authorized and regulated by the Financial Conduct Authority (“FCA”) (Registered company number: 05462867); in the European Union by Citadel Securities GCS (Ireland) Limited (“CSGI”) and its Paris Branch authorized and regulated by the Central Bank of Ireland (“CBI”) (Registration Number: C173437); in Hong Kong by Citadel Securities (Hong Kong) Limited (“CDHK”) licensed by the Securities and Futures Commission of Hong Kong (“SFC”), in Japan by Citadel Securities Japan Co., Ltd (“CSJC”) registered as a Type 1 financial instruments business operator with the Japan Financial Services Agency (“JFSA”); and in the United States of America by Citadel Securities LLC (“CDRG”) registered with the Securities Exchange Commission (“SEC”), Financial Industry Regulatory Authority (“FINRA”), and Securities Investor Protection Corporation (“SIPC”), Citadel Securities Institutional LLC (“CSIN”) registered with the SEC, FINRA, and SIPC, or Citadel Securities Swap Dealer LLC (“CSSD”) registered with the SEC, Commodities Futures Trading Commission (“CFTC”), and National Futures Association (“NFA”). Unless governing law permits otherwise, you must contact a Citadel Securities entity in your home jurisdiction if you want to use our services in effecting a transaction in any financial instruments or securities, including derivatives.
FOR INSTITUTIONAL USE ONLY; FOR PROFESSIONAL CLIENTS AND ELIGIBLE COUNTERPARTIES ONLY. This material is not intended as and does not constitute investment research. Contents of this material will be strictly limited to non-specific, generic information (i.e. macro events/topics) and are not subject to the Markets in Financial Instruments directive (MiFID II) or FINRA research rules. This material does not constitute an offer, solicitation, invitation, or inducement to purchase, acquire, subscribe to, provide, or sell any financial instrument or otherwise engage in investment activity. Please see additional important disclosures, including disclosures that may be relevant to your country of residence or business at www.citadelsecurities.com/GlobalSalesTrading.