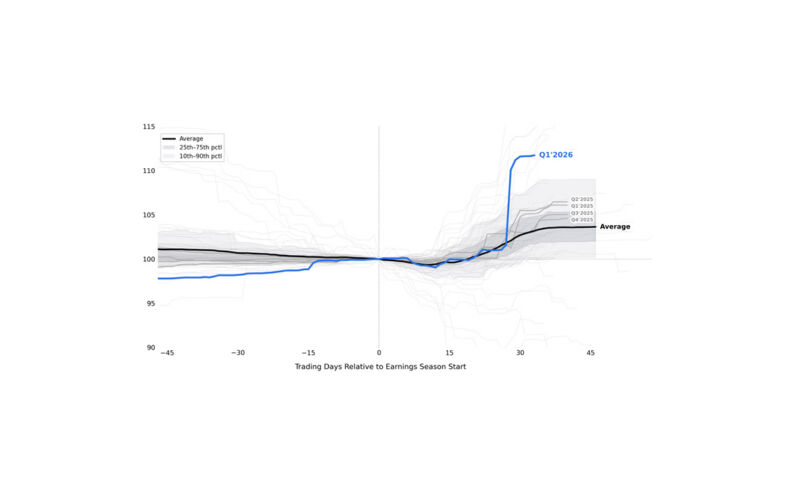
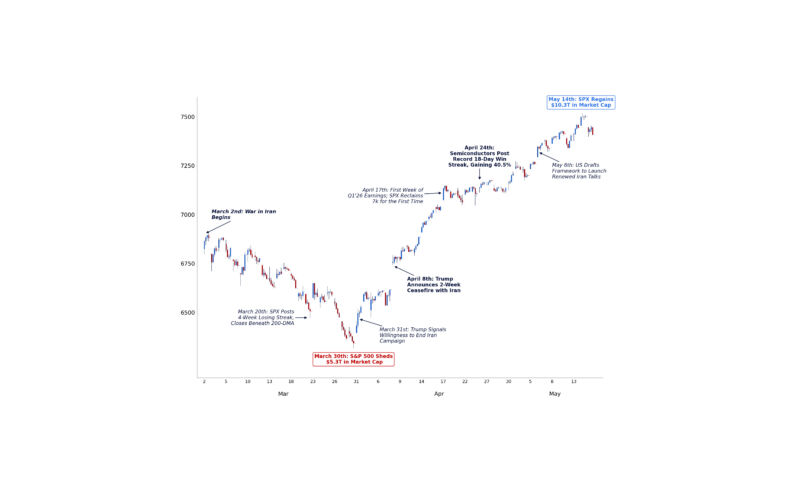
Two weeks ago, we believed the market needed a meaningful technical reset before we could become more constructive on US equities. We believe that reset has now largely occurred. The market we are entering is fundamentally different from the one we exited two weeks ago.
Retail demand remains exceptionally resilient. Positioning headwinds have eased, market leadership has broadened, and valuations have become more attractive heading into earnings season. Our framework has shifted. The market is no longer driven primarily by positioning; it is transitioning back toward fundamentals.
We have organized our GMI watchlist into four broad categories:
I. Retail Behavior
II. Technical Positioning
III. Market Leadership
IV. Earnings & Fundamentals
Below are the ten questions we have been watching most closely, and how we answer them today. Nine of the ten indicators on our checklist have improved materially over the past two weeks. Our checklist has largely turned green. The remaining question, and now the market’s primary debate, is earnings.

I. Retail Behavior
1. Has retail started selling equities?
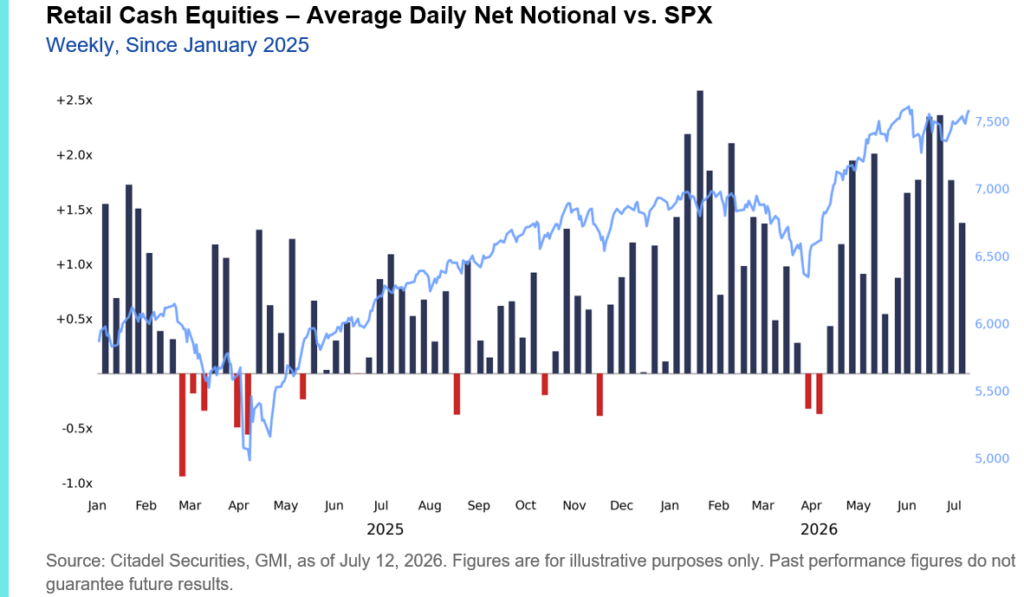
No. Retail remains the strongest structural buyer of US equities.
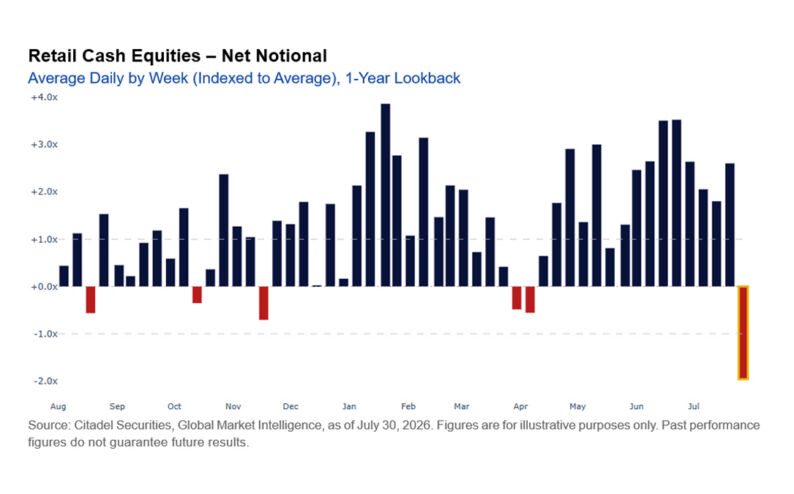
We have not seen a single net sell day on our retail cash equities platform in July. As is seasonally typical, retail is deploying more capital than average this month, with average daily net buying running ~3.2x the historical monthly average. July 2026 currently ranks as the second-strongest month for retail net buying since January 2020 and the strongest July in our dataset.
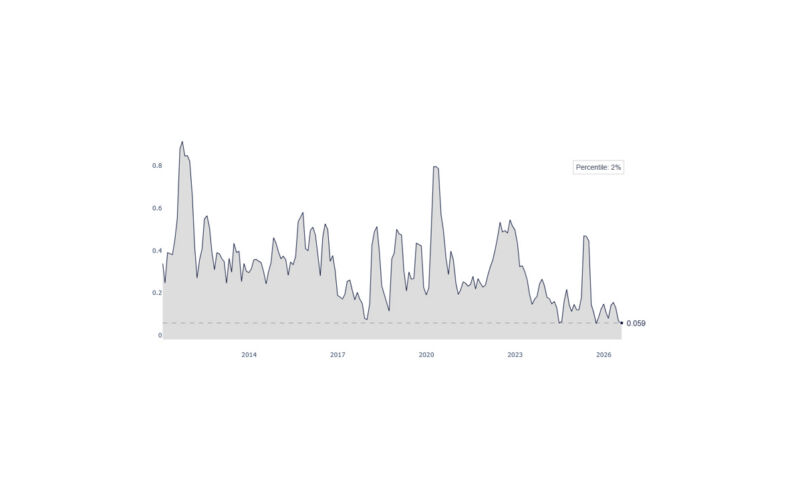
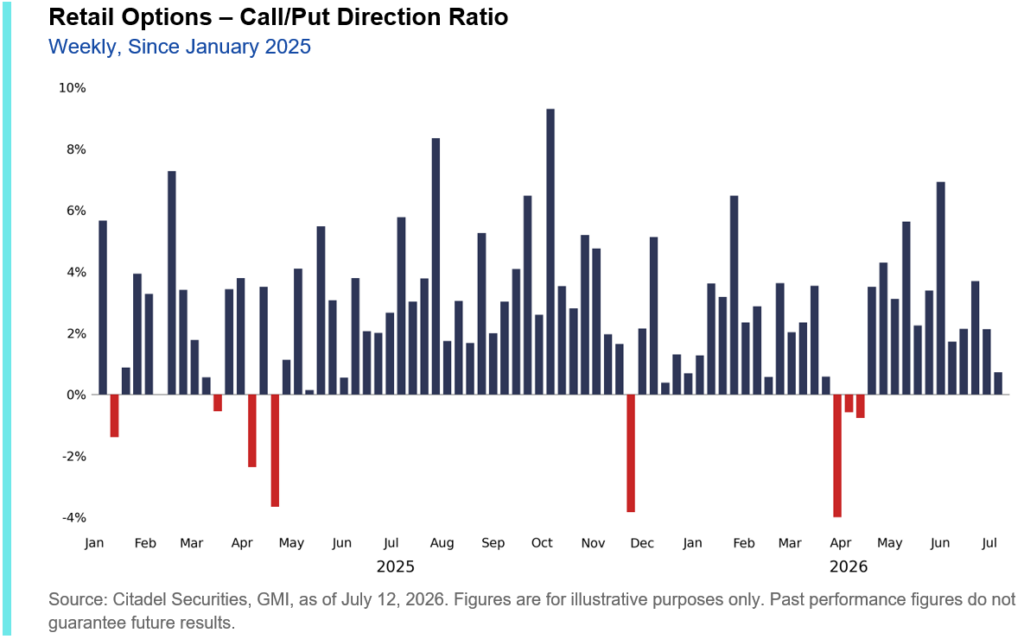
In options, retail flow is still skewed to buy based on our Call/Put Direction Ratio, although that skew has moderated, falling to the 16th percentile vs. the past year – its weakest reading since late March (a reflection of increased hedge buying).
2. Is retail selling momentum?
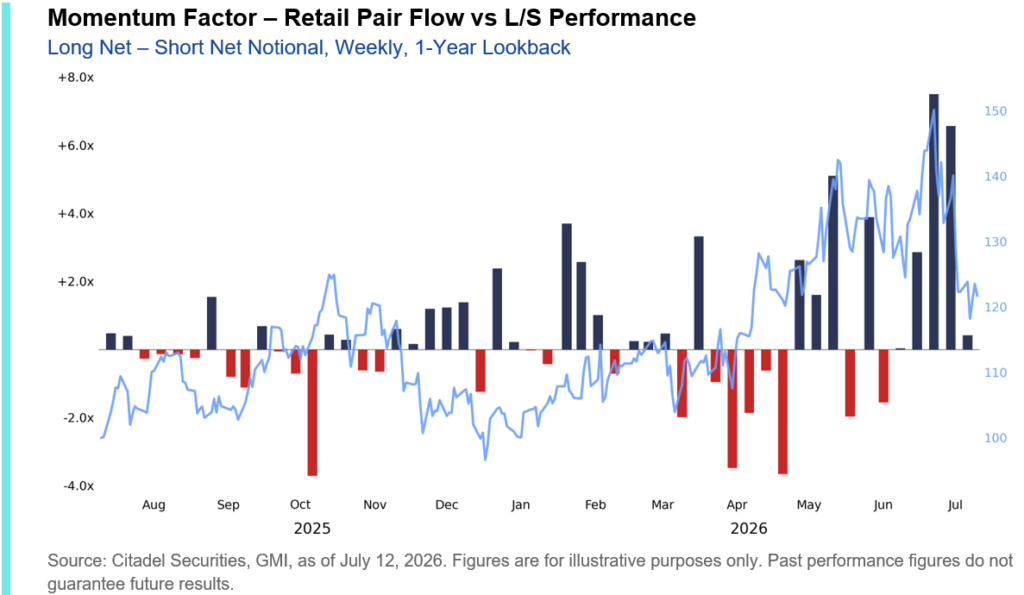
Not yet. The final week of June and the first week of July were the two strongest weeks of average daily net buying in our Long-Short Momentum pair ever observed on our platform, with net buying running ~2.5x above the one-year average. July 1st marked the largest single buying day on record for the pair, with net buying nearly 12x the trailing one-year average. Each of the four strongest buying weeks for momentum – and all six of the strongest buying days – have occurred within the past two months.
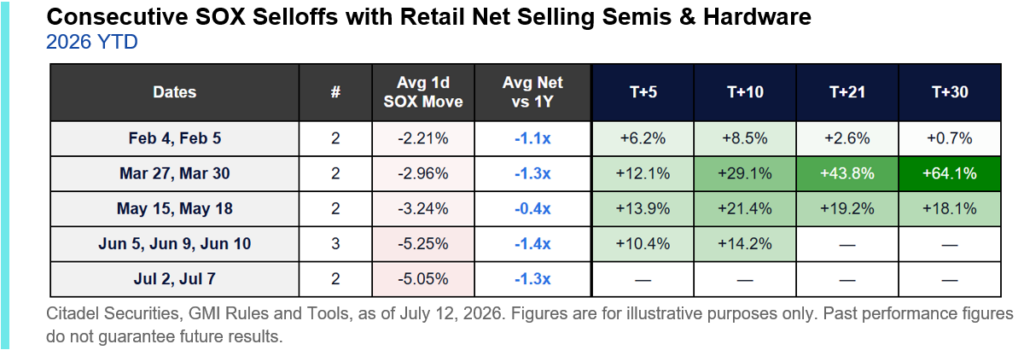
One area has begun to show signs of fatigue beneath the surface: semiconductor and hardware names. Retail sold semis and hardware names during the SOX’s two most recent down days, a rare departure from the persistent buy-the-dip behavior that has characterized this cycle.
Each was followed by a sharp rebound, with the SOX posting strong T+30 forward returns:
II. Technical Positioning
3. Has market stress become systemic?
No. The stress we’ve observed is idiosyncratic, not systemic.
Hedging demand has become increasingly concentrated beneath the index surface rather than across the broader market. Broad-based index/ETF skew remains contained, masking the activity in individual factors (particularly momentum) and single-name hedging.
- SPX 1-Month 25 delta put/call skew is in only the 10th percentile vs. the past year
- NDX 1-Month 25 delta put/call skew = 53rd percentile
- SOX 1-Month 25 delta put/call skew = 94th percentile
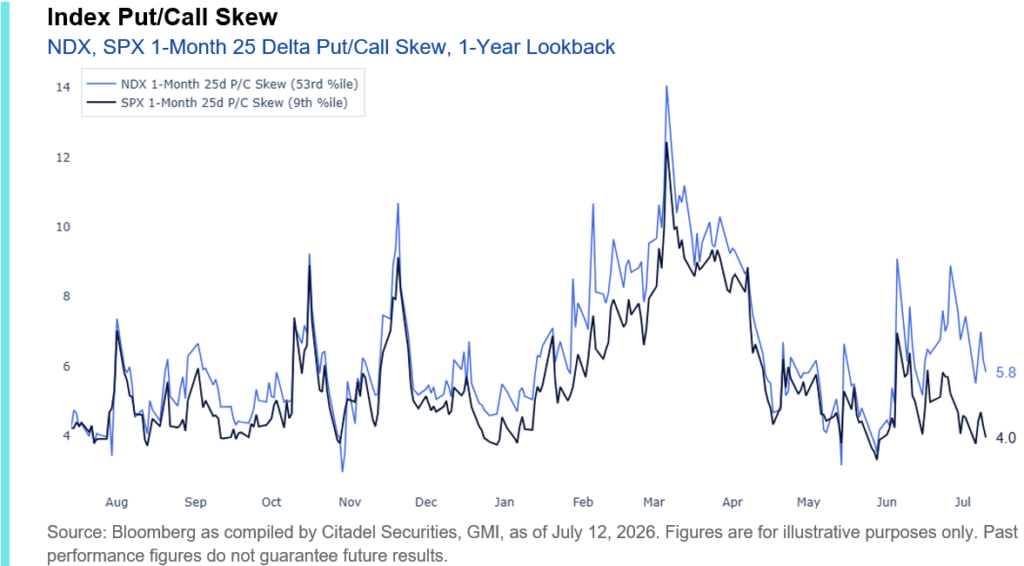
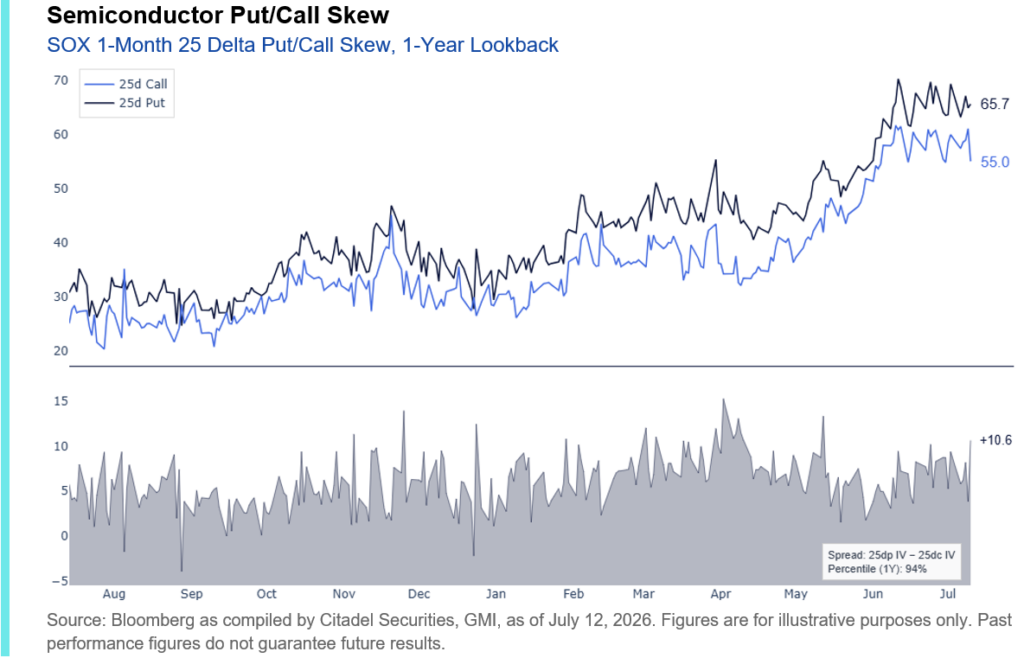
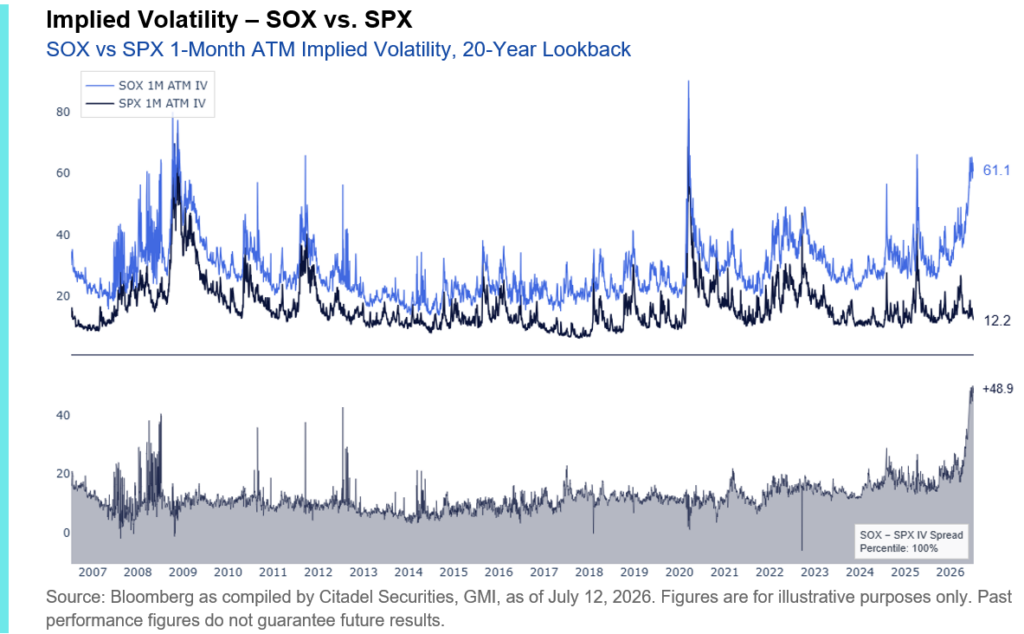
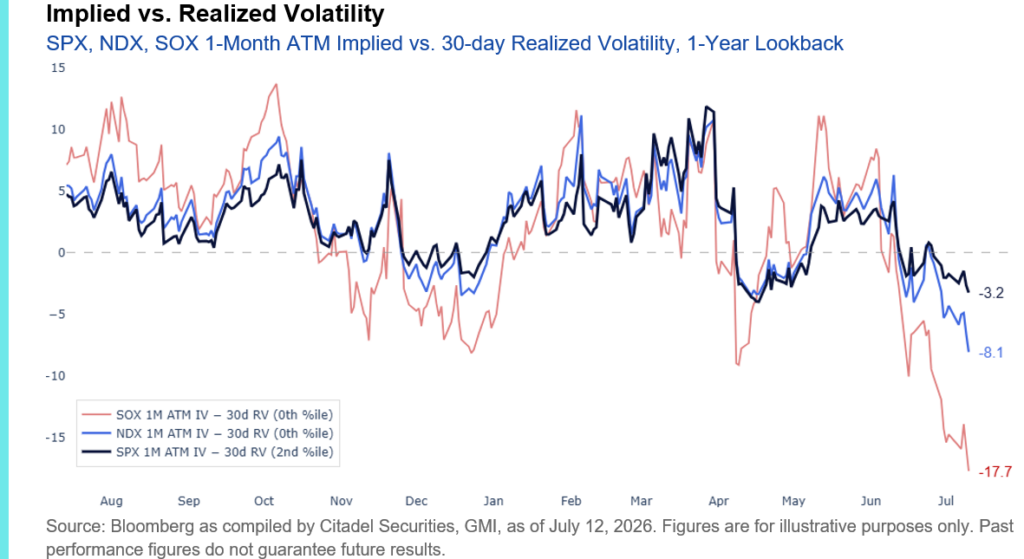
SOX and NDX implied volatility continue to trade at their largest premiums to SPX in a decade, highlighting the concentration of hedging demand in semiconductors and other growth-oriented exposures rather than the broader market. That said, 1-month implied volatility remains remarkably inexpensive relative to 30-day realized volatility across all three indices.
4. Is factor dispersion elevated?
Yes. Dispersion, not market beta, is defining today’s market.
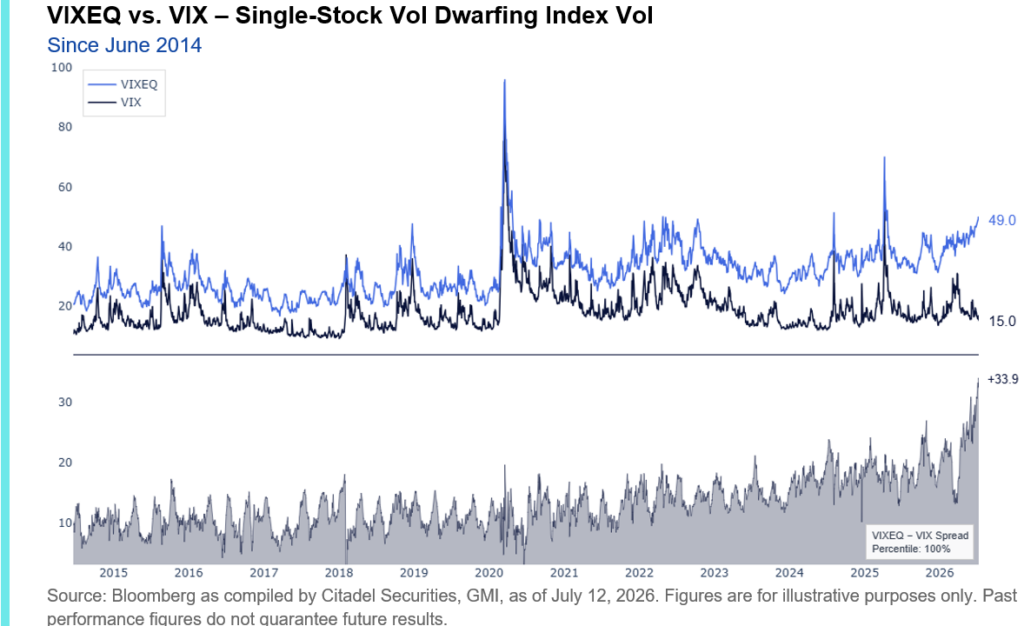
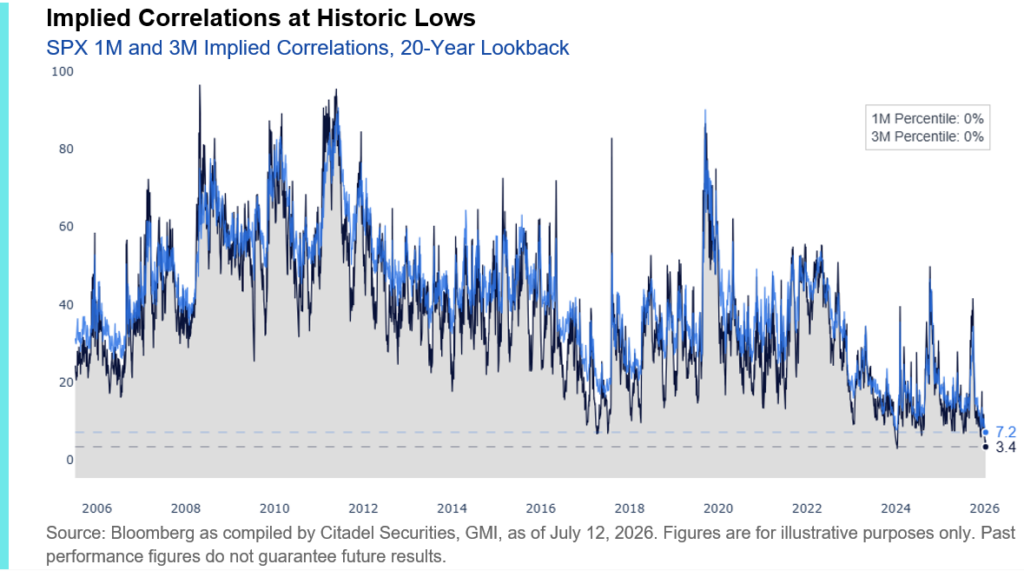
One of the most important developments beneath the surface is the spike in stock-level risk relative to index risk. The spread between VIXEQ and VIX reached a record high, while implied correlations remain near record lows. Rather than indiscriminately hedging market beta, investors are hedging specific sectors, factors, and single names – particularly in the momentum complex. This remains a market defined by stock selection rather than broad macro risk.
5. Are leveraged ETF rebalancing flows beginning to ease?
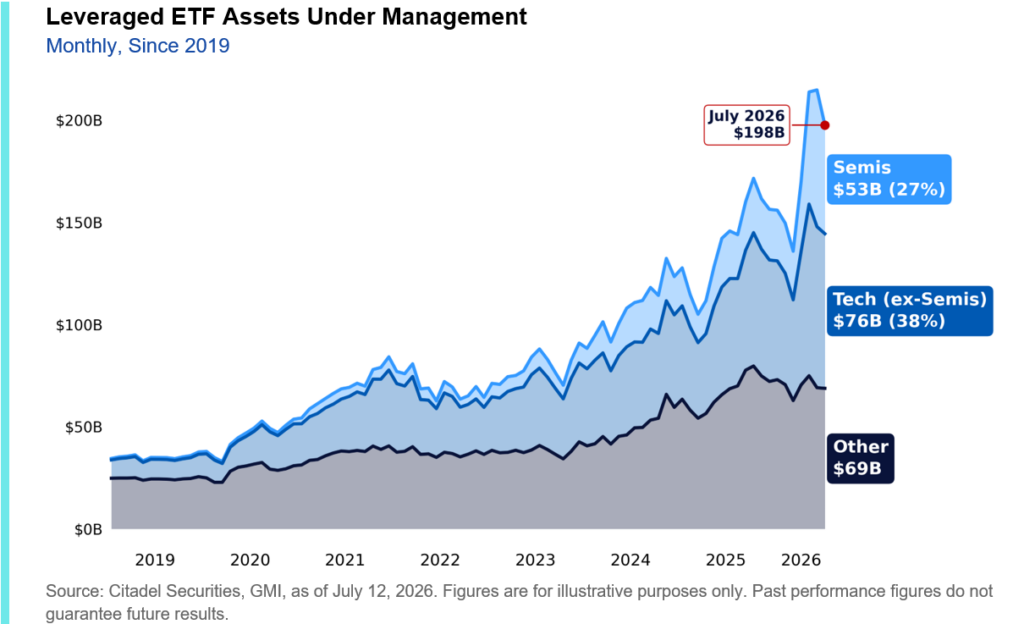
Yes. Leveraged ETF assets under management have contracted ~10%, from approximately $218 billion to $198 billion, reducing the magnitude of systematic rebalancing flows. Smaller AUM translates directly into lower mechanical rebalancing demand, reducing the magnitude of end-of-day flows.
Most of that contraction has come from semiconductor products, where AUM has fallen roughly 20%. By comparison, leveraged tech ETFs (ex. semis) are down approximately 5%, while all other leveraged products have declined roughly 2.5%.
6. Have funding conditions improved?
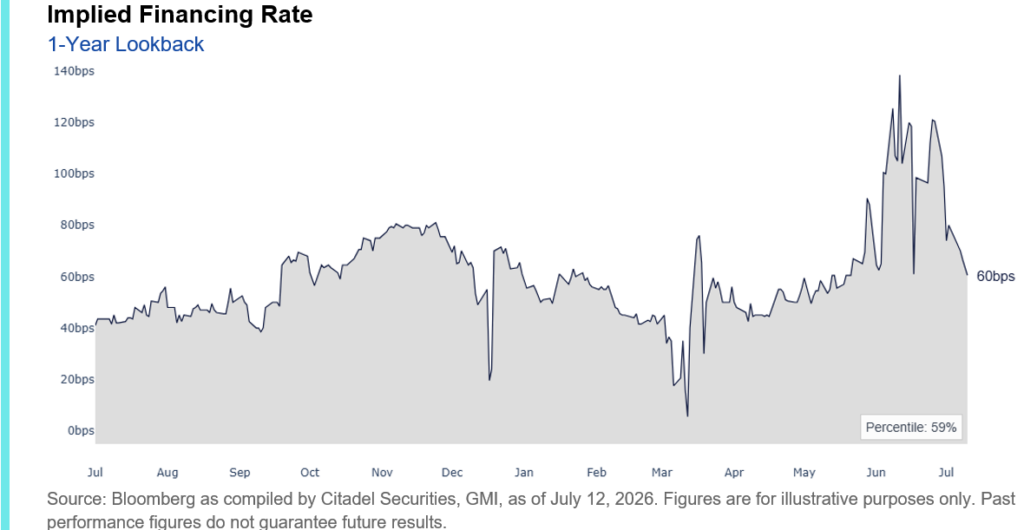
Yes. Funding conditions continue to improve. Easier financing conditions reduce the cost of maintaining long exposure and represent another incremental tailwind for equity positioning.
One-month equity financing spreads have eased materially from their recent peak of 138bps above SOFR and now trade near 60bps, roughly the 61st percentile vs. the past year.
III. Market Leadership
7. Is market leadership starting to broaden?
Yes. Market leadership is broadening. Rather than exiting the asset class, investors are reallocating within equities.
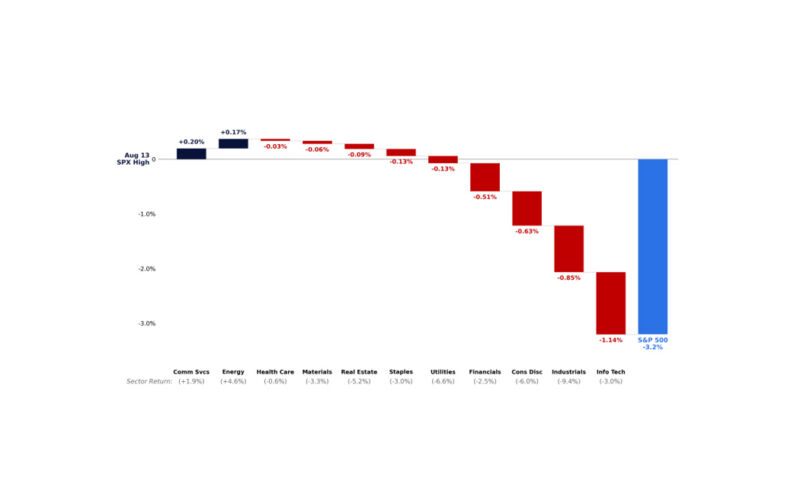
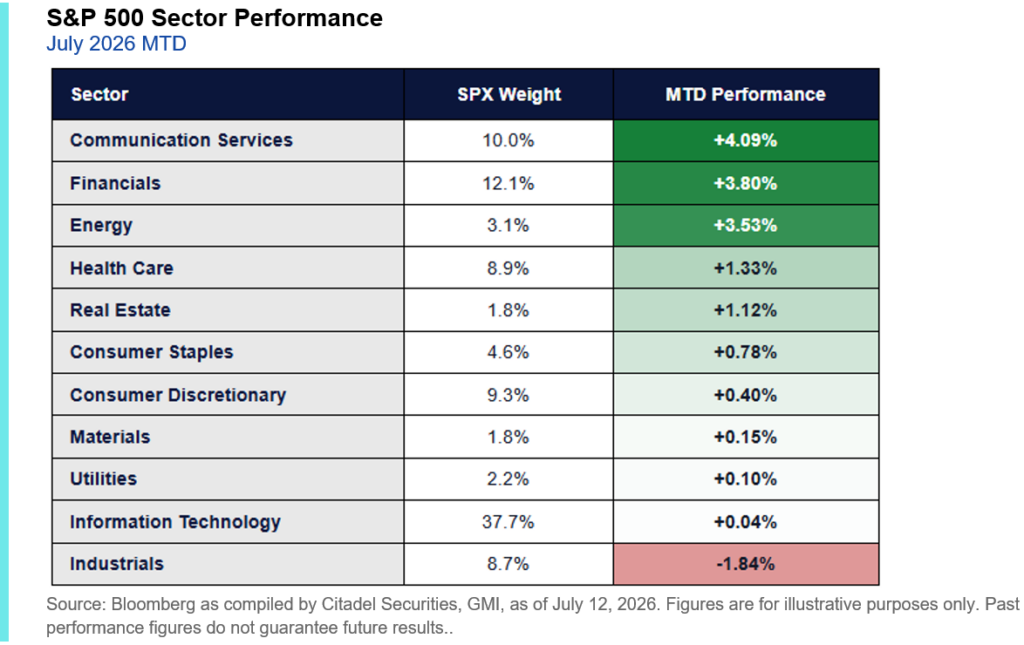
The S&P 500 has gained roughly 1% month-to-date even as tech has lagged. Instead of relying on the same narrow leadership, gains have been driven by sectors that underperformed during the first half of 2026, most notably Communication Services and Financials.
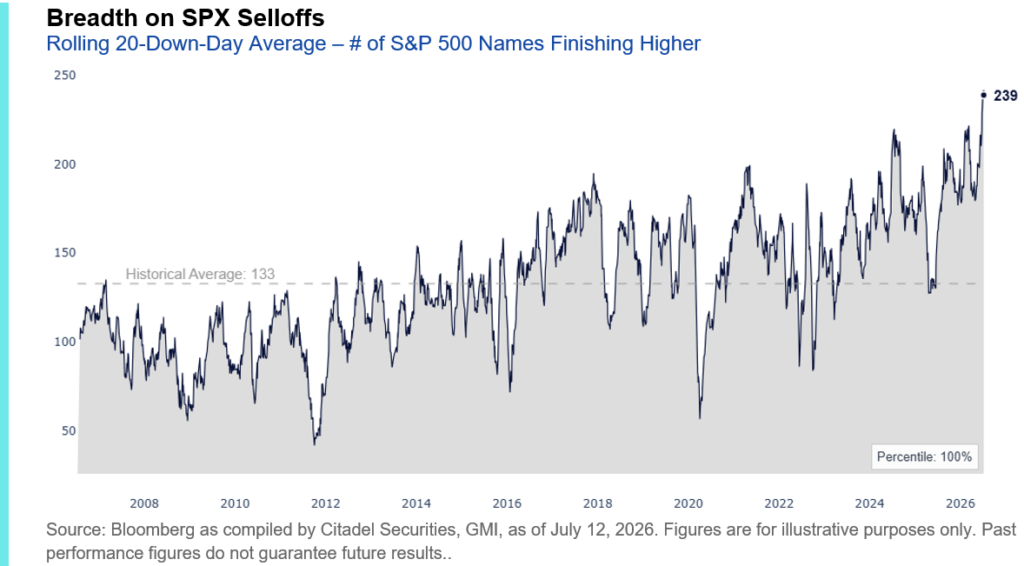
This rotation has become particularly evident on days when the index is weaker. Since the start of June, 9 of the last 14 S&P 500 down days (64%) have seen a majority of index constituents finish higher. Over the past year, that has occurred on just 32% of S&P 500 down days.
Average breadth on down days has nearly doubled. Over the last 20 SPX selloffs, an average of 239 constituents finished higher, compared to a 20-year average of 133.
8. Are valuations attractive?
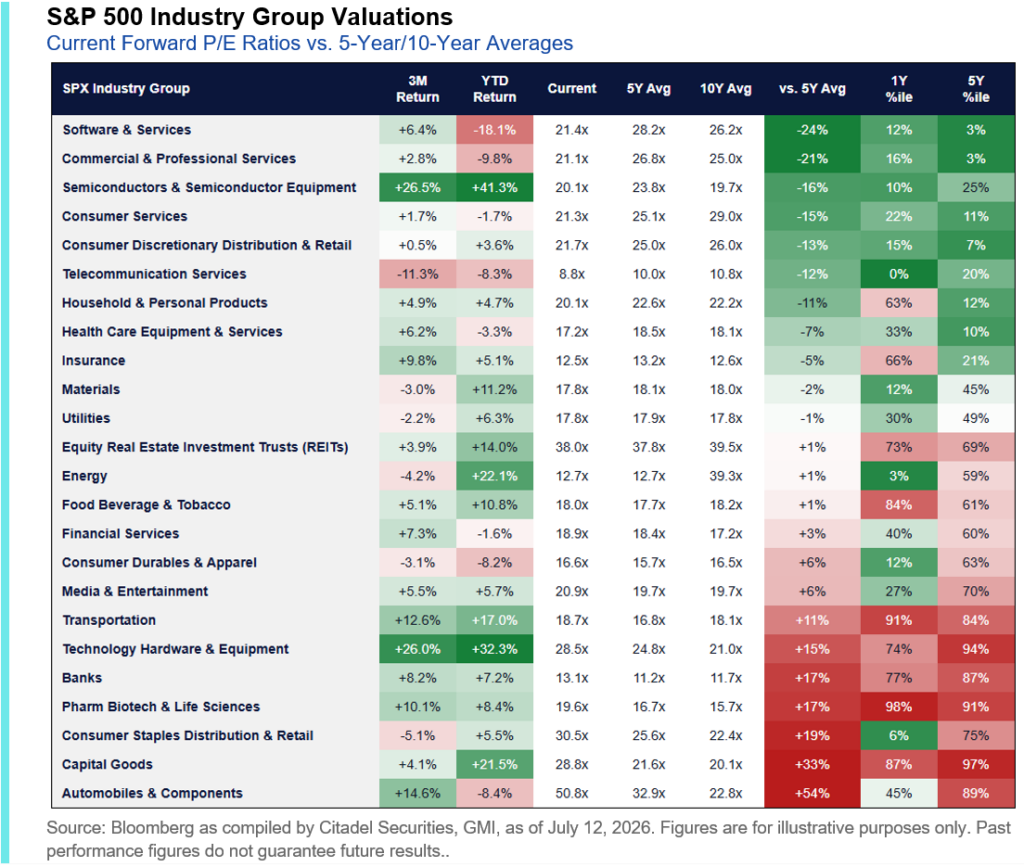
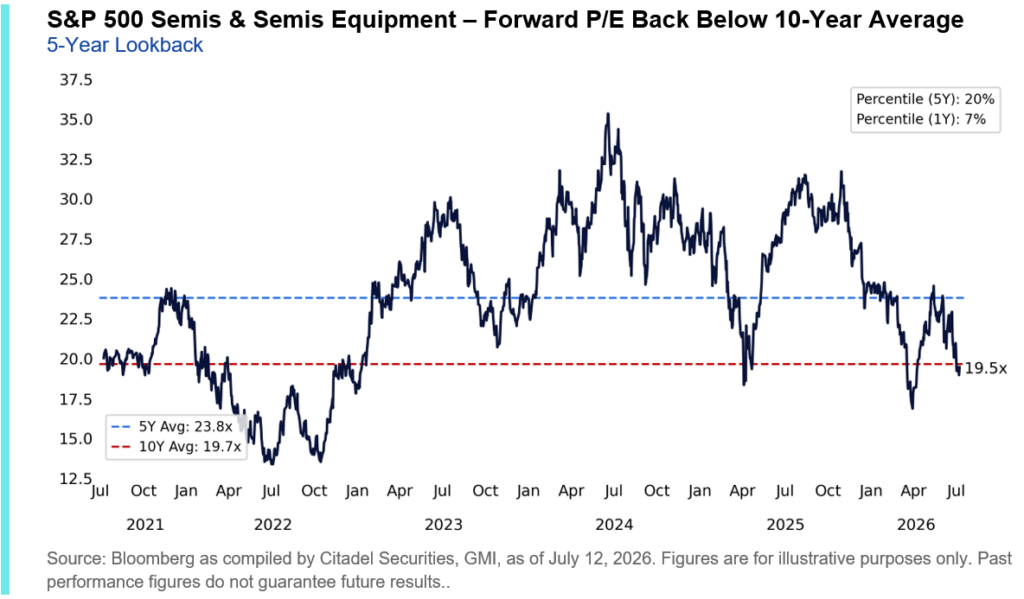
Yes. Despite the S&P 500 trading within 1% of all-time highs, S&P 500 Information Technology, the Nasdaq 100, and even the S&P 500 Semiconductor industry all trade below their respective 10-year average forward P/E multiples.
Some of the market’s highest-quality growth companies are entering earnings with valuation support rather than valuation headwinds.
IV. Earnings & Fundamentals
9. Can earnings meet expectations?
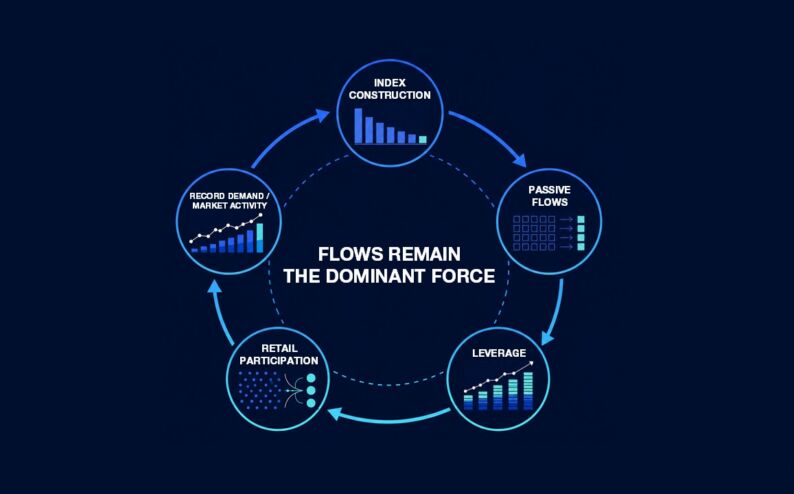
That is now the key question. Flows got us here. Earnings determine what comes next. With much of the positioning reset now behind us, focus is shifting back toward fundamentals as Q2 earnings season kicks off.
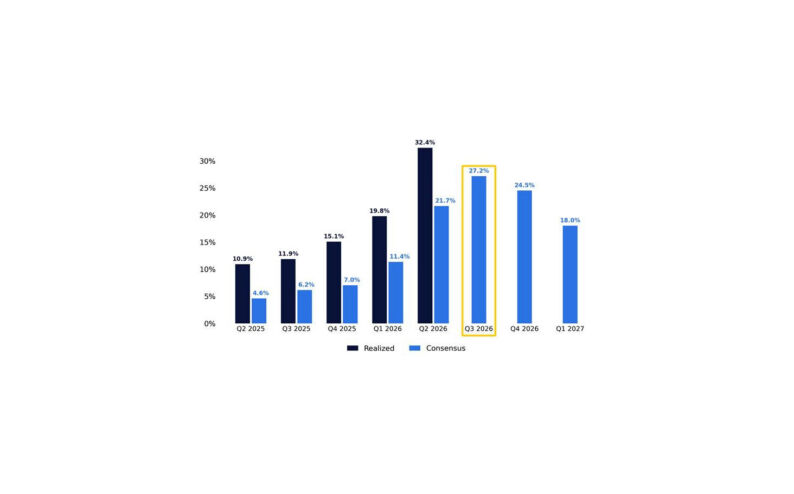
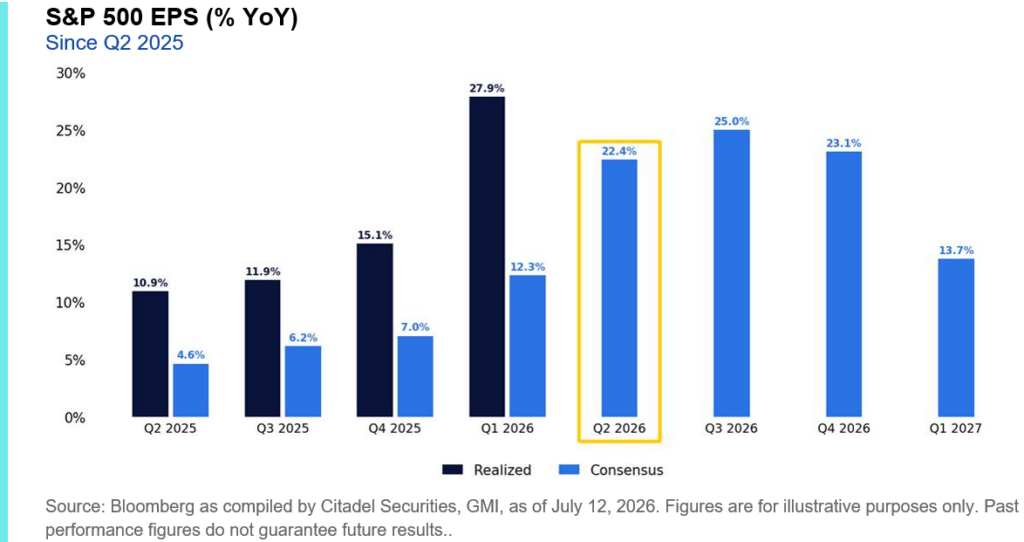
Consensus now expects 22.4% year-over-year EPS growth for the second quarter – if realized, this would rank among the strongest readings on record outside of major recession recoveries. Despite lower valuations, earnings expectations have continued to trend higher, a continuation of the pattern we observed ahead of Q1 earnings.
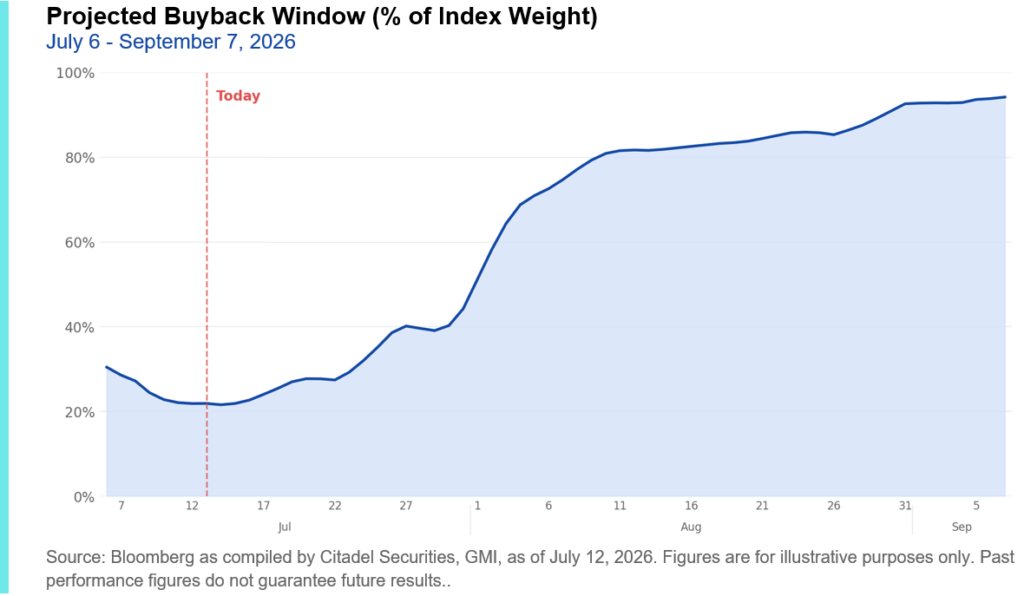
At the same time, the corporate buyback window is beginning to reopen. An increasing share of the S&P 500 will soon regain the ability to repurchase shares, bringing the market’s largest structural buyer back into equities.
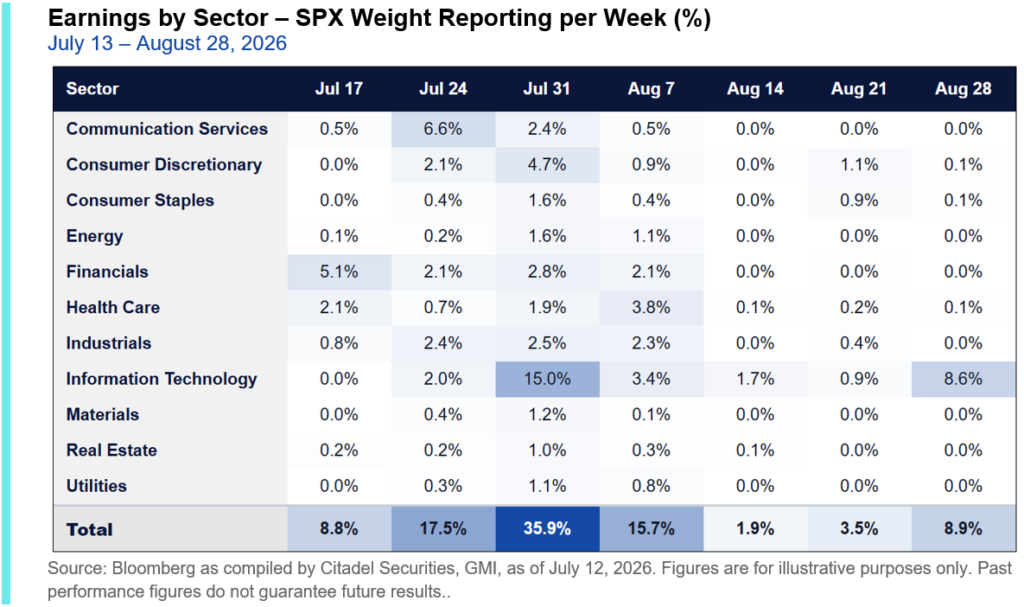
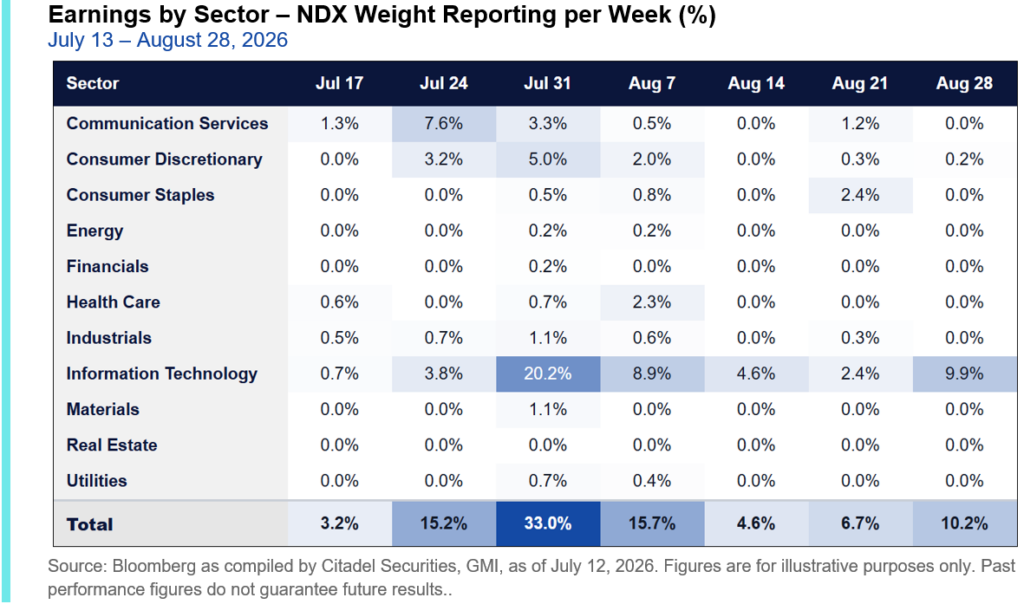
The final week of July will mark the “Super Bowl” of Q2 earnings. Approximately 36% of SPX and 33% of NDX by weight are expected to report between July 27 and July 31, including 4 of the Mag7. By month-end, roughly 60% of the S&P 500 is expected to have released results.
10. How significant are semiconductor earnings this quarter?
Very significant. Semiconductors have become the single most important industry for index performance heading into Q2 earnings.
The structural importance of semiconductors has accelerated dramatically over the past decade:
- 18% of the S&P 500 today
- 14% at the start of 2026
- 12% one year ago (July 2025)
- 5% five years ago (July 2021)
- 3% ten years ago (July 2016)
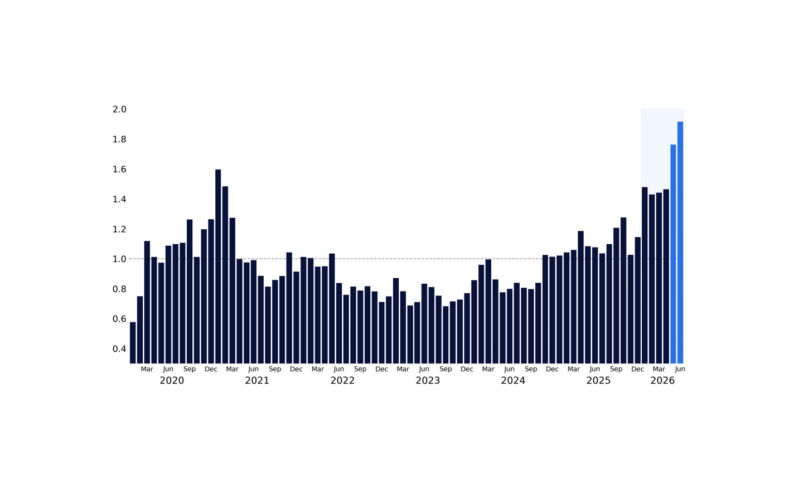
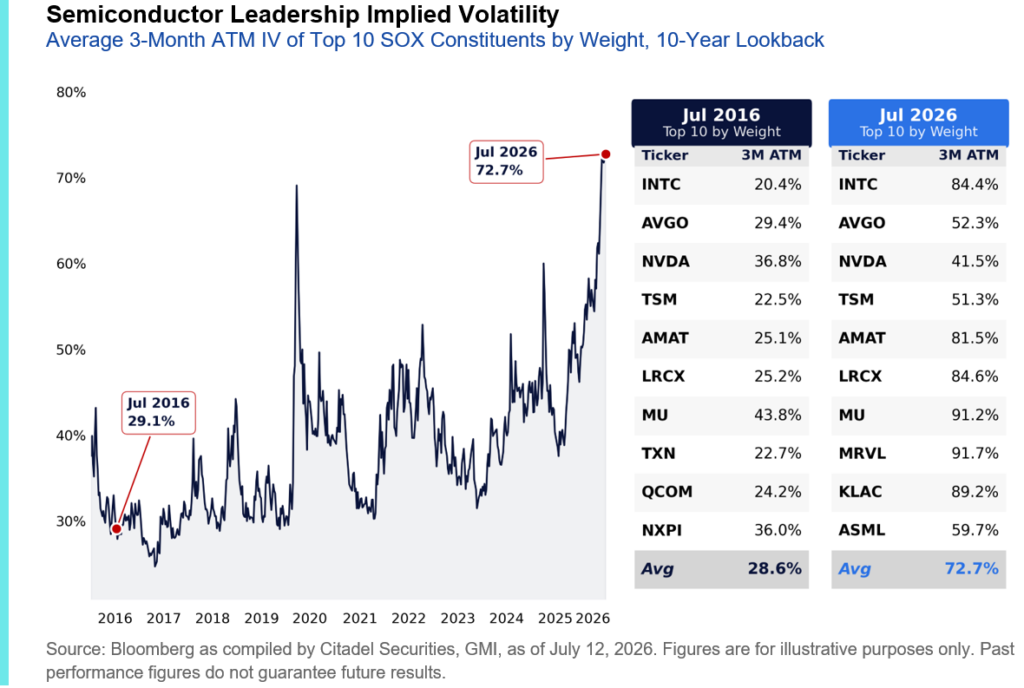
Alongside this dramatic increase in market capitalization, leverage, and retail participation, the semiconductor options market has undergone its own structural repricing. The average three-month implied volatility across the ten largest semiconductor companies has risen from 29% in 2016 to nearly 73% today – more than doubling over the past decade.
Unlike most industries, semiconductor companies report throughout the earnings calendar rather than in a single concentrated week, extending both the opportunity and the event risk across much of the remainder of July and through August.
As a result, earnings risk will remain elevated throughout much of July and August rather than being concentrated into a single week. Semiconductor earnings are no longer simply an industry event; they have become an index event.
GMI BOTTOM LINE
We believe the technical reset is largely complete.
Over the past two weeks, the market has worked through many of the positioning excesses that concerned us entering July. Retail demand remains exceptionally resilient, systematic headwinds have eased, market leadership is broadening, financing conditions have improved, and valuations have become more attractive.
The market’s attention now shifts from positioning back to fundamentals. The next two weeks will determine whether fundamentals can sustain the rally.

Copyright © Citadel Enterprise Americas LLC or one of its affiliates. All rights reserved.
Legal Entities Disseminating this Material: This material is disseminated in the United Kingdom by Citadel Securities (Europe) Limited (“CDGE”) authorized and regulated by the Financial Conduct Authority (“FCA”) (Registered company number: 05462867); in the European Union by Citadel Securities GCS (Ireland) Limited (“CSGI”) and its Paris Branch authorized and regulated by the Central Bank of Ireland (“CBI”) (Registration Number: C173437); in Hong Kong by Citadel Securities (Hong Kong) Limited (“CDHK”) licensed by the Securities and Futures Commission of Hong Kong (“SFC”), in Japan by Citadel Securities Japan Co., Ltd (“CSJC”) registered as a Type 1 financial instruments business operator with the Japan Financial Services Agency (“JFSA”); and in the United States of America by Citadel Securities LLC (“CDRG”) registered with the Securities Exchange Commission (“SEC”), Financial Industry Regulatory Authority (“FINRA”), and Securities Investor Protection Corporation (“SIPC”), Citadel Securities Institutional LLC (“CSIN”) registered with the SEC, FINRA, and SIPC, or Citadel Securities Swap Dealer LLC (“CSSD”) registered with the SEC, Commodities Futures Trading Commission (“CFTC”), and National Futures Association (“NFA”). Unless governing law permits otherwise, you must contact a Citadel Securities entity in your home jurisdiction if you want to use our services in effecting a transaction in any financial instruments or securities, including derivatives.
FOR INSTITUTIONAL USE ONLY; FOR PROFESSIONAL CLIENTS AND ELIGIBLE COUNTERPARTIES ONLY. This material is not intended as and does not constitute investment research. Contents of this material will be strictly limited to non-specific, generic information (i.e. macro events/topics) and are not subject to the Markets in Financial Instruments directive (MiFID II) or FINRA research rules. This material does not constitute an offer, solicitation, invitation, or inducement to purchase, acquire, subscribe to, provide, or sell any financial instrument or otherwise engage in investment activity. Please see additional important disclosures, including disclosures that may be relevant to your country of residence or business at www.citadelsecurities.com/GlobalSalesTrading.