Charles Dickens gave us one of literatureʼs most enduring expressions for the pull of anticipated fortune: Great Expectations. It is no secret that the AI economy has plenty of its own. Jensen Huangʼs recent case for compute as an “investable infrastructure asset” eloquently articulates those expectations as a standalone business model: compute produces revenues, serves a broad market, improves in performance over time and can be redeployed. The broader AI economy is similarly valued upon expectations of the durability of rents that can ultimately be extracted from models, compute and the application layer. Understanding the extent to which those assumptions are reasonable appears increasingly dependent on one economic variable: elasticity. Does making intelligence cheaper result in a large expansion of demand? We think the evidence from recent weeks tentatively points to yes.
Usage weighted token prices have declined 40% since the end of June (as measured by Silicon Data) yet we calculate that the month of July saw a circa 50% month over month increase in AI spend per employee among the top 1% of enterprises (using Ramp data). Further upstream, GPU rental markets remain firm relative to their June lows, while Q2 Hyperscaler cloud revenues suggest that incremental compute capacity is finding paying demand rapidly. Falling prices, in other words, appear to be expanding the quantity of intelligence consumed rather than diminishing the aggregate economic value of the ecosystem. Concerns around overbuilding compute capacity will persist, particularly because strong utilisation today tells us relatively little about the balance between supply and demand several years forward. A discontinuous improvement in model architecture in the future could reduce the compute required to produce a given unit of intelligence. Yet this risk underlines the centrality of elasticity. Cheaper intelligence may therefore be the mechanism through which consumption scales sufficiently to support the revenues embedded in todayʼs great expectations.
AI Spend Per Employee Rose Nearly 50% MoM in July Among the Top 1% of Firms
AI Spend per Employee/Month
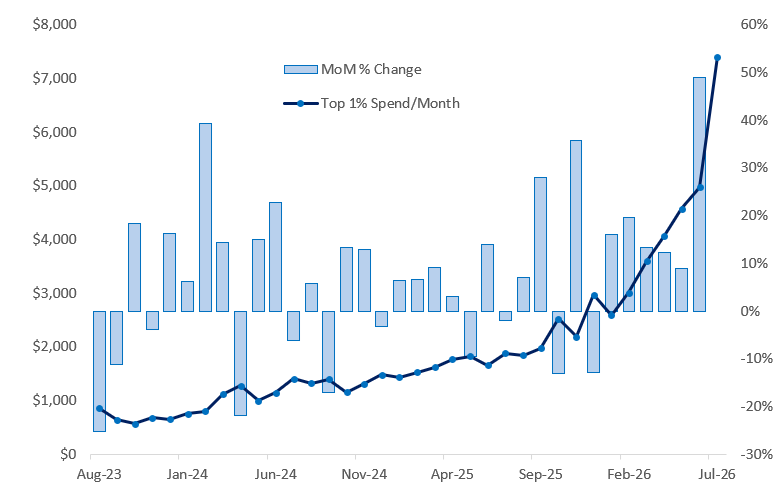
Source: Ramp AI Index (business spend data from Ramp. AI spend includes LLM subscriptions, coding agents, API tokens, and GPU cloud spend. Percentile assignment is by per employee spend on AI), Citadel Securities, Data as of July-2026
In our Tokenomics note in early June, we highlighted the challenge that the emerging decline in token-price baskets posed to the AI complex. High inference costs were encouraging substitution towards cheaper models and more efficient workflows, while market pricing appeared to be assuming compute scarcity far into the future. We think that the subsequent weakness in AI-linked asset prices, alongside the rising adoption of open-source models and model-serving platforms, provided some early validation of that view. We also flagged Jevons Paradox as a plausible offset: lower inference costs could ultimately stimulate enough incremental consumption to sustain, or even increase, aggregate demand for compute. At the time, however, we viewed that dynamic as second order relative to the degree of scarcity embedded in market expectations. The simultaneous decline in GPU rental and token prices into mid-June reinforced that concern, since it raised the possibility that end demand itself was weakening across the broader ecosystem. Arguably that relationship has since broken down. GPU rental prices measured by Ornn have rebounded in recent weeks while token prices have continued to decline substantially. What appears to be an emerging divergence between token and compute prices is important and offers tentative evidence that the Jevons paradox dynamic is becoming more dominant: cheaper intelligence appears to be generating enough additional usage to sustain demand for the underlying compute. These markets remain young, fragmented and considerably more opaque than financial markets, so the signal warrants some caution, but we consider the change in their relationship to be encouraging.
Compute Rental Costs Have Rebounded As Token Prices Have Declined
H100 GPU Rental Price vs Silicon Data Token Price Expenditure Index
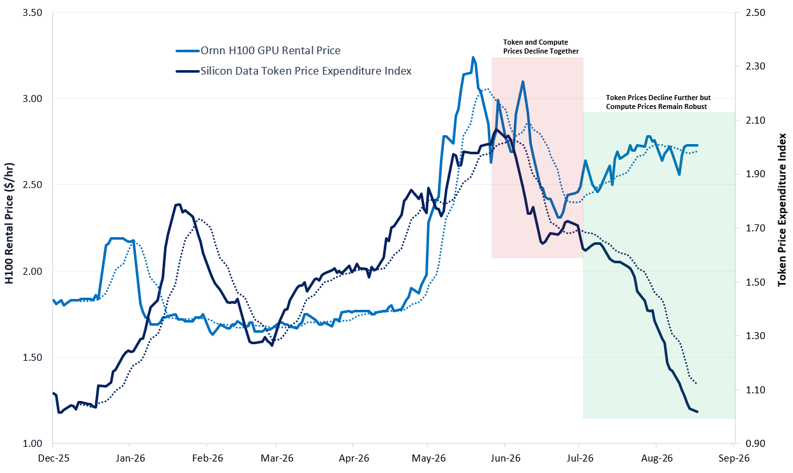
Source: Ornn, Silicon Data, Bloomberg, as compiled by Citadel Securities, data as of Aug 2026. Figures are for illustrative purposes only. Past performance figures do not guarantee future results.
Furthermore, compute looks to be increasingly acquiring the characteristics of a commodity: physical capacity is finite in the short run, requiring spot prices to clear available supply against prevailing demand. The term structure therefore contains useful information for investors, embedding expectations around future scarcity, capacity additions and the economics of owning compute infrastructure. The current degree of backwardation looks relatively benign. In mid-July, H100 spot prices were around 13% above 36-month term rates, while the equivalent premium for B200 compute was around 8% according to Silicon Data. Some backwardation is intuitive given the pace of capacity additions and technological obsolescence, with the shallower curve for newer-generation B200s particularly notable. Kalshi has recently added another source of price discovery, constructing market-implied compute forward curves from trading across its prediction markets. Their spot price time series implies H100 pricing declined 41% from its May peak but has since recovered 20% from the June lows and remained relatively stable. More importantly, newer Blackwell chips arguably provide a cleaner read on marginal demand for state-of-the-art AI compute. Kalshiʼs B200 pricing currently sits around $6.17/hr and has proved relatively resilient in recent weeks, and now trades above the May peak. Taken together, the spot price dynamics and term structure could offer another tentative indication of ecosystem wide elasticity further up the stack: falling token prices and improving inference efficiency have so far coexisted with firm pricing for the physical compute on which greater consumption ultimately depends.
Compute Forward Curves Show Some Backwardation
Silicon Data 6m Forward Points for H100 and B200 Compute
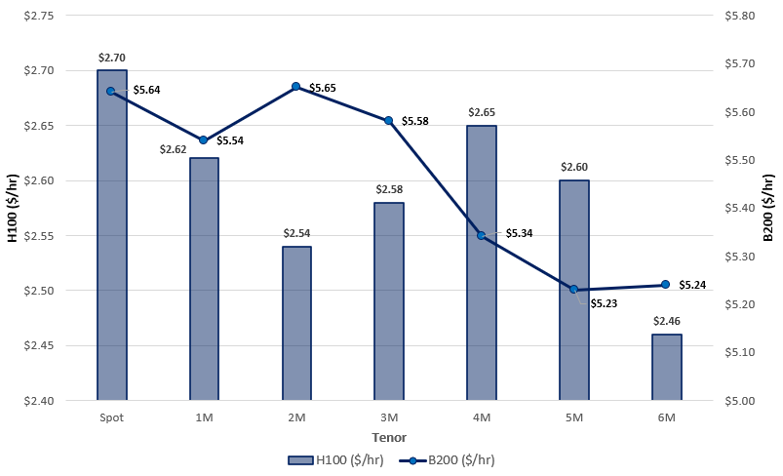
Source: Silicon Data Compute Forward Curve, compiled by Citadel Securities, data as of Aug 2026. Figures are for illustrative purposes only. Past performance figures do not guarantee future results.
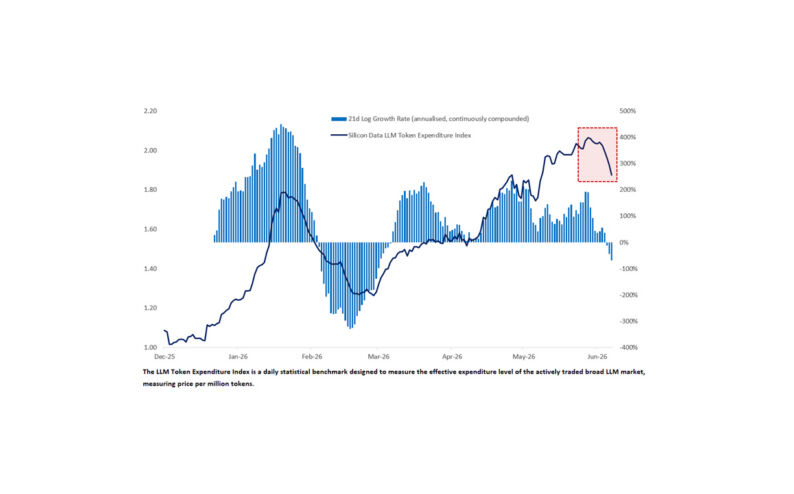
Tokens themselves are far from homogeneous, and any definitive claim that intelligence is becoming cheaper ultimately requires some adjustment for quality: more capable models generally command higher token prices. The relevant price is therefore the cost of completing a useful unit of work, rather than the price of an individual token. The growing availability and adoption of capable open-weight models suggests that model capability is already sufficient for a meaningful share of the workloads AI is currently being asked to perform, allowing users to substitute towards cheaper models without a commensurate loss of useful output. We can therefore infer that the cost of intelligence per unit of effective output is declining, consistent with the spend data suggesting an elastic demand response. Silicon Dataʼs recent decomposition offers some additional support: weakness in its aggregate token index has increasingly reflected declining costs among closed-source models, while the arrival of more capable and relatively expensive open-weight models such as Kimi K3 has placed upward pressure on average pricing within the open-weight segment. Cheaper intelligence can support greater consumption across the broader ecosystem while the growing capability and adoption of open-weight models places pressure on the rents available to closed-source frontier labs, a tension that remains unresolved.
The Decline in Token Pricing Has Been Precipitous
Silicon Data LLM Expenditure Index, Level and 21d Log Growth Rate (Annualized)
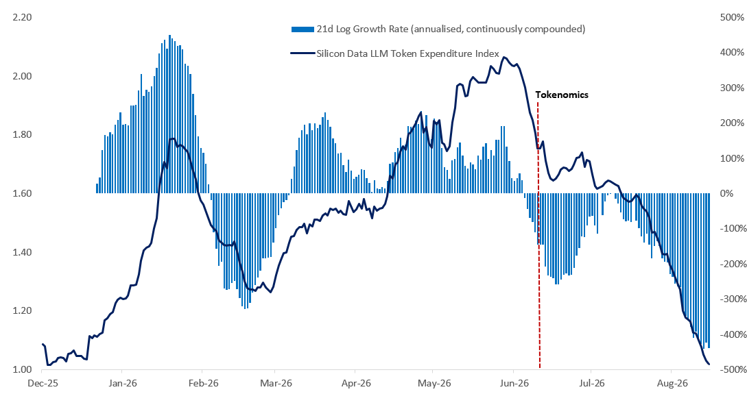
Source: Silicon Data, Bloomberg, Citadel Securities, Jun-26. Figures are for illustrative purposes only. Past performance figures do not guarantee future results.
We consider the key difficulty in identifying the relative elasticities within the AI complex to be the paucity of good data across both price and quantity. The contemporaneous decline in token and compute prices in June, followed by their subsequent divergence, offers some information about the underlying demand response, but the scale of the decline in token prices makes the quantity side increasingly important. Here we turn to monthly AI spend data from the Ramp AI Index, which uses transaction data from more than 70,000 firms to observe how expenditure is evolving as the effective price of intelligence falls. The results are striking. In July, AI spend per employee increased 49% month on month among the top 1% of firms, 25% among the top 10% and 9% at the median, using the latest vintage of Ramp data. The distribution is also becoming increasingly concentrated. Since October 2023, monthly AI spend per employee among the top 1% has increased by $6,542 versus the $9.63 increase at the median, while the ratio of 90th-percentile to median spend has doubled from 27x to 54x. The demand response therefore appears strongest among firms already furthest along the AI adoption curve, with the upper tail pulling away rapidly as the cost of intelligence falls. The firms that already know how to consume intelligence are responding most strongly as its price falls. Given the free fall in token prices, rising expenditure of this magnitude is precisely the pattern one might expect from an elastic demand response: lower unit costs are being met with a sufficiently large increase in consumption to drive aggregate spending higher.
AI Spend Per Employee Rose 25% MoM in July Among the Top 10% of Firms
AI Spend per Employee/Month
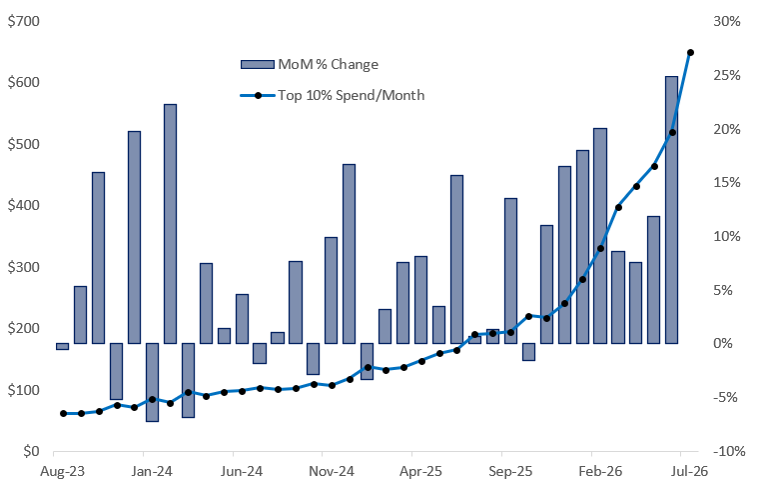
Source: Ramp AI Index (business spend data from Ramp. AI spend includes LLM subscriptions, coding agents, API tokens, and GPU cloud spend. Percentile assignment is by per employee spend on AI), Citadel Securities, Data as of July-2026
Turning to markets, three observations stand out. First, earnings growth looks exceptionally strong at the macro level. Q2 is tracking towards one of the largest beats on record, with S&P 500 EPS growth running at approximately 33%, the strongest pace outside post-recession recoveries, and driving the steepest earnings revision path since at least 2000. Second, Hyperscaler cloud revenues look encouraging, with earnings reporting pointing to revenues reaching $106.3bn in Q2 2026, up approximately 43% year on year and 15% quarter on quarter, providing a powerful indication that the enormous capital committed to compute is finding revenue-generating demand.
Q2 Is Tracking One of the Strongest Earnings Revision Paths on Record
Since Q1ʼ2000 (106 Quarters), Indexed to the Start of Earnings Month
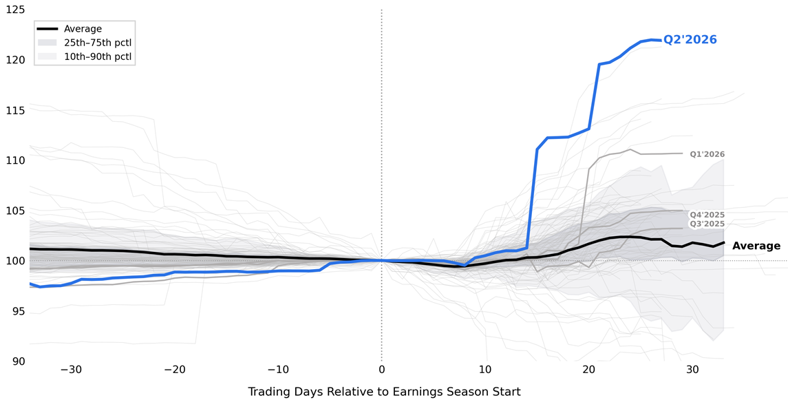
Source: Bloomberg as compiled by Citadel Securities, Global Market Intelligence, as of August 10, 2026. Figures are for illustrative purposes only. Past performance figures do not guarantee future results.
Hyperscaler Cloud Revenues Are Growing
Quarterly Cloud Revenues at Hyperscalers
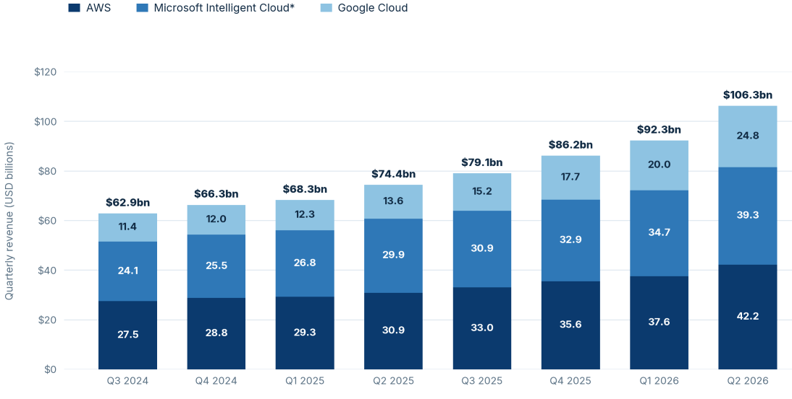
Source: Bloomberg as compiled by Citadel Securities, data as of Aug 2026. Figures are for illustrative purposes only. Past performance figures do not guarantee future results.
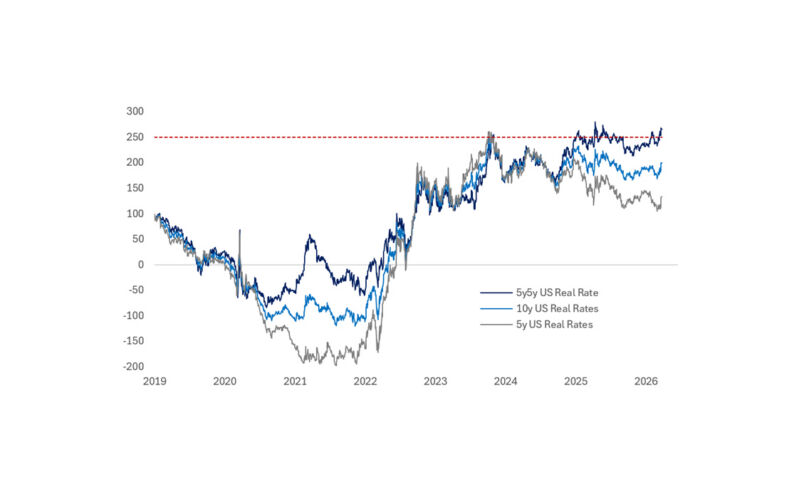
Finally, our cross-asset decomposition framework suggests that macro markets remain far from euphoric. Our measure of the growth impulse embedded in asset prices, the PC1 factor, currently sits at +0.84σ, or the 65th percentile of its five-year history. This is the channel through which a positive AI impulse would typically filter into macro assets, via higher real rates and stronger performance of risky assets. Against the strength of Q2 earnings, Hyperscaler revenues and the acceleration in AI expenditure through July, that reading looks relatively restrained. For all the rhetoric of exuberance surrounding AI, the expectations embedded in cross-asset markets are do not appear euphoric. Reconciling AIʼs great expectations with rapidly declining token prices requires a highly elastic demand curve. The evidence from July suggests that we may have one.
Cross-Asset Growth Pricing Does Not Appear Particularly Elevated
First Principal Component of our Cross Asset Macro Decomposition
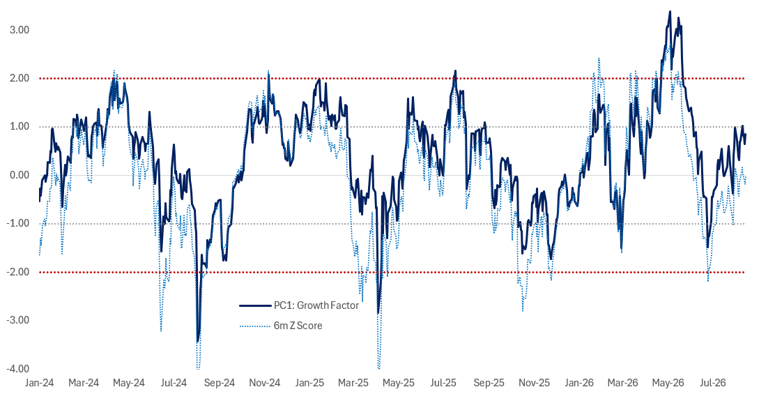
Source: Bloomberg as compiled by Citadel Securities, data as of Aug 2026. Figures are for illustrative purposes only. Past performance figures do not guarantee future results.
Copyright © Citadel Enterprise Americas LLC or one of its affiliates. All rights reserved.
Legal Entities Disseminating this Material: This material is disseminated in the United Kingdom by Citadel Securities (Europe) Limited (“CDGE”) authorized and regulated by the Financial Conduct Authority (“FCA”) (Registered company number: 05462867); in the European Union by Citadel Securities GCS (Ireland) Limited (“CSGI”) and its Paris Branch authorized and regulated by the Central Bank of Ireland (“CBI”) (Registration Number: C173437); in Hong Kong by Citadel Securities (Hong Kong) Limited (“CDHK”) licensed by the Securities and Futures Commission of Hong Kong (“SFC”), in Japan by Citadel Securities Japan Co., Ltd (“CSJC”) registered as a Type 1 financial instruments business operator with the Japan Financial Services Agency (“JFSA”); and in the United States of America by Citadel Securities LLC (“CDRG”) registered with the Securities Exchange Commission (“SEC”), Financial Industry Regulatory Authority (“FINRA”), and Securities Investor Protection Corporation (“SIPC”), Citadel Securities Institutional LLC (“CSIN”) registered with the SEC, FINRA, and SIPC, or Citadel Securities Swap Dealer LLC (“CSSD”) registered with the SEC, Commodities Futures Trading Commission (“CFTC”), and National Futures Association (“NFA”). Unless governing law permits otherwise, you must contact a Citadel Securities entity in your home jurisdiction if you want to use our services in effecting a transaction in any financial instruments or securities, including derivatives.
FOR INSTITUTIONAL USE ONLY; FOR PROFESSIONAL CLIENTS AND ELIGIBLE COUNTERPARTIES ONLY. This material is not intended as and does not constitute investment research. Contents of this material will be strictly limited to non-specific, generic information (i.e. macro events/topics) and are not subject to the Markets in Financial Instruments directive (MiFID II) or FINRA research rules. This material does not constitute an offer, solicitation, invitation, or inducement to purchase, acquire, subscribe to, provide, or sell any financial instrument or otherwise engage in investment activity. Please see additional important disclosures, including disclosures that may be relevant to your country of residence or business at www.citadelsecurities.com/GlobalSalesTrading.