I remain bullish on U.S. equities over the medium term, but we are becoming more tactically cautious following our bullish equity call from late March. The equity market may be vulnerable to a potential flow-of-funds unwind in the short term.
The S&P 500 is now up ~17% from the March 30th low, adding ~$10 trillion in market cap in less than seven weeks. The move has been supported by stronger-than-expected earnings, resilient corporate demand, and a powerful improvement in market structure.
The setup today, however, looks materially different from what it did in late March. The market is no longer under-owned, under-positioned, and heavily hedged. Instead, many of the
Our framework for evaluating the current setup breaks down into 10 key themes across fundamentals, flows, positioning, and market internals:
I. Fundamentals: Q1 earnings validated the rally, with the strongest reporting season since the post-COVID era with AI increasingly becoming an earnings story rather than just a narrative.
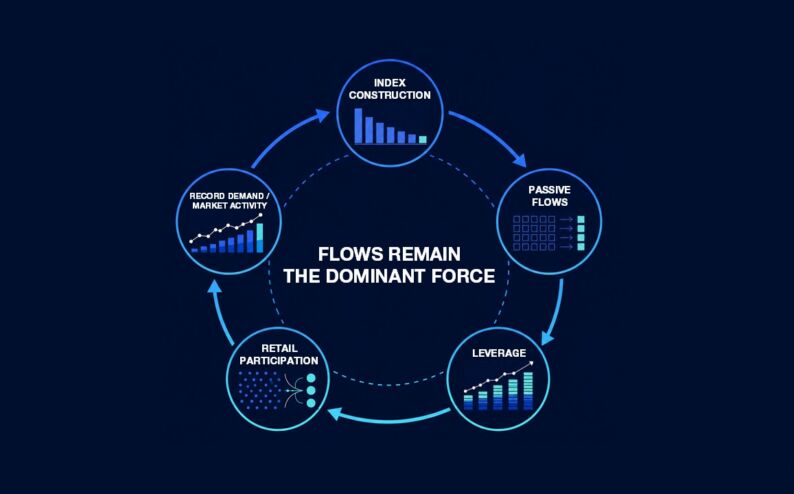
II. Flows: Passive inflows, buybacks, retail participation, and levered ETF exposure have all accelerated alongside the rally, but many of these same flows now leave the market increasingly vulnerable to a short-term unwind if momentum begins to stall.
III. Positioning: Systematic exposure has rebuilt sharply, downside hedging demand has collapsed, and the market has increasingly shifted toward a “spot up, vol up” regime driven by upside call chasing.
IV. Internals: Breadth remains historically narrow, the rally remains heavily concentrated in mega-cap technology, and the market no longer appears heavily hedged beneath the surface.
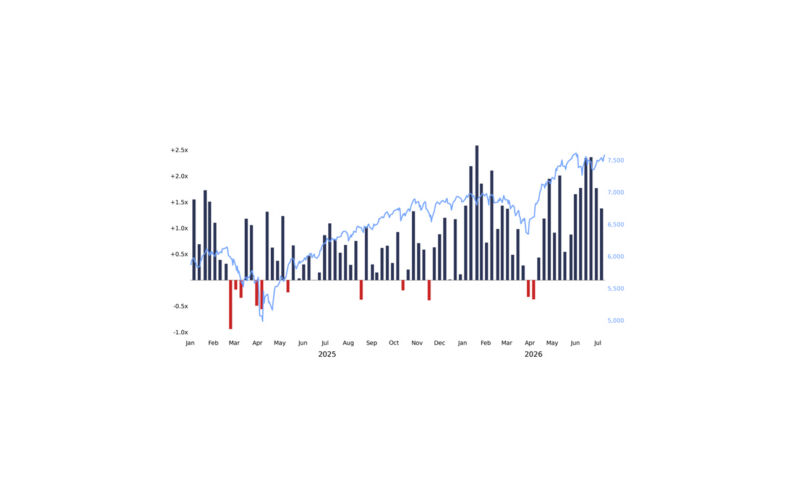
From Capitulation to All-Time Highs
SPX 500 Recovery Timeline, March 2 – May 15, 2026
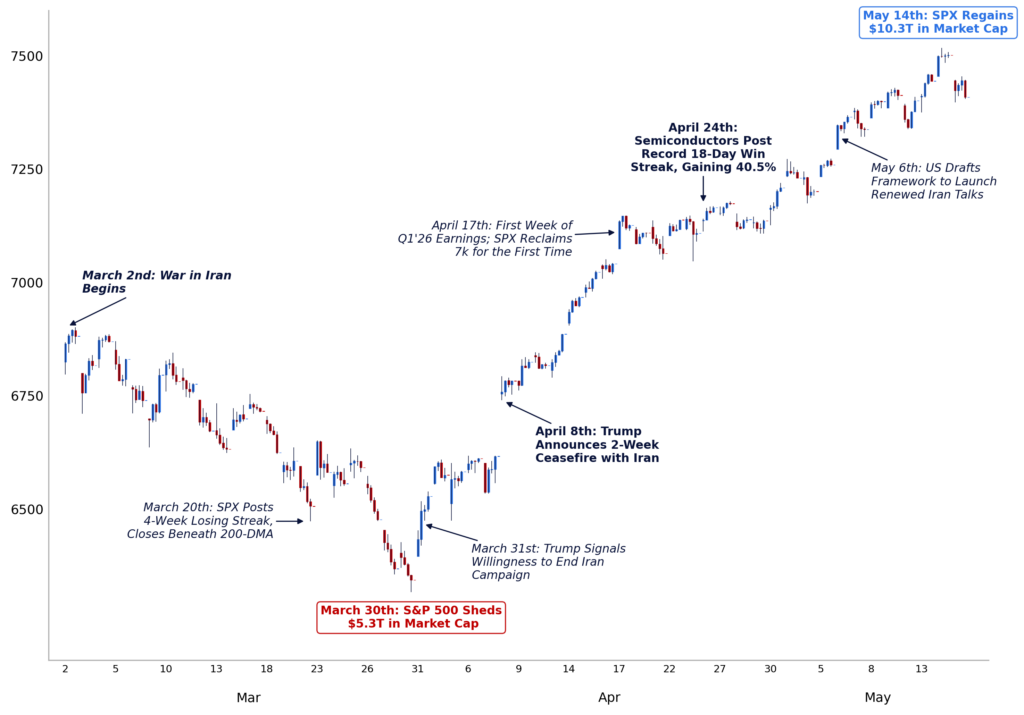
Source: Bloomberg as compiled by Citadel Securities, GMI, as of May 17, 2026. Figures are for illustrative purposes only. Past performance figures do not guarantee future results

I. Fundamentals
1. Q1 Earnings
Q1 earnings proved the economy was stronger than expected.
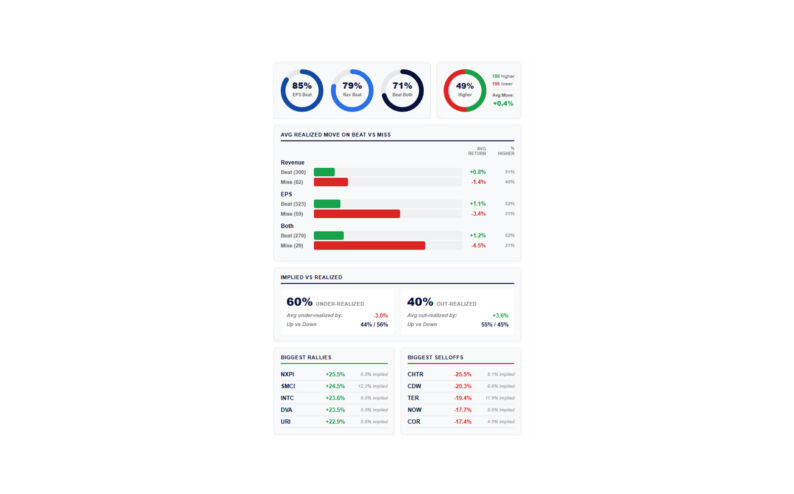
The S&P 500 is on pace for its best reporting season since the post-COVID era, with EPS growth tracking +25.1% YoY, versus +13% expected heading into the quarter. 84% of companies beat EPS estimates, the highest beat rate since Q4 2021.
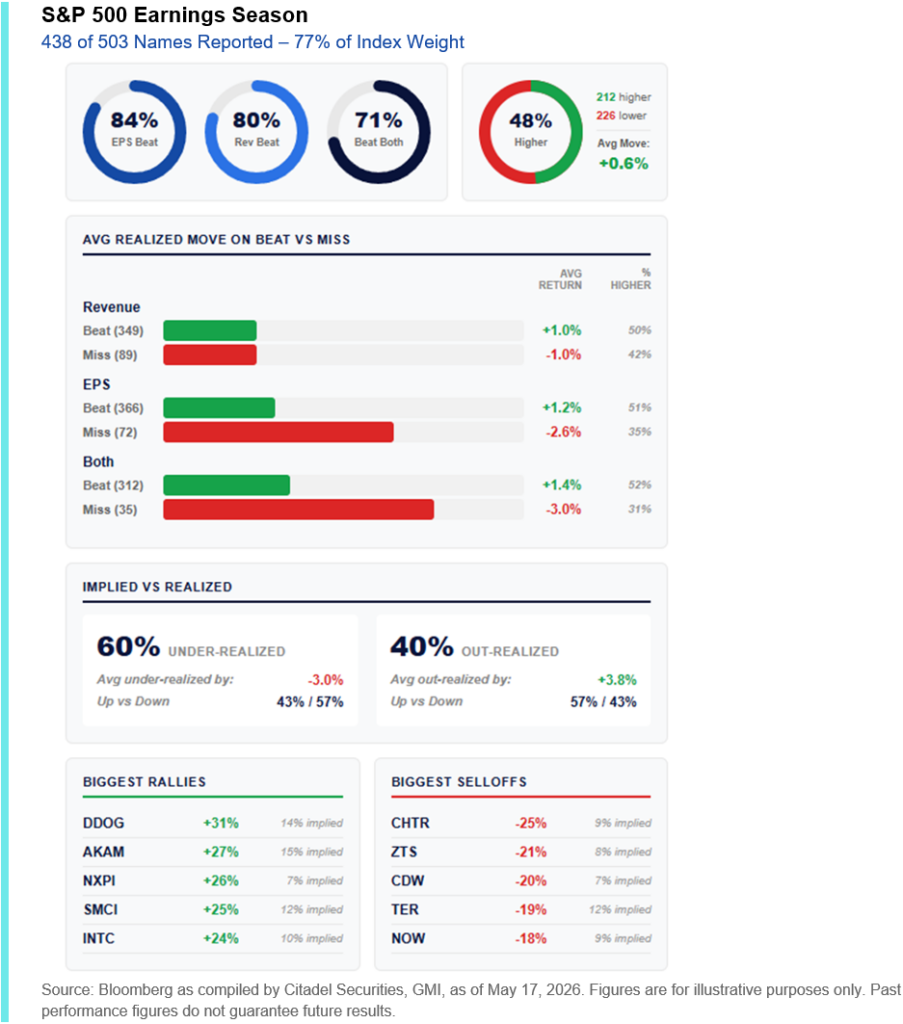
Importantly, this was not a “low bar” quarter. Expectations entered earnings season elevated (highest since 2021) and continued moving higher as companies reported. The revision cycle remained firmly positive, particularly within large-cap tech.
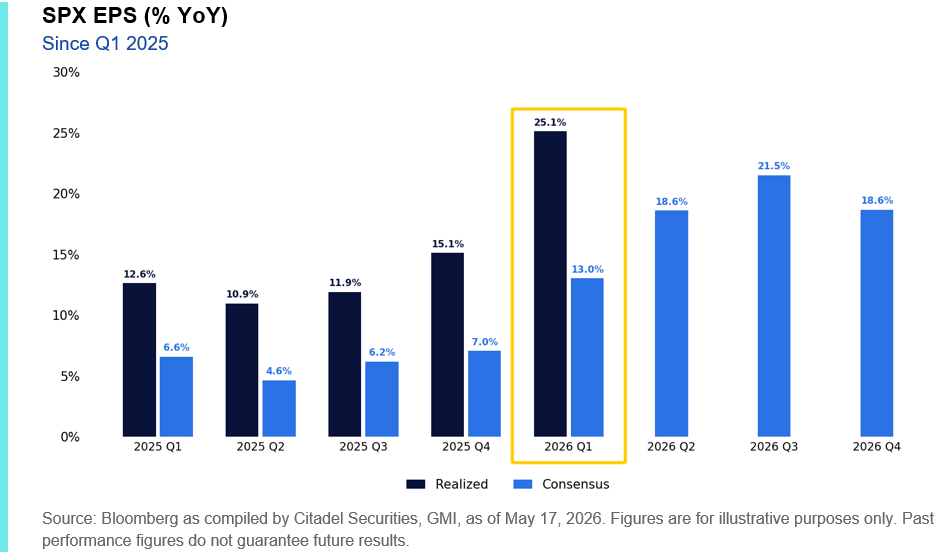
Tech once again led the tape, with a 92% EPS beat rate, while hyperscaler capex expectations continue to move higher into 2027 (+38% YoY). AI became an earnings story, not just a narrative.
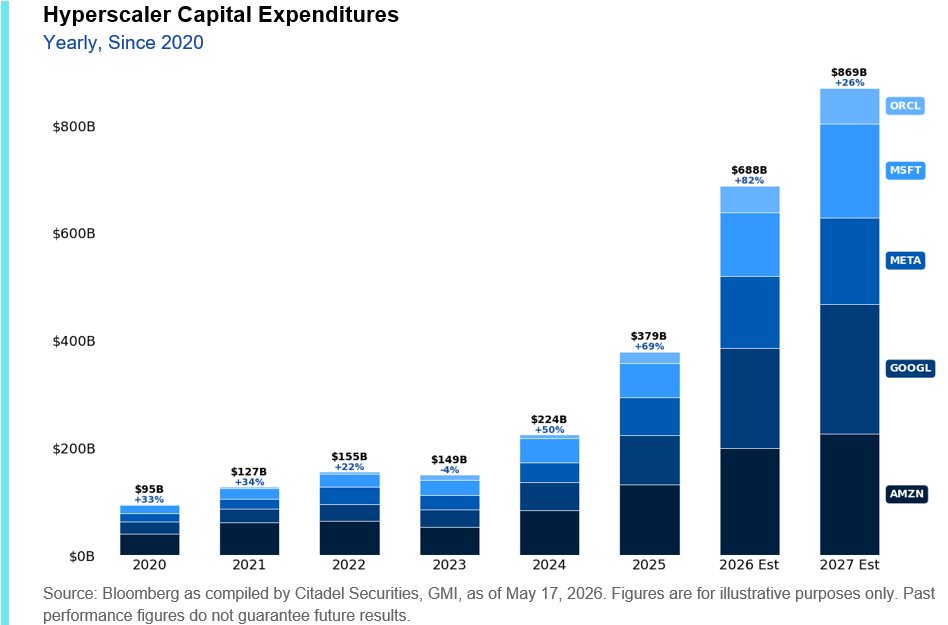
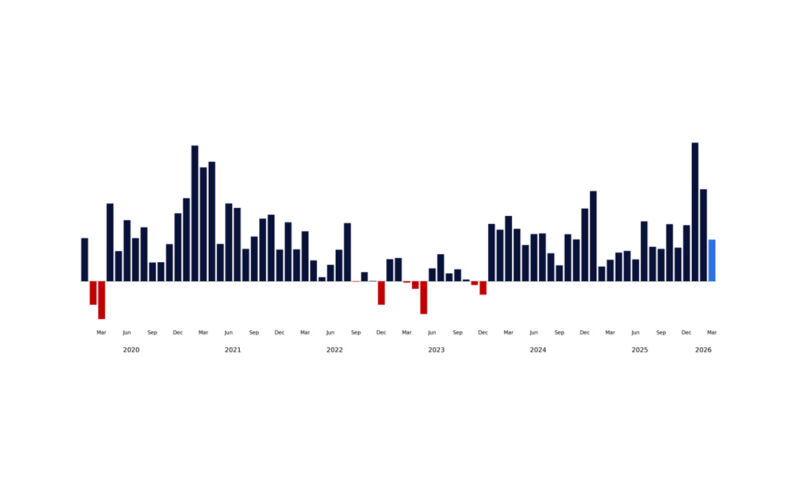
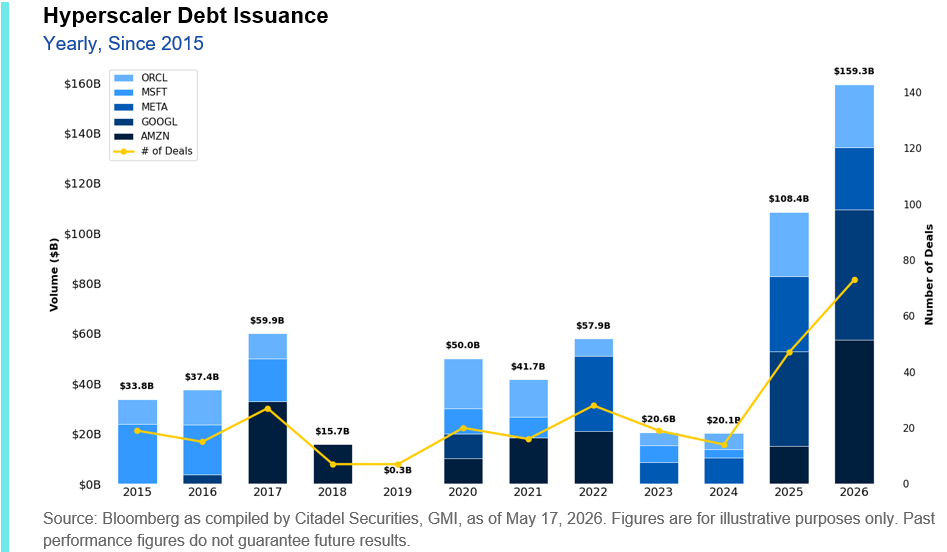
Hyperscalers have already issued more debt year-to-date than in all of 2025, underscoring both the scale and urgency of the current AI investment cycle. Unlike prior speculative cycles, however, earnings expectations are also moving materially higher alongside the spend.
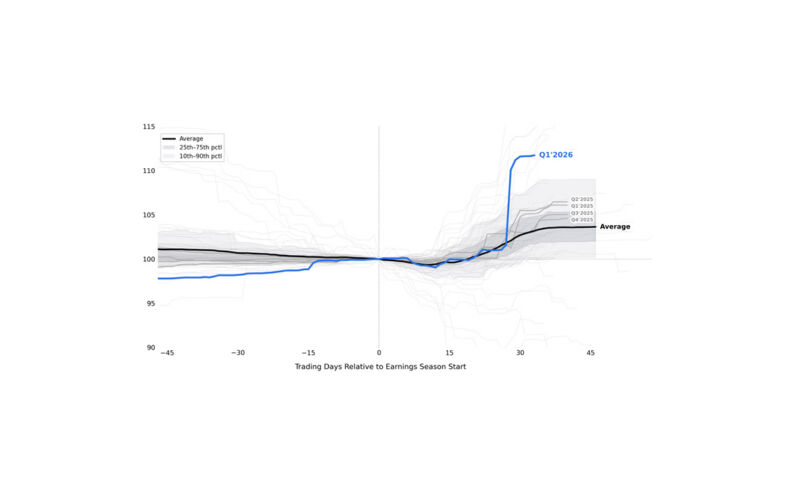
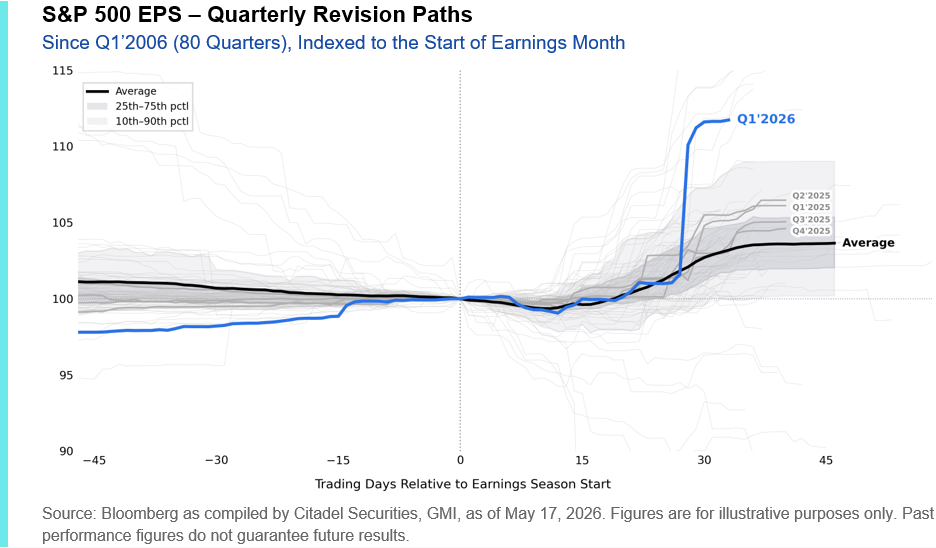
The slope of upward revisions this quarter was unusually steep, with Q1’26 tracking materially above a normal earnings revision path.
2. Valuations
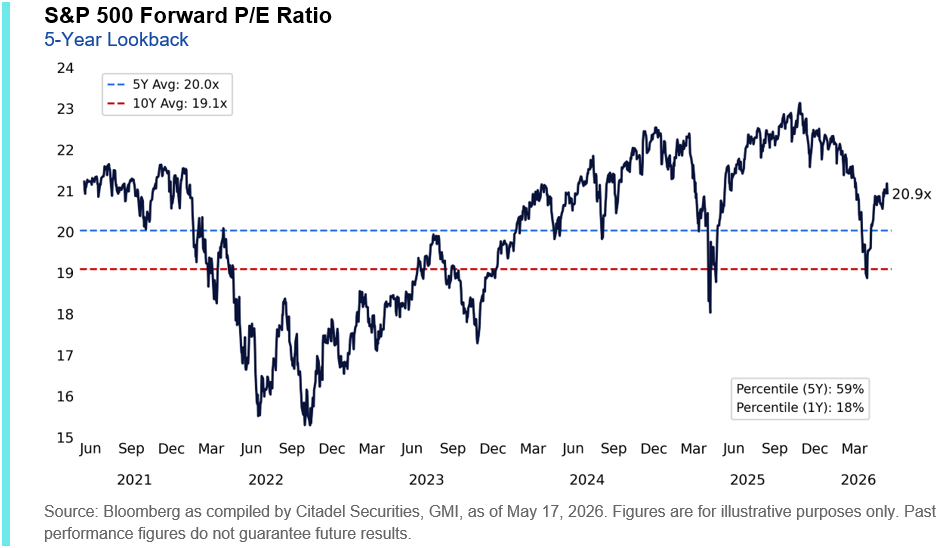
Valuations are no longer cheap, but this still does not look like 1999.
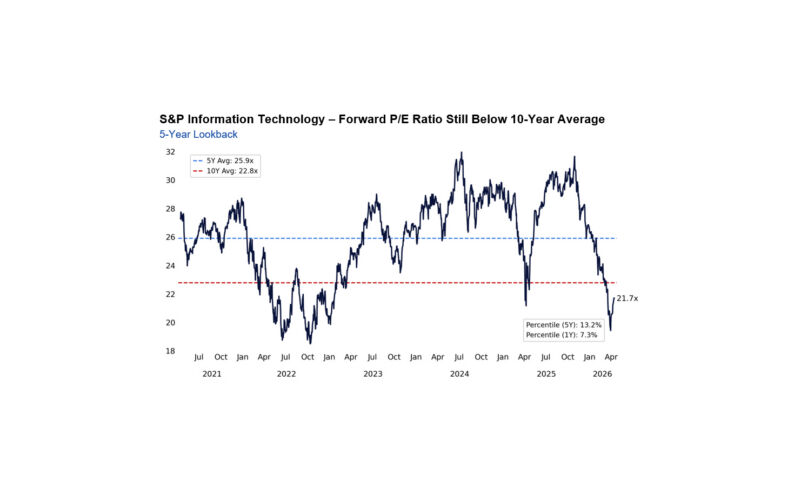
The S&P 500 currently trades at ~21x forward earnings, below the peak multiple reached in Oct’2025 and still in the bottom quintile of its 1-year range (18th percentile).
Nasdaq valuations also still remain below their 5-year average, despite continued momentum in AI-linked leadership. The upward revision cycle in mega-cap tech EPS estimates has prevented the multiple from expanding more aggressively.
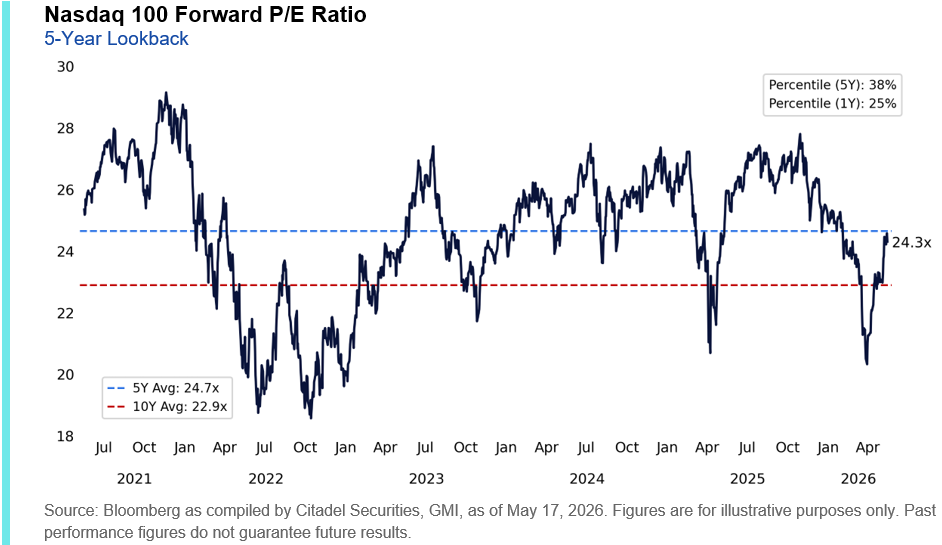
AI enthusiasm is no longer purely thematic – it is increasingly being supported by realized revenues, margins, capex commitments, and upward revisions to forward estimates.
II. Flows
3. Buybacks
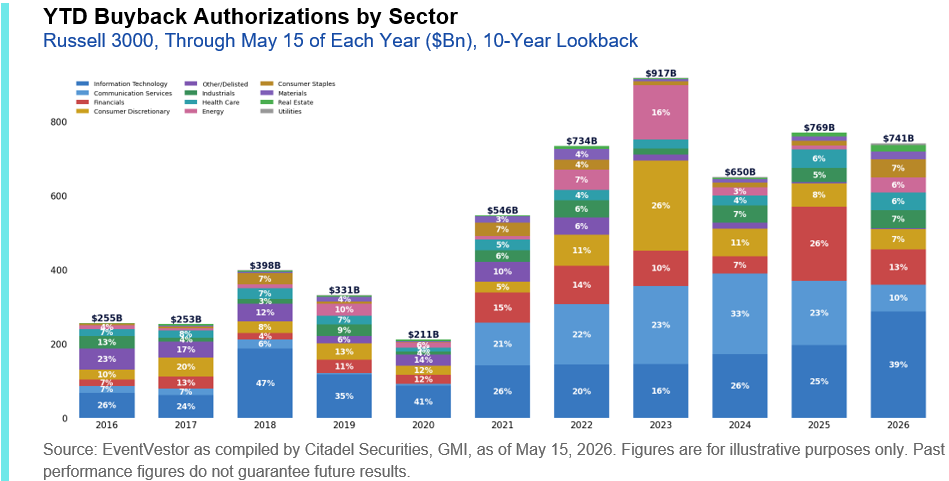
Corporate repurchases are currently in the peak open window.
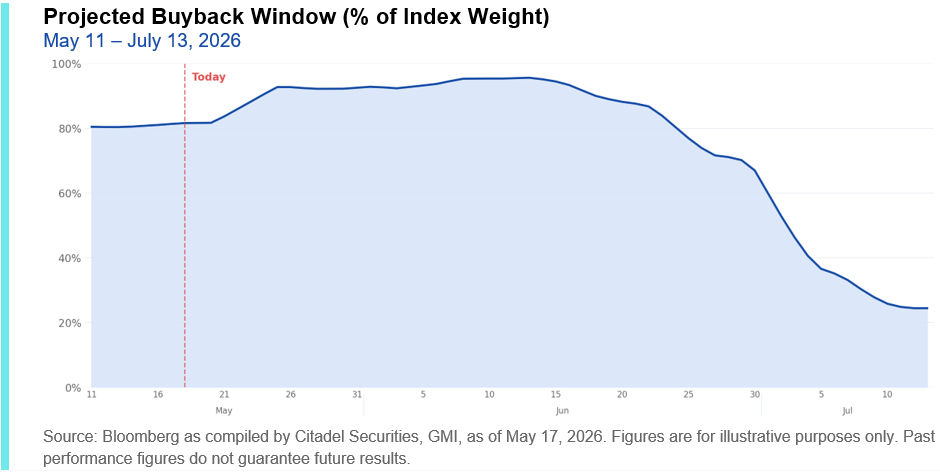
US corporate buyback authorizations have reached ~$741B YTD, according to EventVestor, with executions on pace to exceed $1 trillion in 2026. Following a strong earnings season, corporates continue to signal confidence through both aggressive buybacks and expanding capex commitments.
We estimate corporate demand at roughly ~$5B per day during the open window, making buybacks one of the largest structural sources of equity demand in the market today.
The next blackout window begins around June 15th, reducing execution activity before reopening later in July.
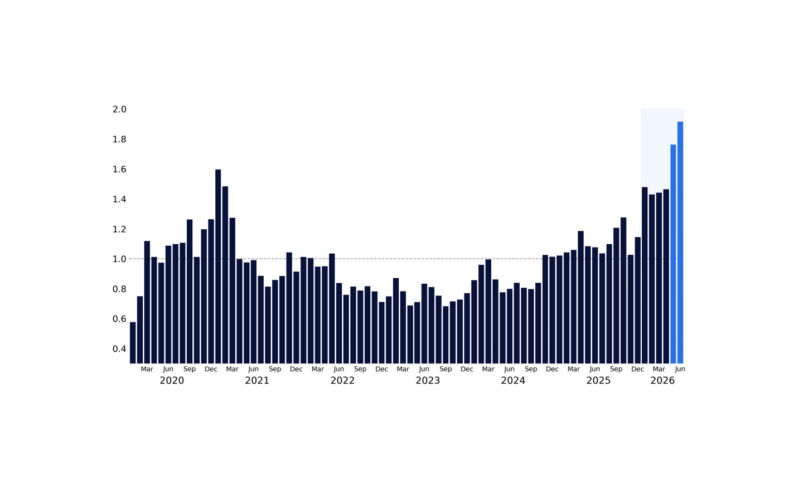
4. Retail
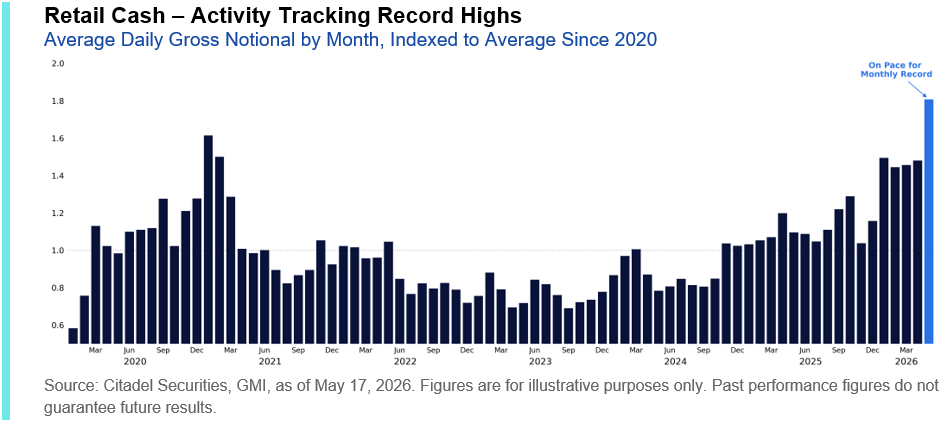
As we have been highlighting, retail participation has reaccelerated sharply following tax refunds, as renewed dip-buying behavior brought retail back into the market.
The key difference versus earlier this year is where that participation has gone. Rather than concentrating in speculative meme-style activity, retail has increasingly piled into mega-cap tech and semiconductors – precisely the areas that have experienced the most historic upside moves.
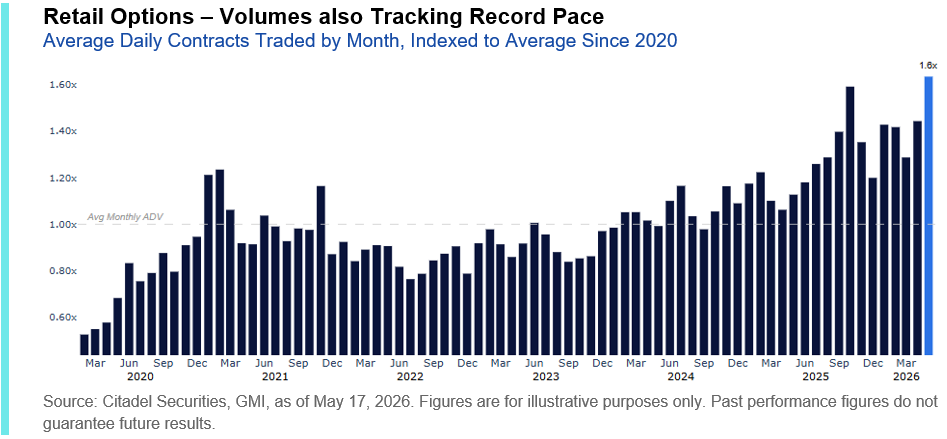
Citadel Securities gross retail cash volumes ranked in the 96th percentile in April versus all months since 2019, while May is currently on track to become the most active month ever, pacing roughly ~12% above January 2021 levels. Options activity has been similarly impressive, with April posting the second-highest ADV on record (behind Oct’2025) and May currently tracking toward a new high, with average daily contracts traded pacing ~60% above the historical monthly average.
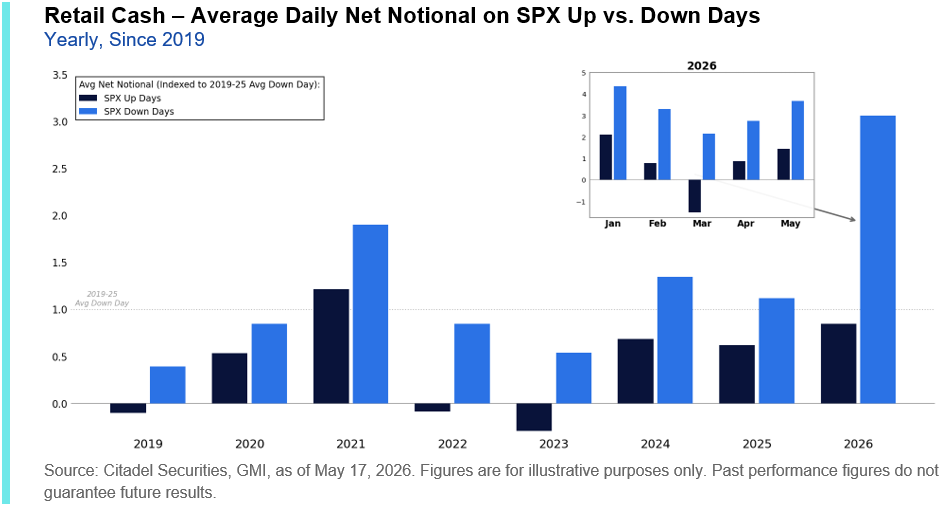
Retail behavior has also become materially less selective again. In March, retail investors were increasingly contrarian, consistently selling rallies on average while remaining buyers of weakness. That dynamic has now reversed. Retail is once again aggressively buying both up days and down days, with average net buying on S&P 500 rallies back at the highest levels since January.
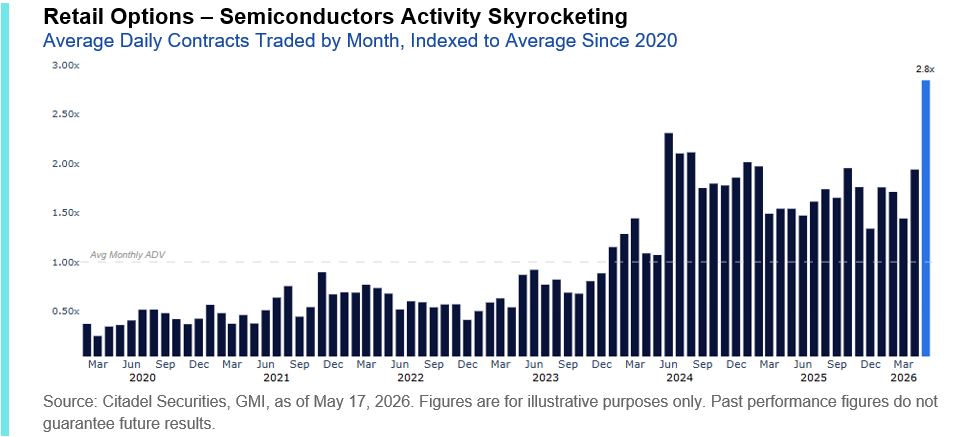
By far, the biggest inbound we have received in recent weeks has been around retail’s role in the historic rally across semiconductors, where buying activity (particularly in options) has been exceptionally elevated.
Retail options traders have traded roughly ~2.8x their average daily semiconductor volume this month, nearly ~25% above the prior record set in June 2024, during NVDA’s stock split and run to surpass MSFT as the world’s most valuable company.
5. Passive Flows
Passive vehicles are playing an increasingly dominant role in determining where marginal equity demand is allocated.
US ETFs have attracted roughly ~$852B of inflows year-to-date, ~33% above the prior record pace from 2025. That equates to roughly ~$8.5B per day across 93 trading sessions, providing a persistent source of demand throughout the rally.
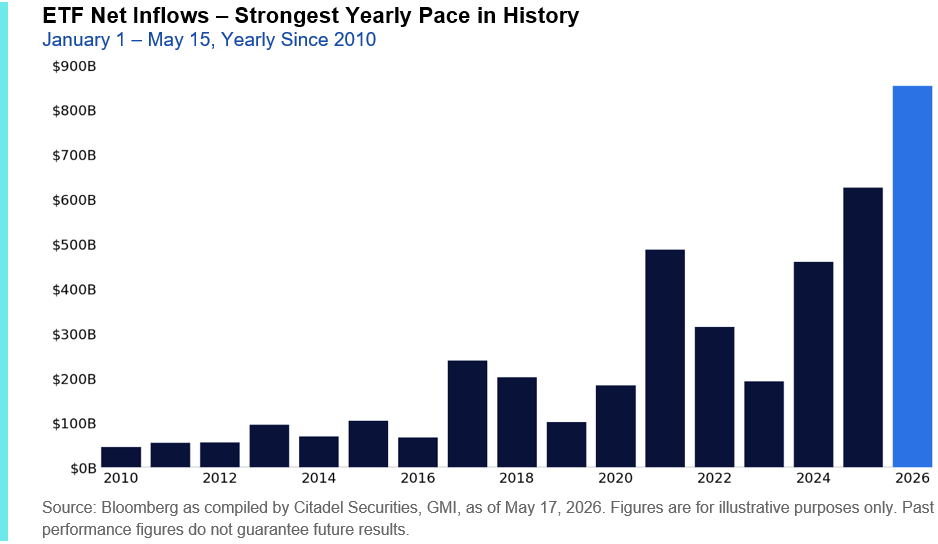
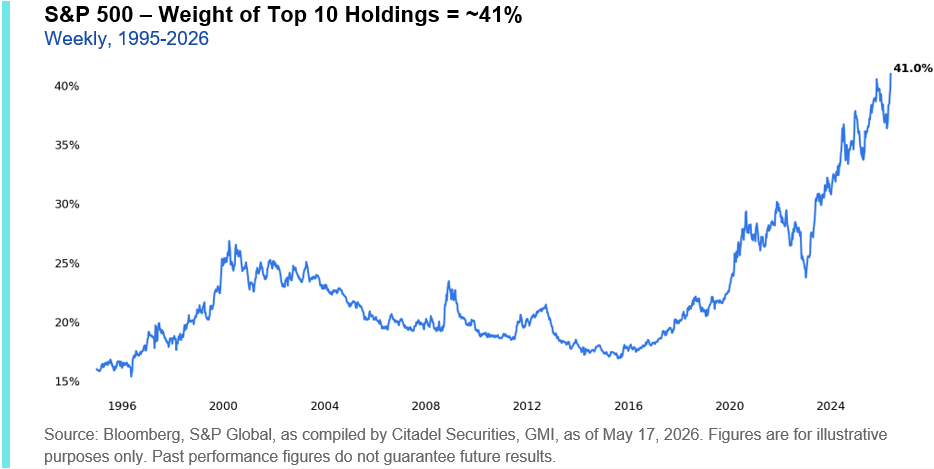
Passive buying is not neutral in today’s market structure. Every $1 allocated into the S&P 500 increasingly becomes a pro-growth, pro-momentum, and pro-large-cap allocation. Roughly ~35c of every incremental dollar flows into the Mag 7, ~41c into the Top 10 names, and nearly half into AI-linked exposure.
Leverage tied to these same themes has also expanded aggressively. US levered ETF assets under management have reached a record ~$203B, up roughly ~$67B (+49%) since the end of March. Equities represent ~92% of those assets, overwhelmingly concentrated in technology (~70%). These products are being traded by all types of investors, including institutions, not just retail.
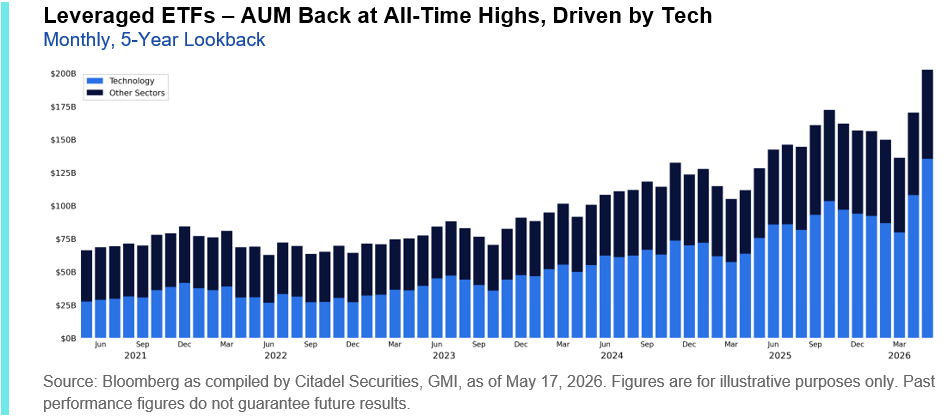
Levered ETFs create a meaningful source of synthetic short gamma exposure, particularly across technology/semiconductor factors. The same flows that mechanically supported momentum higher can also exacerbate downside moves if the market begins to reverse, especially into weaker liquidity environments.
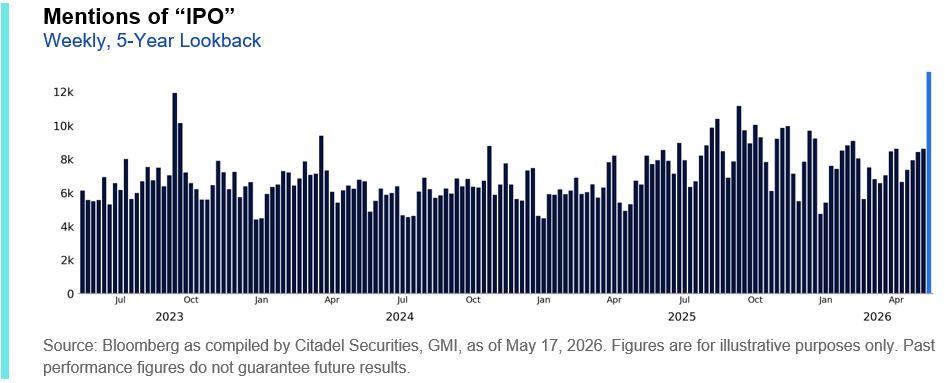
The market’s ability to absorb new supply may also become increasingly important from here. The number of stories mentioning “IPO” is now at the highest level since September 2023 (ARM’s listing), suggesting summer issuance activity could begin testing demand if momentum cools.
III. Positioning
6. CTAs
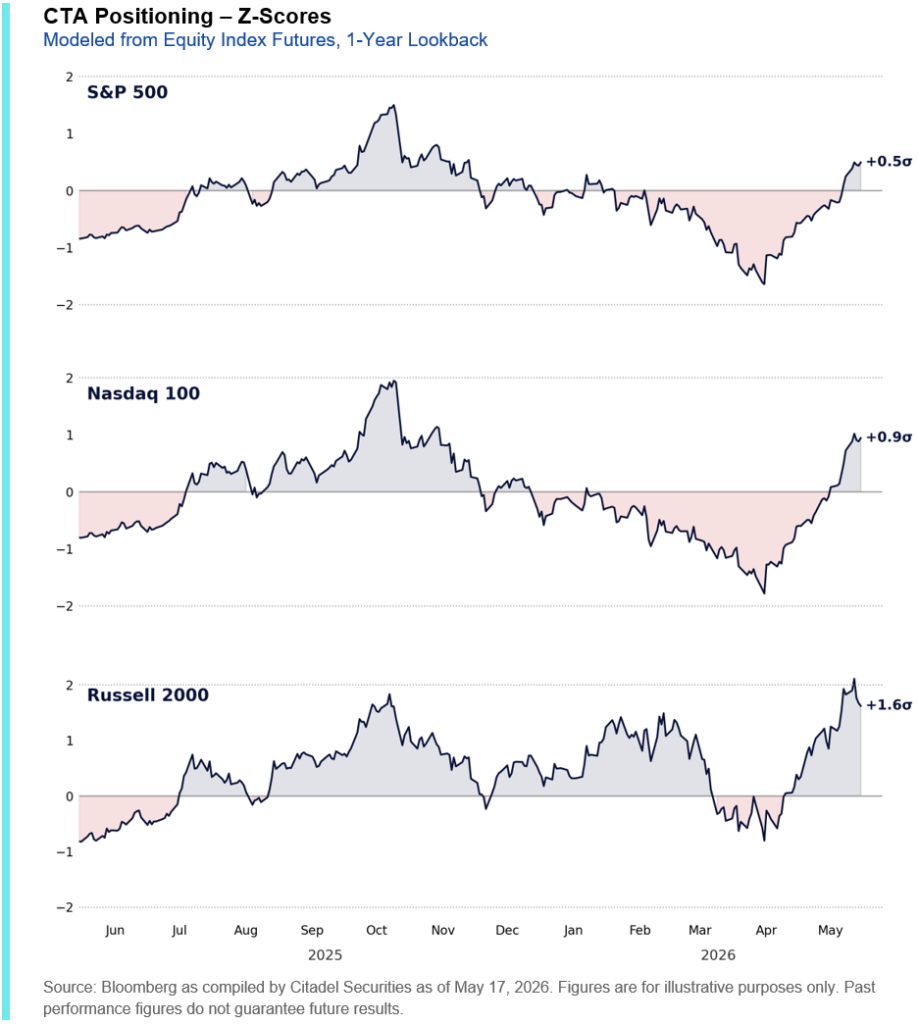
The systematic positioning backdrop looks materially different today than it did in late March.
Systematic deleveraging potential is now elevated, with many CTA strategies approaching high exposure levels and flow asymmetry increasingly skewed to the downside. Said differently, projected sell pressure in a down tape now materially exceeds incremental buy demand from here.
Using our new 2026 CTA exposure model, built with Ryan Preclaw, Head of Data Science at Citadel Securities, exposure across major U.S. equity indices has rebuilt sharply alongside the rally.
Our Nasdaq CTA exposure model is now at its highest level since October, the S&P 500 model is at its highest level since November, and the Russell 2000 model just posted its highest reading since December 2020.
We also built a new CTA scenario analysis model to better quantify the current asymmetry. Using the model, we analyzed projected CTA flows under a scenario where the S&P 500, Nasdaq, and Russell 2000 each decline 1%.
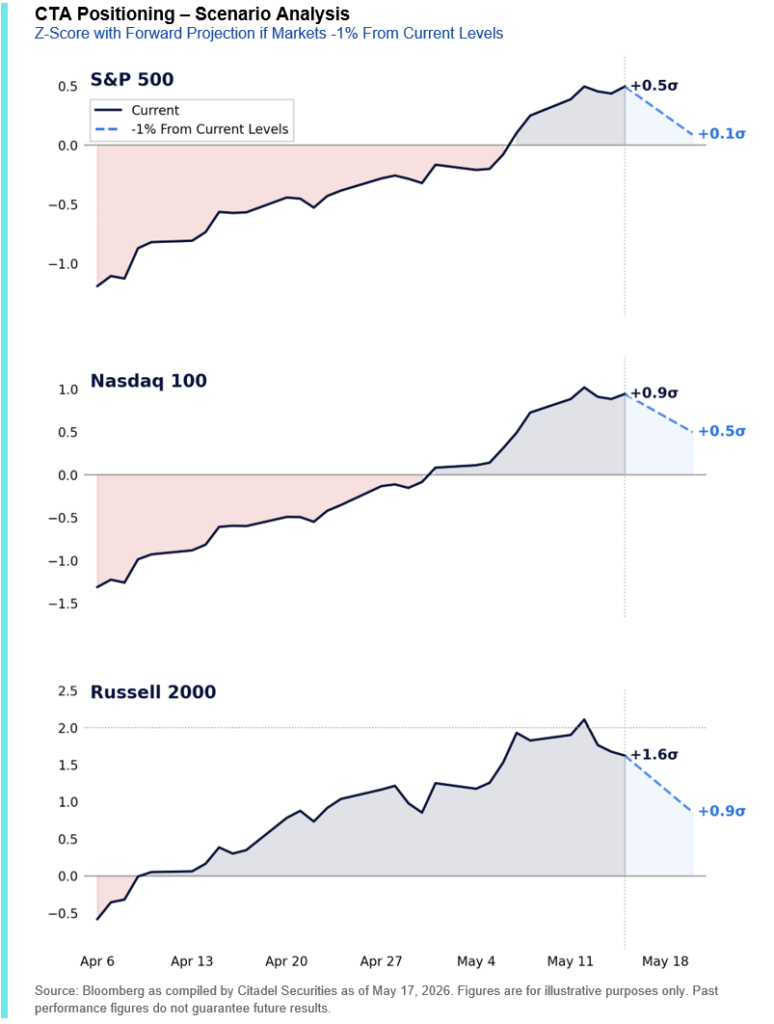
The takeaway is not that the market must reverse lower. Rather, the positioning backdrop is no longer as supportive as it was earlier in the rally when systematic strategies still had significant room to add exposure.
7. QB1 = Volatility
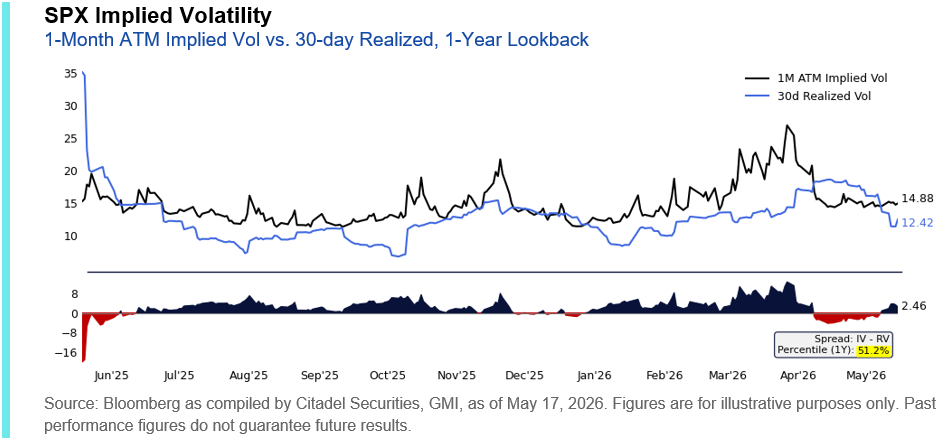
The volatility backdrop has also changed materially since late March. Following a ~17% rally off the lows and a sharp collapse in realized volatility, outright index volatility now looks increasingly attractive for stock replacement and tactical hedging.
SPX 1-month at-the-money implied volatility has compressed from ~26v at the end of March to ~15v over the last 6 weeks.
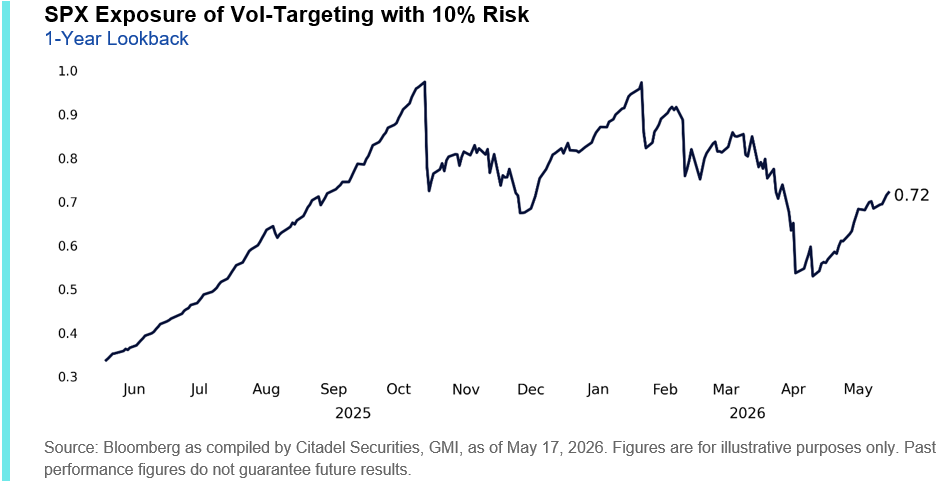
Volatility-targeting strategies have mechanically rebuilt exposure as volatility has fallen. S&P 500 10% vol-targeting exposure troughed near ~53% in April and has since increased to roughly ~72%.
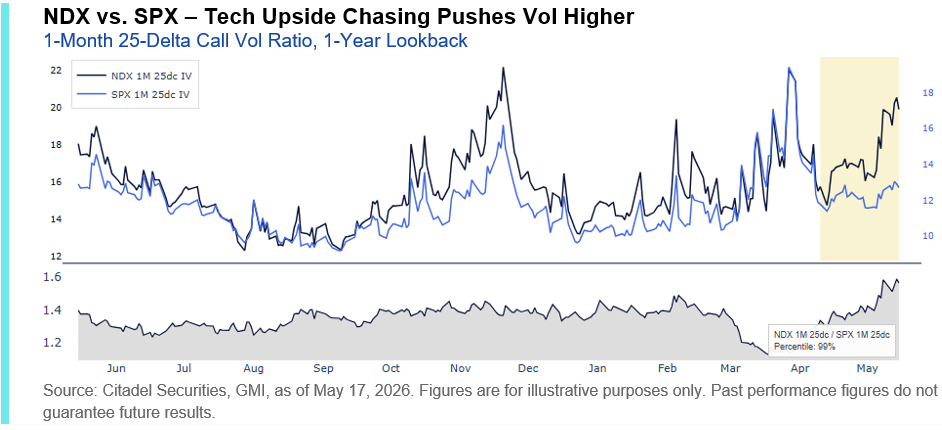
8. Spot Up, Vol Up
The market has increasingly traded with a “spot up, vol up” dynamic in recent weeks, particularly across Nasdaq and semiconductor leadership.
The chase for tech upside through call options has started pushing volatility higher even as equities continue to rally. This has been most visible in Nasdaq, where elevated demand for upside exposure has driven NDX volatility to its richest levels versus SPX in more than a year.
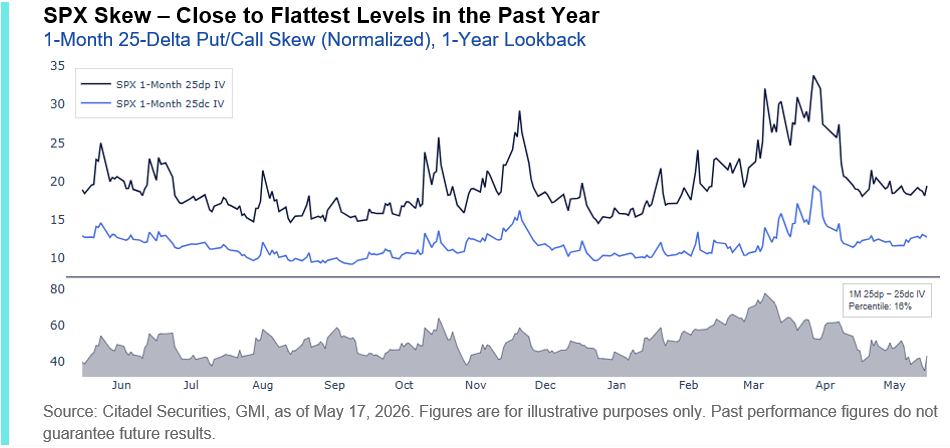
Skew has flattened materially, with 1-month 25-delta put/call skew just reaching its flattest level in over a year as investors increasingly chase upside exposure over downside protection. We would look to add hedges here, with the cost of protection relative to further upside exposure now the cheapest it has been in over a year.
This combination – rising prices, rising volatility, and collapsing skew – tends to be indicative of more euphoric trading environments, particularly when upside participation becomes increasingly concentrated in calls and higher-beta leadership.
If the market were to transition toward a “spot down, vol down” regime, it could potentially reset momentum and appetite for upside call exposure relatively quickly.
IV. Internals
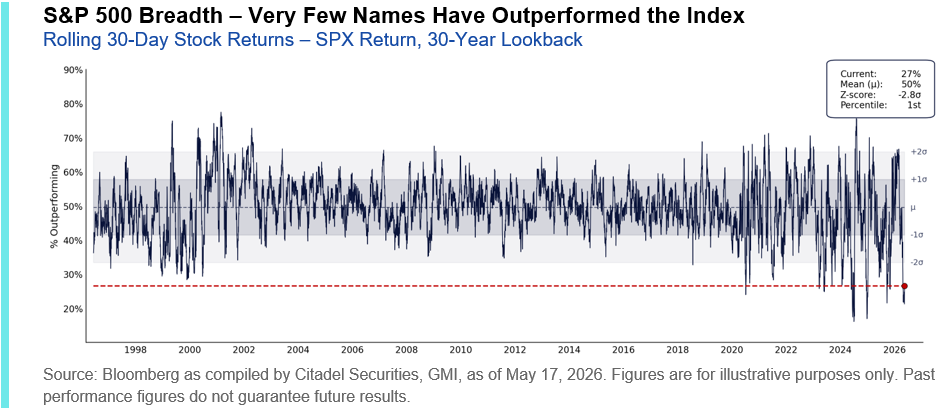
9. Weak Breadth
Breadth remains historically narrow beneath the surface of the rally – just 27% of S&P 500 constituents have outperformed the index over the past 30 trading days, a 1st percentile observation relative to the past 30 years. Said differently, ~72% of the S&P 500’s ~1065pt rally since the end of March has come from just 10 companies.
If geopolitical tensions continue to stabilize and the rates backdrop improves, the next leg of the rally will broaden beyond semiconductors and mega-cap technology.
The challenge is that many investors remain heavily positioned in the current leadership cohort and underexposed elsewhere. A rotation into lagging cyclicals, small caps, or rate-sensitive sectors would likely require funding from existing technology and semiconductor longs.
Higher long-end rates are beginning to create competition for equities again. 30-year yields recently closed at 5.12%, its highest level since September 2007, while real yields across the TIPS curve are increasingly attractive. Equities now have a new (or rather, very old) competitor that markets may need to pay closer attention to from here.
Thus, breadth improving from here will initially create pressure on the indices themselves, as many of the market’s largest outperformers may need to mechanically “catch down” in order for participation to broaden.
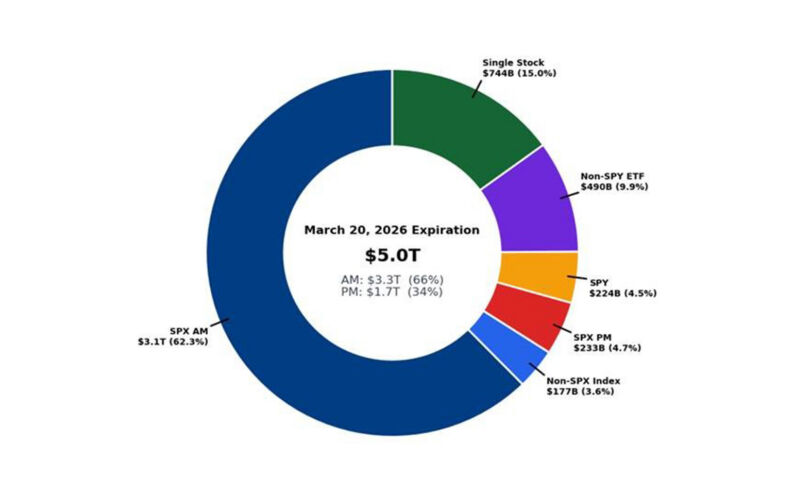
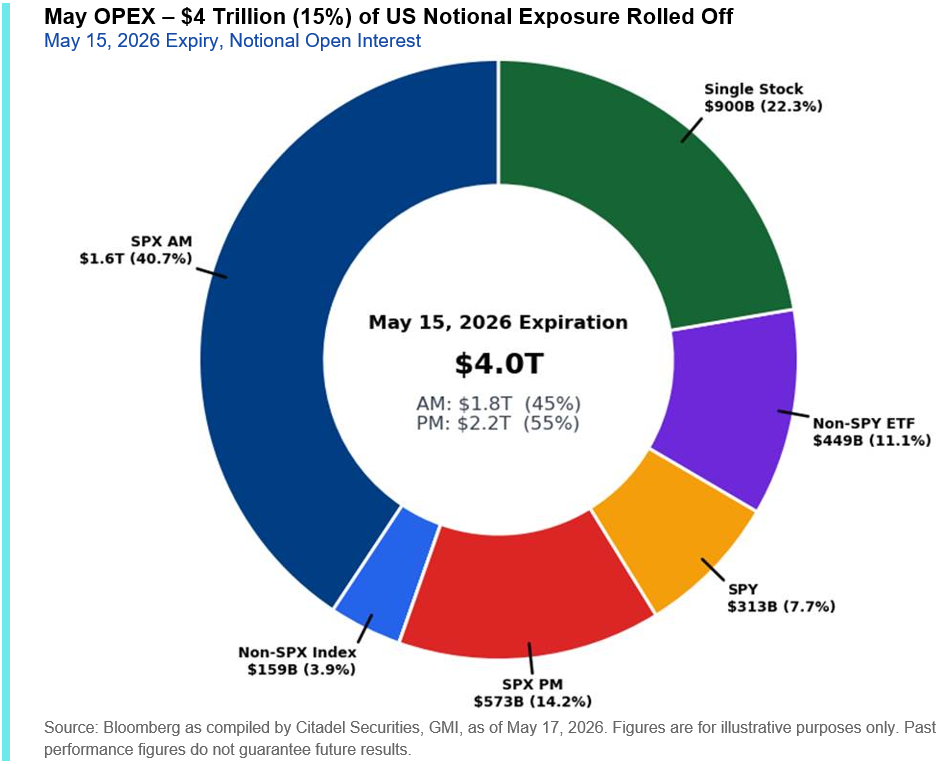
10. May Options Expiry
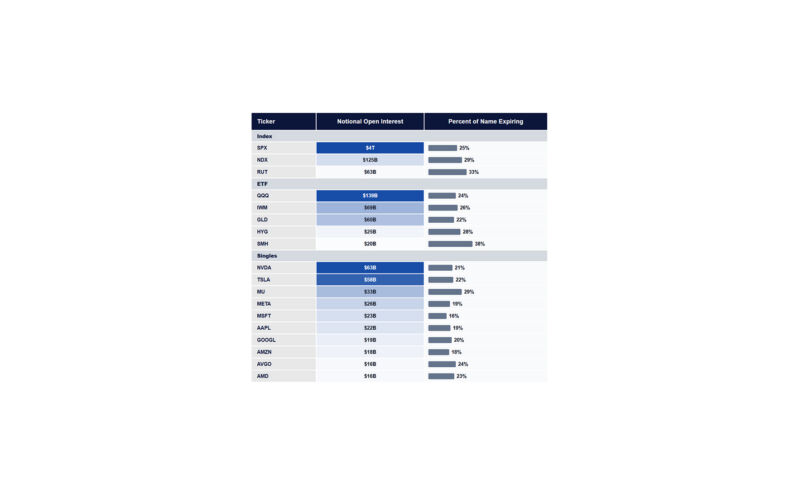
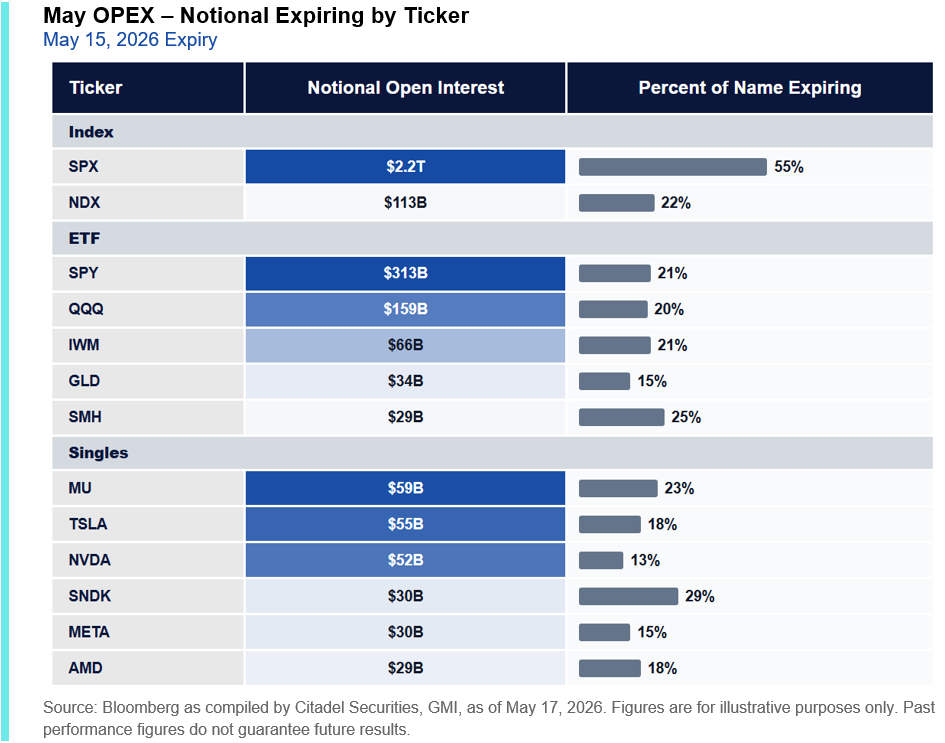
May options expiration comprised roughly ~$4T of notional exposure, or ~15% of all listed US options exposure. This included roughly ~$2.2T of SPX options (~55% of the total) and ~$900B of single stock exposure (~22% of the total).
The biggest trend of note was that this expiry was more semiconductor-heavy than usual. MU represented the single largest individual stock expiration at ~$59B, ahead of both TSLA and NVDA, while SMH saw roughly ~25% of total open interest expire.
The market had been operating in a heavily long gamma environment throughout much of April and May, particularly across semiconductor and large-cap technology leadership. As a meaningful portion of that exposure rolls off, the market may lose part of the stabilizing buffer that helped dampen realized volatility during the rally.
11. Un-Hedged
The market looks materially less hedged than it did during the March drawdown.
The 5-day rolling average for ETFs as a percentage of overall tape has fallen to roughly ~26%, well below the March highs near ~40% when defensive positioning and ETF short activity peaked. More recently, this measure briefly fell as low as ~23.8%, the lowest level since February 2025.
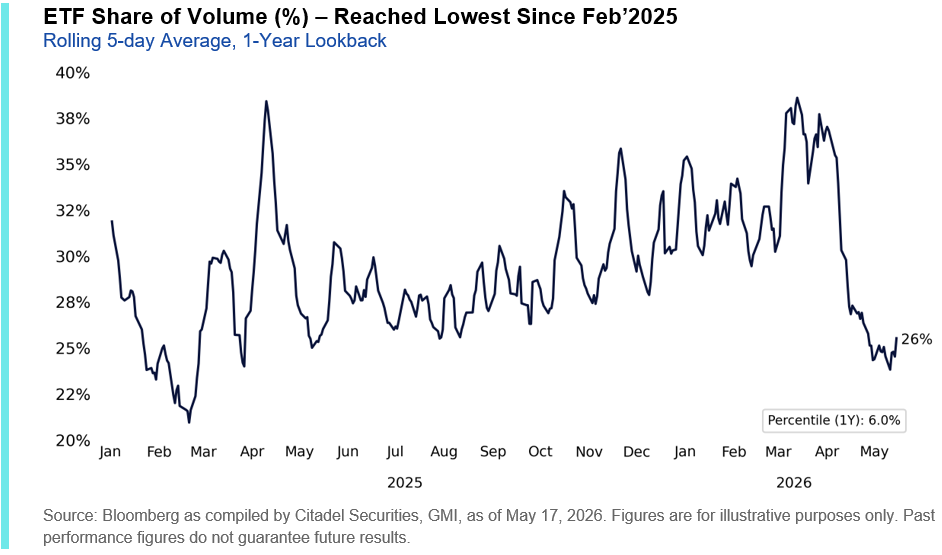
This represents another meaningful shift versus late March. At that point, elevated hedging activity and ETF short demand helped create the conditions for a sharp reflexive rebound as positioning unwound. Today, the hedge base appears significantly lighter.
Combined with rebuilt systematic exposure, concentrated leadership, and increasingly call-driven positioning, the market now appears materially less protected against a short-term volatility event.
GMI BOTTOM LINE
The near-term setup now warrants more tactical caution.
The fundamental backdrop remains solid. Q1 earnings were the strongest since the post-COVID era, AI spending continues to accelerate, and corporate demand remains supportive through both buybacks and passive inflows.
The challenge is that the market now looks significantly more crowded than it did just six weeks ago. Downside hedging demand has collapsed, systematic exposure has rebuilt sharply, and several of the flows that mechanically supported the rally may become less supportive from here.
Higher long-end yields and increasingly attractive real rates are also beginning to create competition for equities again, particularly as positioning and momentum become more crowded beneath the surface.
None of this changes our medium-term bullish view. But after a ~17% rally off the lows, we think the risk/reward has become less asymmetric and that a short-term flow-of-funds unwind becomes increasingly possible if momentum begins to fade.

Copyright © Citadel Enterprise Americas LLC or one of its affiliates. All rights reserved.
Legal Entities Disseminating this Material: This material is disseminated in the United Kingdom by Citadel Securities (Europe) Limited (“CDGE”) authorized and regulated by the Financial Conduct Authority (“FCA”) (Registered company number: 05462867); in the European Union by Citadel Securities GCS (Ireland) Limited (“CSGI”) and its Paris Branch authorized and regulated by the Central Bank of Ireland (“CBI”) (Registration Number: C173437); in Hong Kong by Citadel Securities (Hong Kong) Limited (“CDHK”) licensed by the Securities and Futures Commission of Hong Kong (“SFC”), in Japan by Citadel Securities Japan Co., Ltd (“CSJC”) registered as a Type 1 financial instruments business operator with the Japan Financial Services Agency (“JFSA”); and in the United States of America by Citadel Securities LLC (“CDRG”) registered with the Securities Exchange Commission (“SEC”), Financial Industry Regulatory Authority (“FINRA”), and Securities Investor Protection Corporation (“SIPC”), Citadel Securities Institutional LLC (“CSIN”) registered with the SEC, FINRA, and SIPC, or Citadel Securities Swap Dealer LLC (“CSSD”) registered with the SEC, Commodities Futures Trading Commission (“CFTC”), and National Futures Association (“NFA”). Unless governing law permits otherwise, you must contact a Citadel Securities entity in your home jurisdiction if you want to use our services in effecting a transaction in any financial instruments or securities, including derivatives.
FOR INSTITUTIONAL USE ONLY; FOR PROFESSIONAL CLIENTS AND ELIGIBLE COUNTERPARTIES ONLY. This material is not intended as and does not constitute investment research. Contents of this material will be strictly limited to non-specific, generic information (i.e. macro events/topics) and are not subject to the Markets in Financial Instruments directive (MiFID II) or FINRA research rules. This material does not constitute an offer, solicitation, invitation, or inducement to purchase, acquire, subscribe to, provide, or sell any financial instrument or otherwise engage in investment activity. Please see additional important disclosures, including disclosures that may be relevant to your country of residence or business at www.citadelsecurities.com/GlobalSalesTrading.