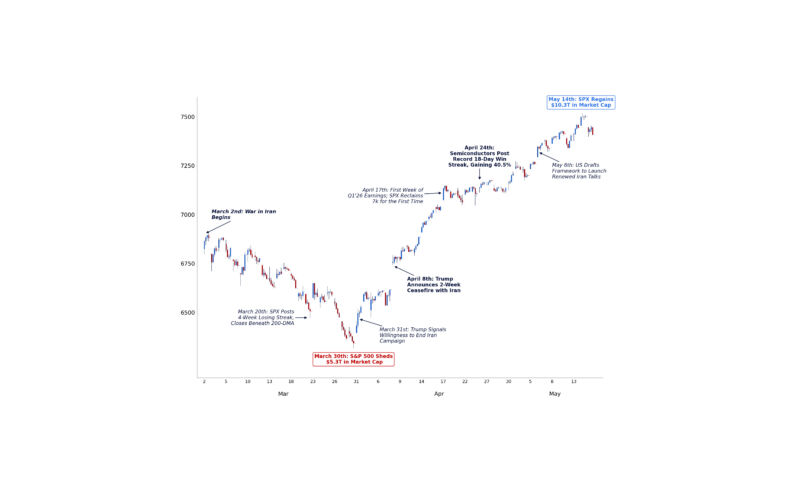
The S&P 500 has rallied 13% since March 31st, adding more than $9 trillion in market capitalization.
April 2026 marked the strongest monthly performance for the index since November 2020, broadly in line with the positioning and flow dynamics we highlighted in our GMI April Checklist.
While the magnitude of the move has been notable, the underlying drivers have been more nuanced. Solid earnings, improving technicals, and a pickup in retail activity have supported the rally – though much of the advance has been concentrated in a relatively narrow subset of index heavyweights.
At a glance:
- Earnings remain strong, with corporates re-emerging as a meaningful source of demand through buybacks and sustained investment cycles.
- Technicals have reset, but breadth and dispersion remain subdued, highlighting the narrow nature of the rally.
- Retail flows have reaccelerated and remain concentrated in high-beta and thematic areas, reinforcing momentum-driven dynamics.

I. Earnings, Corporates, and the Demand Backdrop
Q1 Earnings: Performance and Vol Trends
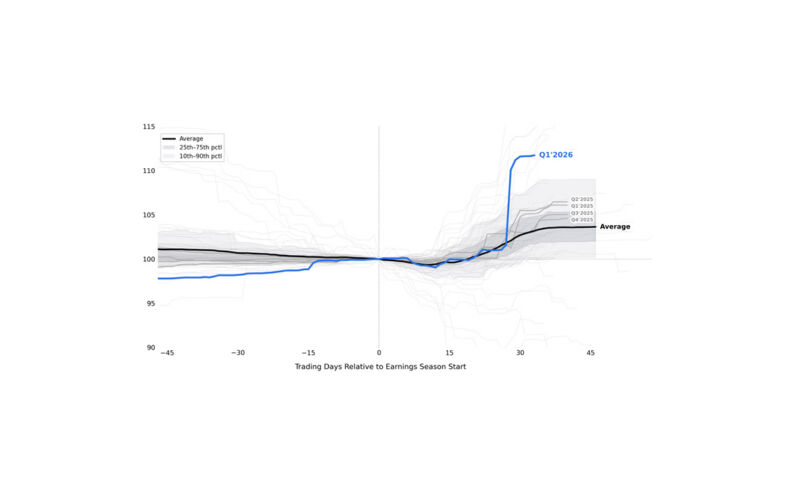
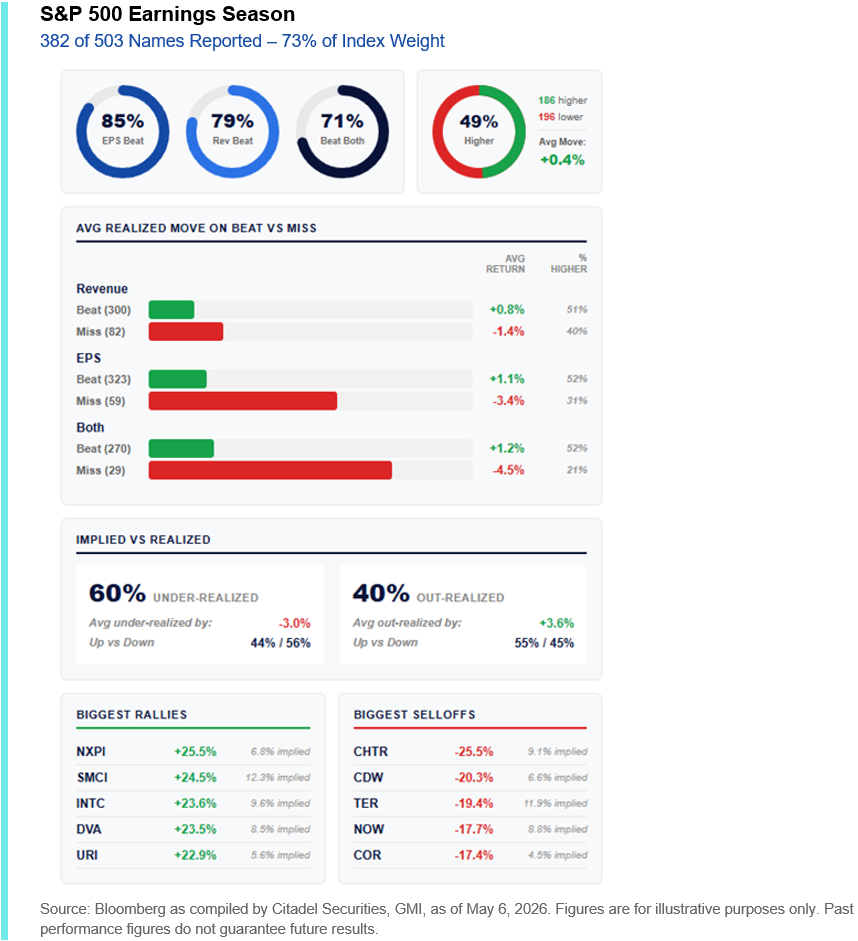
We are now ~75% of the way through the Q1 reporting season, with the fundamental backdrop remaining supportive.
At a high level, beat rates remain elevated and price reactions skew positive:
- 85% of companies have beaten EPS
- 79% have beaten on revenue
- 49% of names have traded higher post-print
As is often the case, downside reactions to misses continue to exceed the upside seen on beats. Companies beating on both EPS and revenue are up +1.2% on average, versus -4.5% for those that missed.
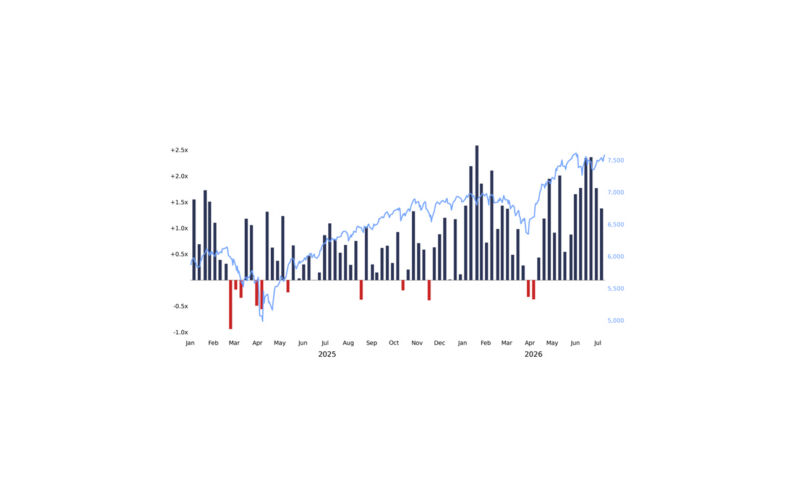
From a volatility perspective, ~50% of names have under-realized implied moves, in line with historical norms. Among the ~43% of companies that have out-realized implied expectations, outcomes are clearly skewed to the upside, with more than half of those names trading higher.
In other words, while most earnings events remain contained, the larger realized moves this season have disproportionately favored upside outcomes – reinforcing the positive bias in post-earnings price action, which has supported broader index performance.
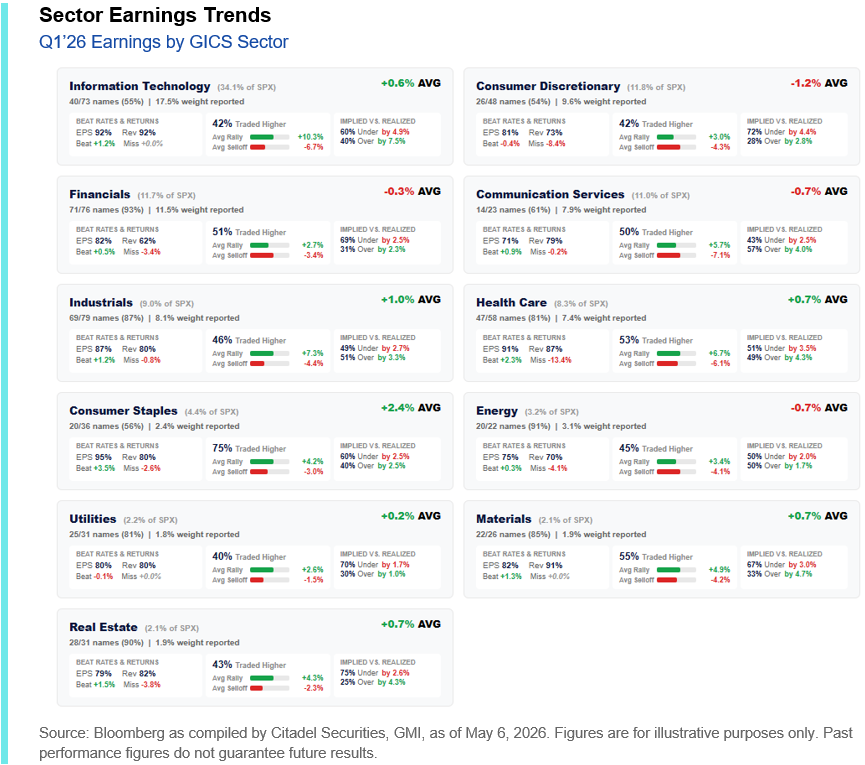
Healthcare, Information Technology, and Consumer Staples have posted the strongest results, while Utilities and Energy have seen the weakest – though Technology continues to be the key driver. 92% of companies in the Tech sector have beaten on EPS and on revenue, and a meaningful share of names delivered realized moves above implied. ~40% of Tech has out-realized its earnings-implied moves by ~8% on average, with a pronounced upside skew (average rallies of +10.3% versus declines of -6.7%).
The largest and most important part of the index is not only beating, but doing so with stronger-than-expected price reactions, particularly to the upside.
With most of the index now through earnings, attention turns to the remaining consumer and retail cohort, which should offer a clearer read on consumer health, while NVIDIA’s May 20th report remains a critical catalyst for the broader tape.
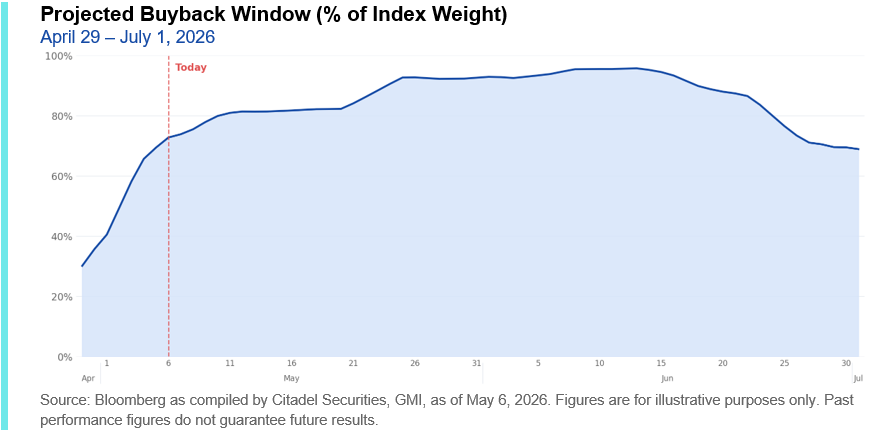
Corporates Re-Entering: Buybacks Set to Accelerate
Alongside earnings, corporates are beginning to re-emerge as a meaningful source of demand.
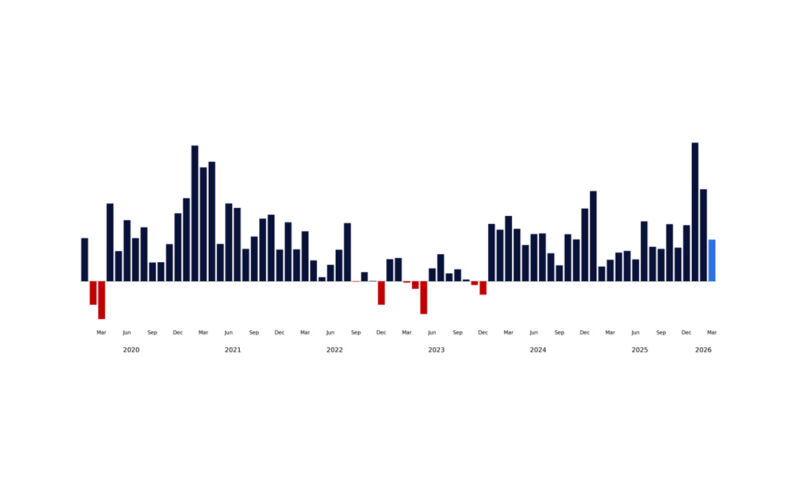
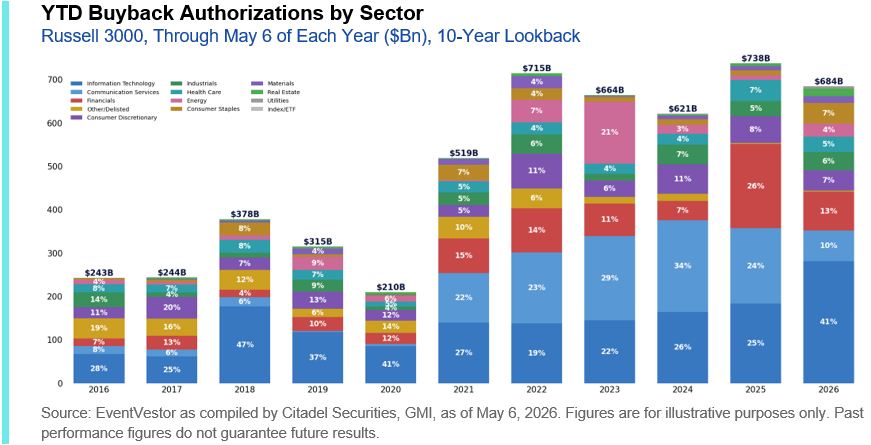
The buyback window is reopening, with an increasing share of the index now eligible to repurchase shares in the coming weeks. Year-to-date, U.S. corporates have authorized nearly $685B in buybacks, largely driven by buybacks in Tech and Financials (which constitute more than 50% of the authorized total in 2026). This sets the stage for a meaningful acceleration in activity as blackout periods roll off.
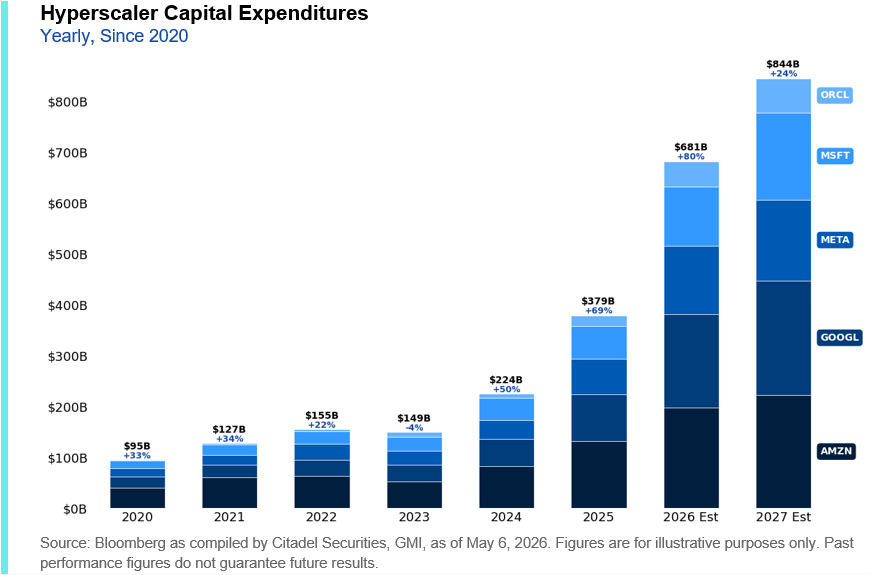
Capex Cycle Remains Firm
At the same time, investment cycles – particularly within large-cap technology – continue to move higher.
Hyperscalers have once again revised capital expenditure plans upward, with projected FY26 spending now greater than ~$685 billion and further growth expected into FY27 and FY28. Importantly, this pickup in capex is occurring alongside a reacceleration in buybacks, rather than at their expense.
II. Technicals Have Reset, but the Rally Remains Thin
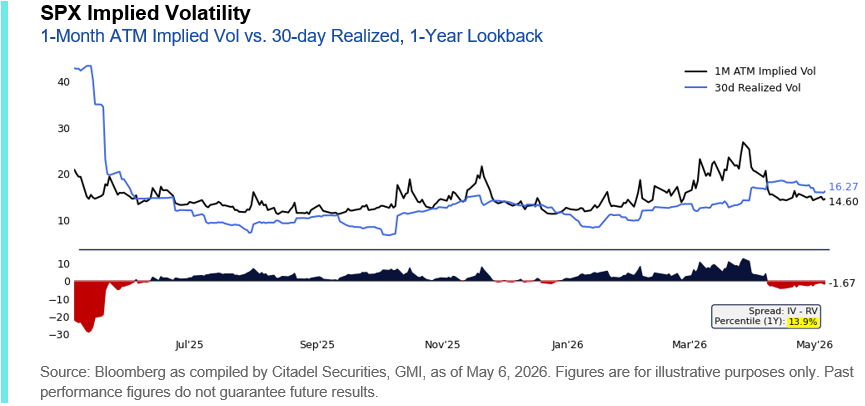
From a technical perspective, conditions have improved meaningfully in recent weeks.
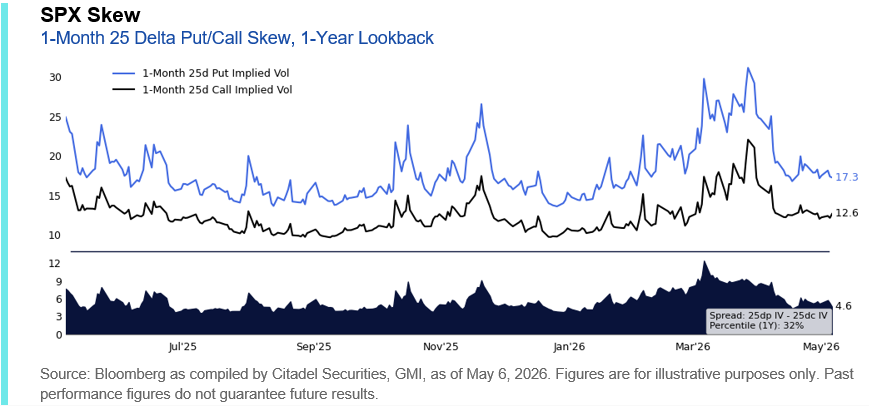
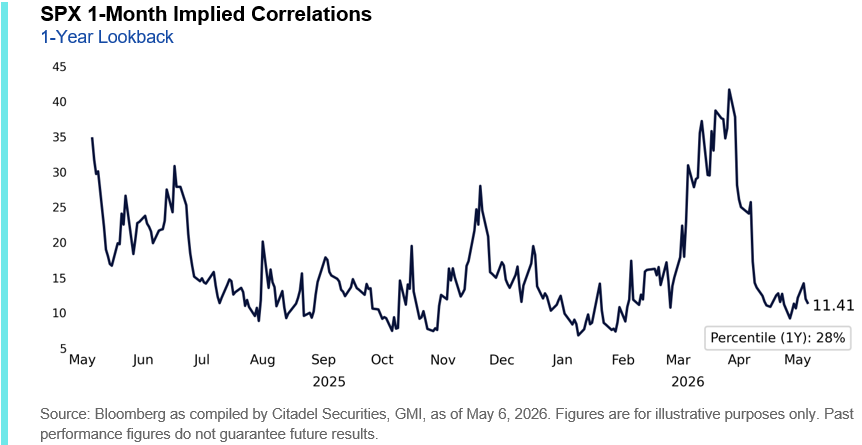
Implied volatility has moved sharply lower, skew has flattened as investors increasingly position for upside, and implied correlations have collapsed – all consistent with a market transitioning away from hedging and toward participation.
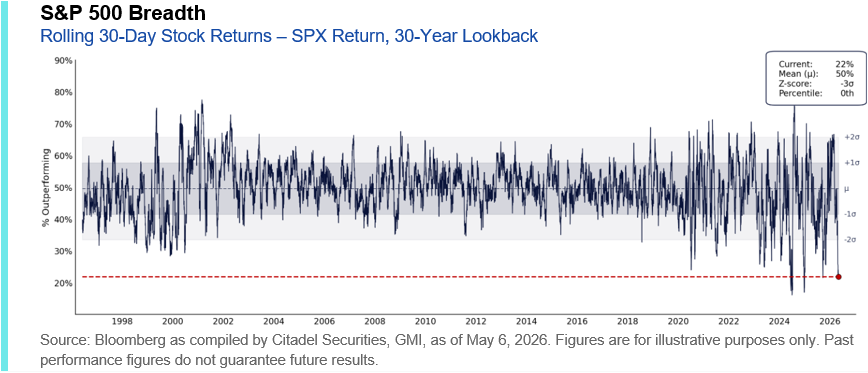
However, beneath the surface, participation has been relatively limited. Only 22% of names in the S&P 500 have outperformed the index itself over the last 30-days, reaching 30-year lows.
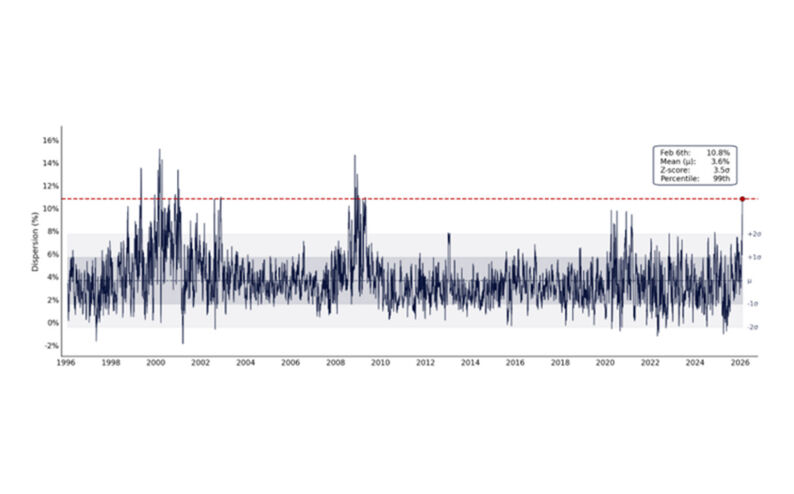
This is in stark contrast to the February environment we highlighted in our Market Internals update, where low implied correlations coincided with broad participation and elevated dispersion – with 65% of S&P 500 constituents outperforming the index over a 30 day period, a 97th percentile reading.
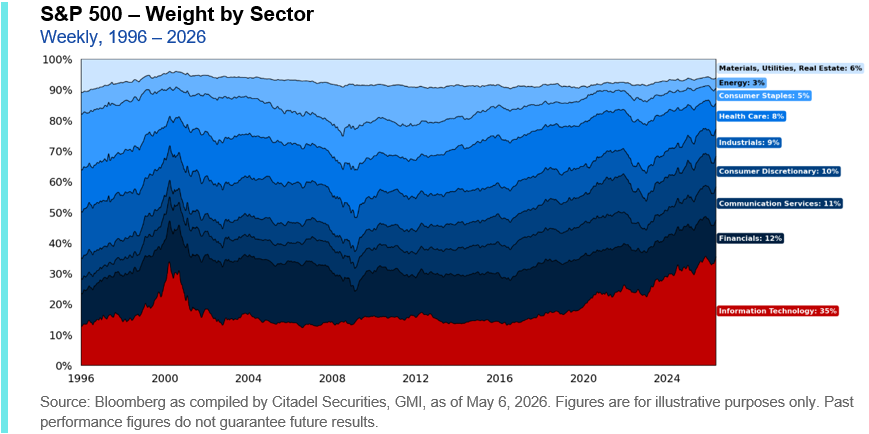
This dynamic is largely a function of index construction. The Mag 7 now represents roughly 35% of the S&P 500; the 10 largest constituents account for 40%.
A disproportionate share of SPX returns has been tied to this small cohort, with only 28 of the 503 names accounting for more than 50% of recent returns. Equal weight performance has massively lagged cap-weighted benchmarks, with the ratio of SPW vs. SPX now in only the 7th percentile of its 1-year range.
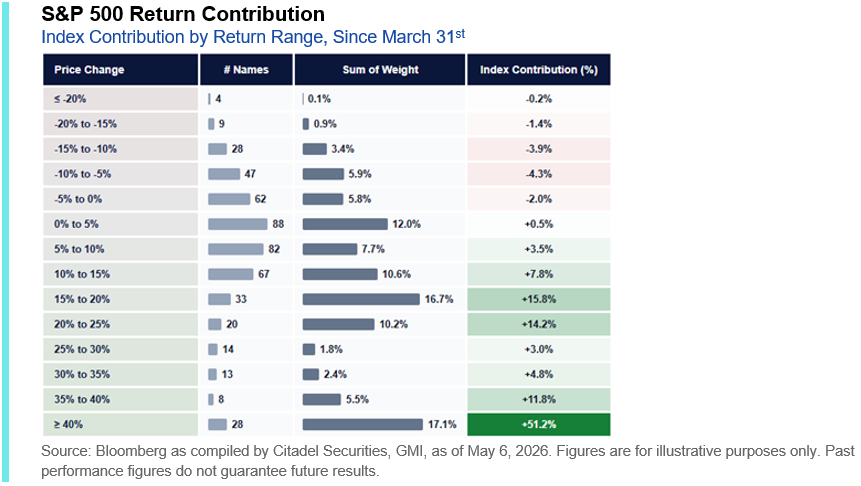
Importantly, this also suggests there is room for the rally to broaden in the near-term.
With volatility lower, positioning cleaner, and the rates backdrop stabilizing, conditions are increasingly supportive of a wider set of themes participating in the move. A rotation beyond the largest index constituents (and Tech in general) would likely be required to sustain the next leg higher.
III. Retail Re-Engaged – and is Driving the Tape
We continue to see strong client engagement across markets, consistent with our leading retail presence.
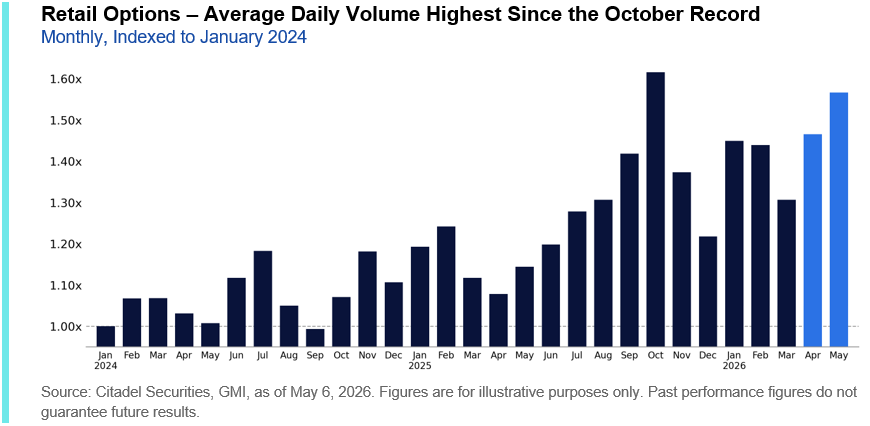
Following the seasonal slowdown that we highlighted in our last update, retail participation has reaccelerated meaningfully in recent weeks. As the #1 U.S. retail market maker, executing approximately 35% of all U.S.-listed retail volume, Citadel Securities is uniquely positioned to track these flows in real time.
Retail-driven momentum and short squeeze dynamics remain a dominant force in the market today.
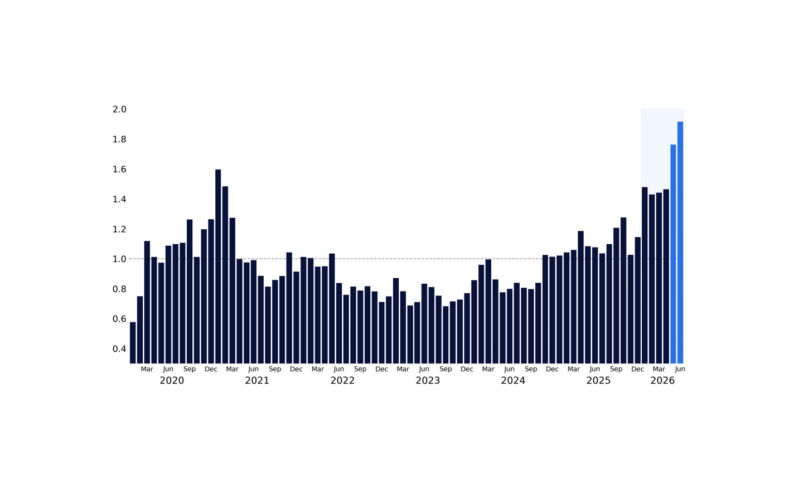
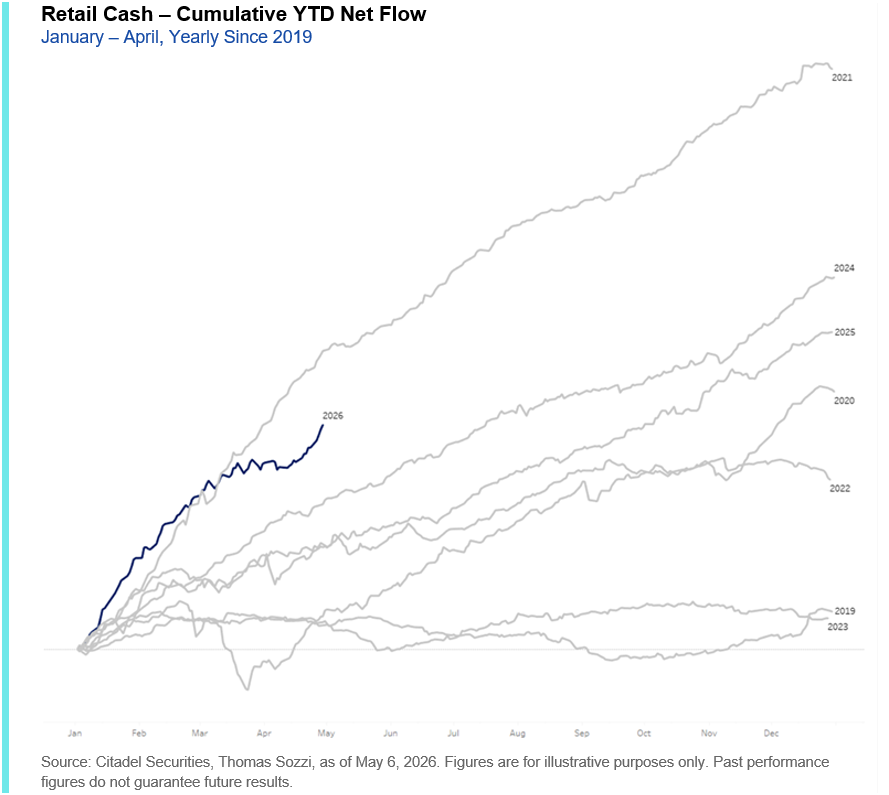
Our colleague Thomas Sozzi highlighted that aggregate retail investor equity flows on our platform sharply accelerated in April after experiencing a brief pause from the record inflows to begin the year. The net buying on our platform last week alone was in the 98th percentile of weekly flows since 2019. Monthly net flows for April clocked in at the 87th percentile of monthly activity since 2019.
As Allie Becher also discussed in our latest Retail Detail, retail began April defensively, with put activity briefly reaching the 99th percentile and, at peak bearishness, trading more puts than calls – a rare occurrence. That tone shifted rapidly as markets stabilized, with positioning normalizing and ultimately flipping to outright upside participation. By late April, net call buying surged into the 95th percentile, reflecting a clear shift toward performance chasing.
This late-month euphoria was characterized by a clear rotation back into high-beta, thematic trades, an area that has historically coincided with periods of elevated enthusiasm. Interest re-emerged across themes like quantum computing, rare earths, and nuclear energy, alongside renewed engagement in mega-cap tech.
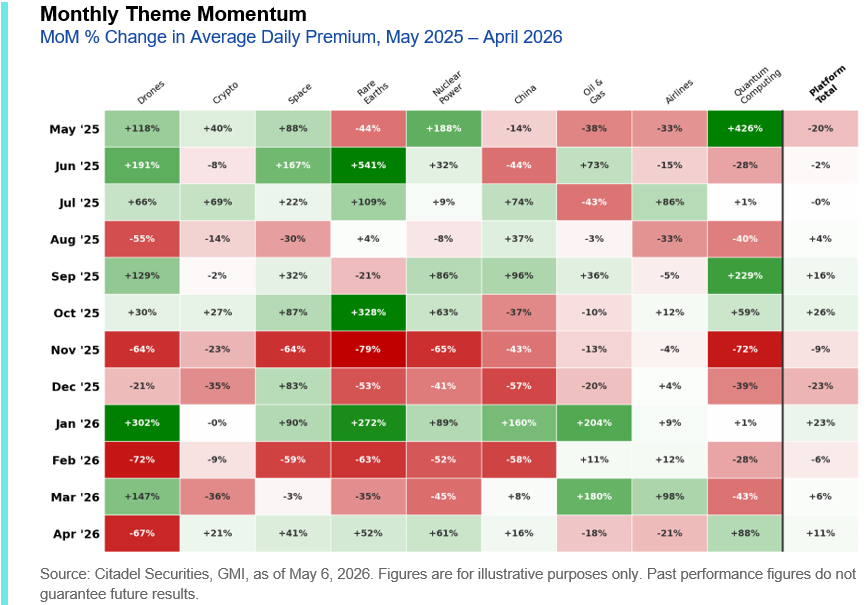
If the rally begins to broaden, retail participation in these higher-beta and thematic segments is likely to become even more visible, just as we saw at the beginning of the year.
GMI BOTTOM LINE
Markets have held up remarkably well – earnings are solid, technicals have improved, and retail is back.
But it’s still a concentrated rally, with a handful of names doing most of the work. A broadening in participation would likely be required to sustain the next leg higher – and, if realized, could unlock further upside from here.

Copyright © Citadel Enterprise Americas LLC or one of its affiliates. All rights reserved.
Legal Entities Disseminating this Material: This material is disseminated in the United Kingdom by Citadel Securities (Europe) Limited (“CDGE”) authorized and regulated by the Financial Conduct Authority (“FCA”) (Registered company number: 05462867); in the European Union by Citadel Securities GCS (Ireland) Limited (“CSGI”) and its Paris Branch authorized and regulated by the Central Bank of Ireland (“CBI”) (Registration Number: C173437); in Hong Kong by Citadel Securities (Hong Kong) Limited (“CDHK”) licensed by the Securities and Futures Commission of Hong Kong (“SFC”), in Japan by Citadel Securities Japan Co., Ltd (“CSJC”) registered as a Type 1 financial instruments business operator with the Japan Financial Services Agency (“JFSA”); and in the United States of America by Citadel Securities LLC (“CDRG”) registered with the Securities Exchange Commission (“SEC”), Financial Industry Regulatory Authority (“FINRA”), and Securities Investor Protection Corporation (“SIPC”), Citadel Securities Institutional LLC (“CSIN”) registered with the SEC, FINRA, and SIPC, or Citadel Securities Swap Dealer LLC (“CSSD”) registered with the SEC, Commodities Futures Trading Commission (“CFTC”), and National Futures Association (“NFA”). Unless governing law permits otherwise, you must contact a Citadel Securities entity in your home jurisdiction if you want to use our services in effecting a transaction in any financial instruments or securities, including derivatives.
FOR INSTITUTIONAL USE ONLY; FOR PROFESSIONAL CLIENTS AND ELIGIBLE COUNTERPARTIES ONLY. This material is not intended as and does not constitute investment research. Contents of this material will be strictly limited to non-specific, generic information (i.e. macro events/topics) and are not subject to the Markets in Financial Instruments directive (MiFID II) or FINRA research rules. This material does not constitute an offer, solicitation, invitation, or inducement to purchase, acquire, subscribe to, provide, or sell any financial instrument or otherwise engage in investment activity. Please see additional important disclosures, including disclosures that may be relevant to your country of residence or business at www.citadelsecurities.com/GlobalSalesTrading.