-
Who We Are
- What We Do
Series: Global Market IntelligenceRules and Tools
By Scott Rubner
Positive news out of Washington overnight, check. I met with a wide range of investors at our two conferences in Miami last week, and sentiment remains decidedly cautious. Despite recent market resilience, the tone last week was deeply bearish, reflecting the growing wall of worry that continues to define late 2025.
As a part of a panel on year-end macro outlook entitled “The Rub”, I highlighted these concerns and how they contrast with increasingly constructive year-end technicals. Despite the skepticism, clients continue to lean into weakness rather than fade it, adding exposure on every bout of market pullback. With just 36 trading days left in 2025, the debate between fear and positioning is reaching its peak.
Corporate earnings have been exceptionally strong this season. With 90% of S&P 500 companies having reported, 82% have beaten EPS expectations, and aggregate year-over-year earnings growth is tracking near 12%. Nvidia reports on November 19, 2025, with options implying a 6.3% move — representing a record ~$287 billion potential swing in market capitalization. Short positioning locally remains elevated and may see covering given the early morning equity gains.
Citadel Securities’ Retail Gross Notional (Indexed)
Indexed to January 2019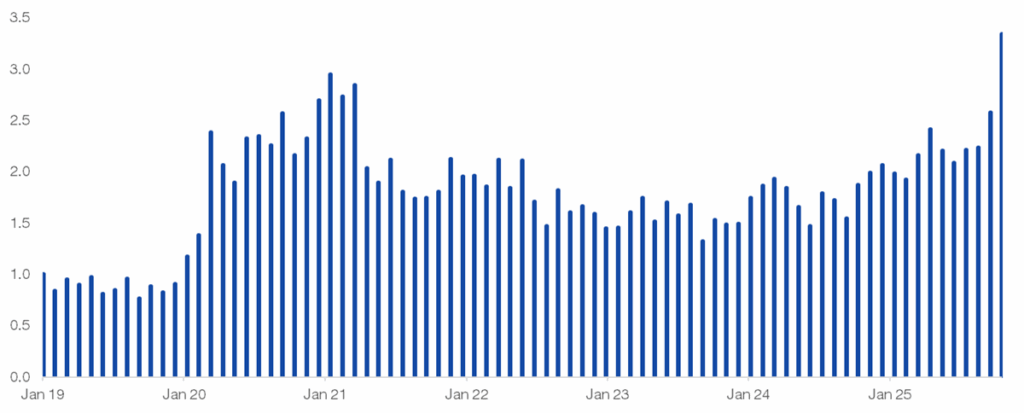
Source: Citadel Securities, Thomas Sozzi, as of November 10th, 2025. Figures are for illustrative purposes only. Past performance figures do not guarantee future results.Citadel Securities’ Retail Net Notional (Indexed)
Indexed to January 2019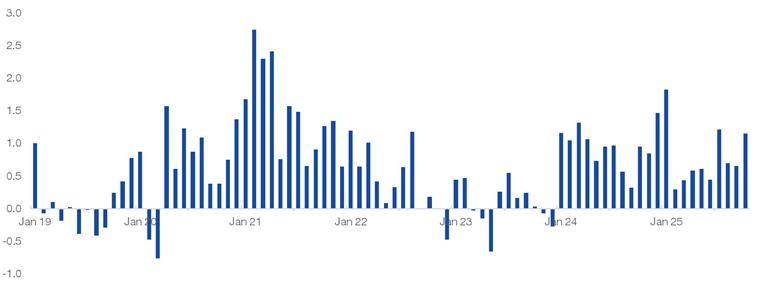
Source: Citadel Securities, Thomas Sozzi, as of November 10th, 2025. Figures are for illustrative purposes only. Past performance figures do not guarantee future results.Options Volume Hits New Highs
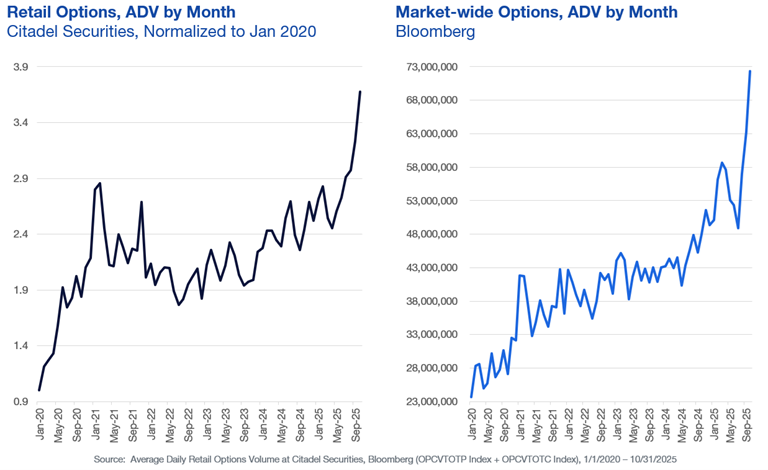
Source: Citadel Securities, Allie Becher, as of November 10th, 2025. Figures are for illustrative purposes only. Past performance figures do not guarantee future results.
This Week in Markets: Wall of Worry (Inside the Castle Panel)
- Government Shutdown, Investors Shrug (for Now): Positive news overnight, check. Markets remain largely unconcerned about the ongoing fiscal standoff in Washington – at least until it begins to disrupt travel or consumer confidence. The base case remains that a resolution is reached next week, setting the stage for a short-term relief rally in equities.
- AI CapEx Mania and the Credit Undercurrent: AI investment narratives have reached saturation, bordering on self-parody. A cooling period in sentiment could ultimately favor industry leaders. Meanwhile, tighter funding conditions are quietly surfacing beneath the credit market’s calm exterior.
- Valuations Remain Stretched: Equity valuations look expensive by nearly every measure, and executives are increasingly acknowledging this. Markets remain priced for perfection amid fading earnings momentum.
- Fed Still Leaning Hawkish: Fed Funds Futures imply a 66% probability of a 25bp cut at the December meeting. The key debate: how much further can rate-cut expectations decline before data justify a genuine policy pivot?
- Repo Market Stress, Liquidity Tightens: Liquidity is emerging as the unspoken risk factor. The Treasury General Account drain continues to pressure funding markets, with repo stress now a daily talking point on trading desks.
- U.S. Election Watch – Sentiment Risk Ahead: The upcoming election remains a secondary concern, but political noise has a way of creeping into markets. Expect rising volatility as rhetoric heats up.
- Crypto Deleveraging, Positioning for Rebound: Once government operations resume, expect renewed participation across digital assets. Consensus remains constructive, with roughly +10% upside expected for Bitcoin.
- Private Credit and Early Signs of Strain: Private credit markets are showing early cracks. Any deterioration could have broader implications for corporate funding.
- Breadth Breakdown – Concentration at Extremes: SPX has effectively become a concentration trade: roughly 40% of flows are directed toward the top 10 names on both the buy and sell side. This narrowing breadth underscores fragility beneath surface stability.
- The K-Shaped Economy and Divergent Consumers: The divide between high- and low-income consumers continues to widen. Long SPX vs. short low-end retail remains a clean macro trade capturing consumer bifurcation.
Against this macro backdrop, Citadel Securities’ data provides a window into positioning dynamics beneath the surface. Retail buying has now become the dominant stabilizing force during equity drawdowns.
It’s time for a thread 🧵
Team Update: Welcoming Ryan Preclaw and Introducing Retail RORO
We’re pleased to welcome Ryan Preclaw, our new Head of Content Data Science, joining to accelerate efforts to harness Citadel Securities’ data and technology to generate impactful insights for our clients.
Alongside his arrival, we’re introducing a new framework for analyzing retail investor behavior – the Retail Risk On / Risk Off (Retail RORO) measure. This flexible tool tracks whether retail investors are increasing or reducing exposure to different forms of market risk.
Built using Principal Component Analysis (PCA), Retail RORO leverages Citadel Securities’ data to provide a distinctive perspective on retail sentiment. For additional details on construction and methodology, please reach out to discuss.
Retail RORO Indicator – 50 Most Liquid
Positive = Risk On | Negative = Risk Off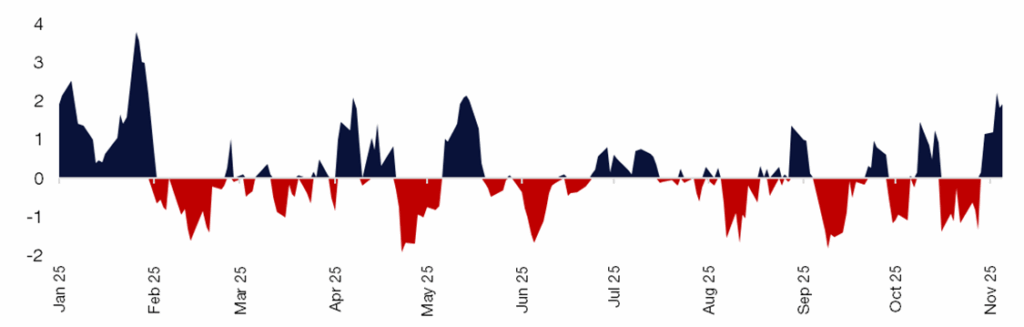
Source: Citadel Securities, as of November 10th, 2025. Figures are for illustrative purposes only. Past performance figures do not guarantee future results.Retail RORO Indicator – Magnificent 7
Positive = Risk On | Negative = Risk Off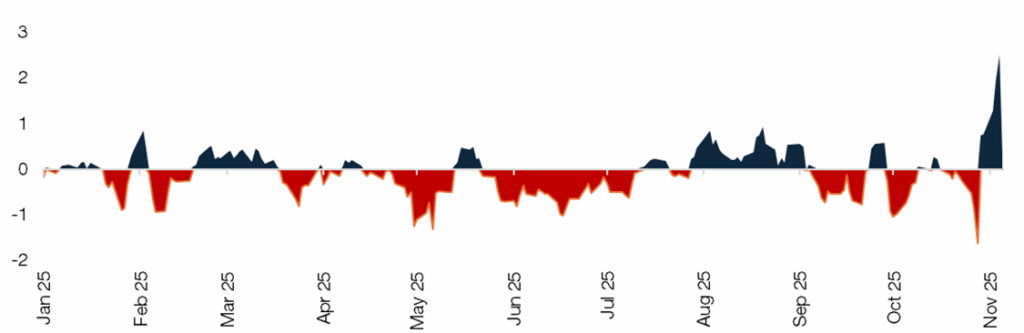
Source: Citadel Securities, as of November 10th, 2025. Figures are for illustrative purposes only. Past performance figures do not guarantee future results.Historical Retail RORO – 50 Most Liquid
SPX weekly performance following retail risk behavior implied by Retail RORO and market state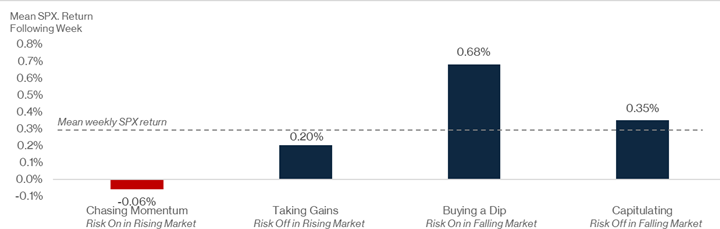
Source: Citadel Securities, as of November 10th, 2025. Figures are for illustrative purposes only. Past performance figures do not guarantee future results.
This week saw the 5th strongest retail dip-buying in the past 2 years.
Retail RORO provides a leading signal for risk appetite among retail investors — a potential early indicator for tactical market inflection points.
Current State of Retail RORO – 50 Most Liquid
Most recent week’s aggregate retail risk behavior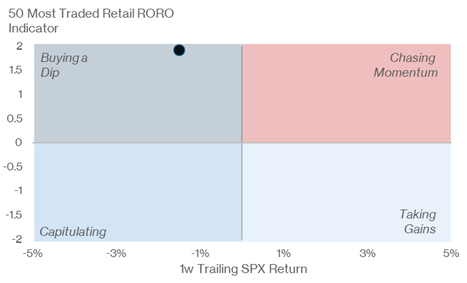
Source: Citadel Securities, as of November 10th, 2025. Figures are for illustrative purposes only. Past performance figures do not guarantee future results.
I. GMI – Rules and Tools
NDX posted its sharpest weekly drop since April 4, 2025 (“Liberation Day”), falling -3.1%. Over the past 3 years, there have been only 13 such weeks – and subsequent returns have historically been strong.
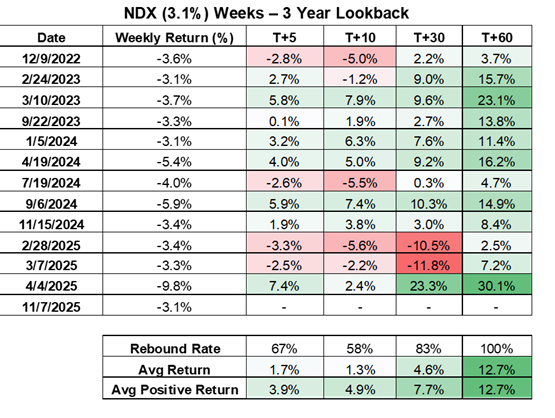
Source: Citadel Securities, as of November 10th, 2025. Figures are for illustrative purposes only. Past performance figures do not guarantee future results.
SPX also declined -1.6% last week. Historically, such pullbacks have also produced positive forward returns, albeit with less consistency.
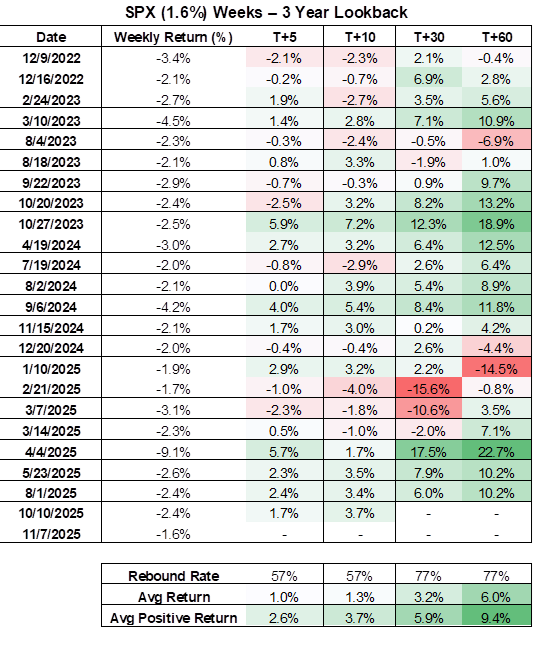
Source: Citadel Securities, as of November 10th, 2025. Figures are for illustrative purposes only. Past performance figures do not guarantee future results.
II. Client Activity (Citadel Securities)
Takeaway: Retail investors continue to add into weakness, becoming the new price setters.
- Retail Equities: Net buyers in 26 of last 30 weeks
- Retail Options: 28-week net buying streak (another record)
- Retail ETFs: ETF buyers in 230 of 232 trading days, 170 straight days
- Institutions: Bearish tone, have shifted toward call exposure
- Seasonality: SPX and NDX closed higher in 12 of the last 13 Novembers
III. Retail Positioning – Rationally Persistent
1. Retail Demand: Citadel Securities’ Retail Equities clients: Net buyers in 26 of the last 30 weeks, rebounding after April weakness.
During the latest pullback, retail flows showed one of the largest “buy-the-dip” events on record.
Retail Cash Equities – Net Notional by Week (Std Dev)
January – November 2025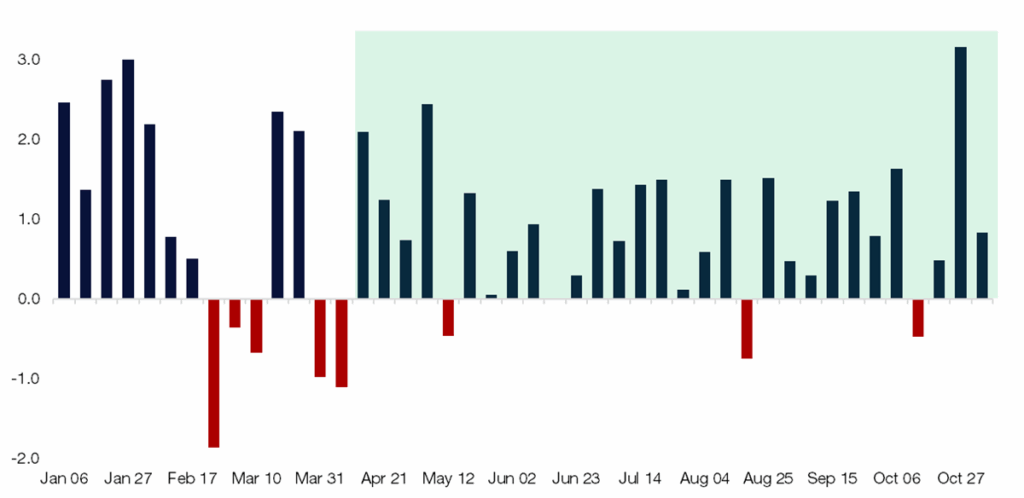
Source: Citadel Securities, as of November 7th, 2025. Figures are for illustrative purposes only. Past performance figures do not guarantee future results.2. Citadel Securities’ Retail Equity client seasonal demand trends from the last 8 years: Sep weakest → Oct builds → Nov strongest
Retail Cash – Proportion of Net Notional by Month
August 1, 2017 – September 29, 2025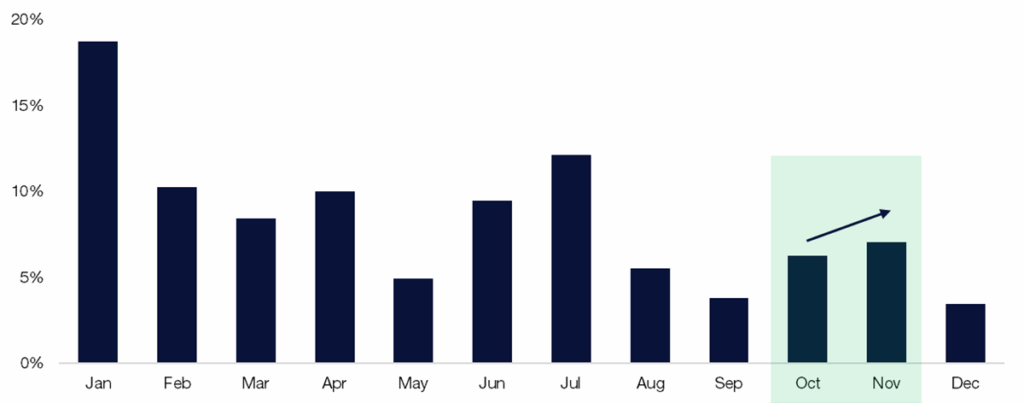
Source: Citadel Securities, as of November 7th, 2025. Figures are for illustrative purposes only. Past performance figures do not guarantee future results.IV. Volatility & Options Positioning
3. Citadel Securities’ Retail Options client bullish streak watch
- Retail options demand: 28 straight weeks (record) 🐂
Retail Options – Call / Put Direction Ratio by Week (%)
January – November 2025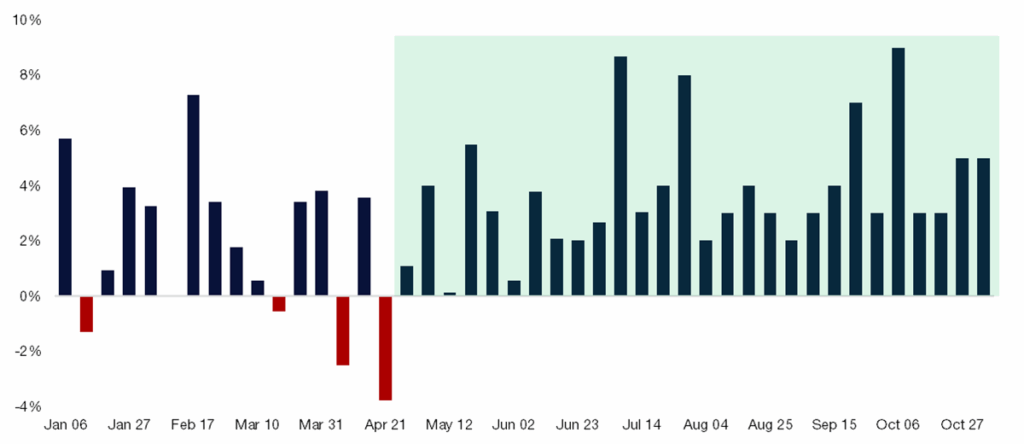
Source: Citadel Securities, as of November 7th, 2025. Figures are for illustrative purposes only. Past performance figures do not guarantee future results.
4. Longest Retail Weekly Option Buying Streaks on Record, since 2020
Starting month, # of weeks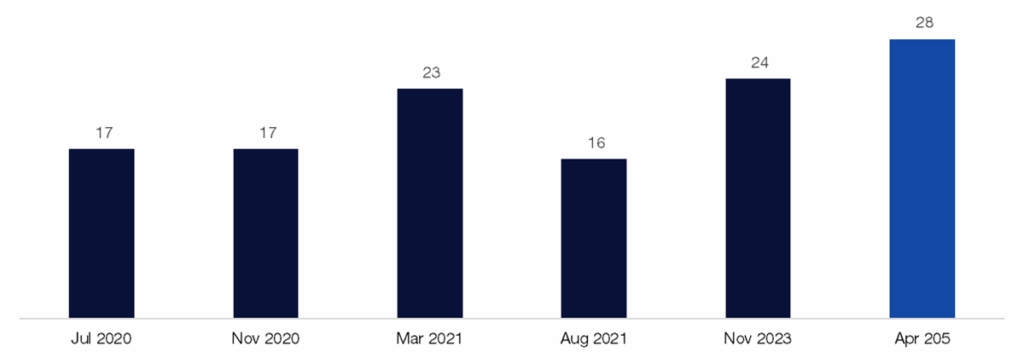
Source: Citadel Securities, as of November 7th, 2025. Figures are for illustrative purposes only. Past performance figures do not guarantee future results.
5. Retail Option acceleration in Q4
Citadel Securities’ Retail Options client volume typically wanes in September before rebounding into the final quarter of the calendar year. Activity picks back up in Q4, with November the strongest month of the year.
Retail Options – Proportion of Contract Volume by Month
January 2020 – December 2024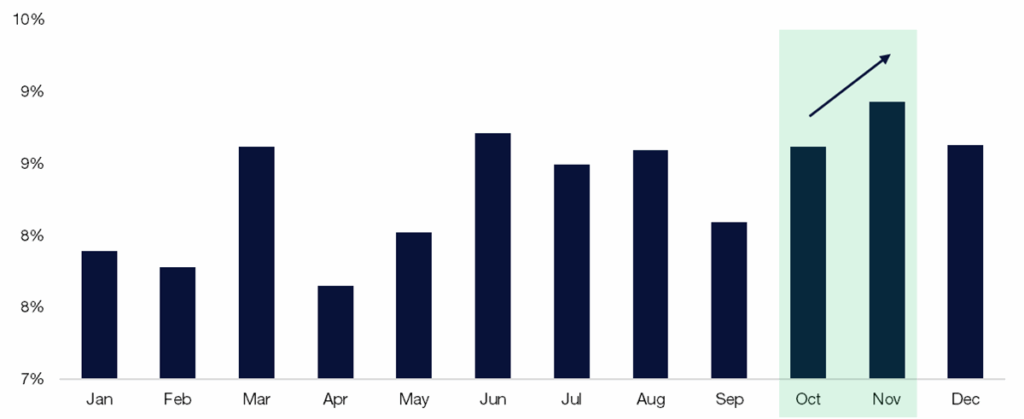
Source: Citadel Securities, as of November 7th, 2025. Figures are for illustrative purposes only. Past performance figures do not guarantee future results.
6. Citadel Securities’ Institutional Options clients shifted towards calls/hedges.
- Bearish at the macro dinners, but buying calls?
- FOMU – “fear of material underperformance” to benchmark indices remains a key driver. This week investors were happy that benchmark indices moved lower, to play catch up and add exposure.
Institutional Options – Call/Put Direction Ratio by Week
January – November 2025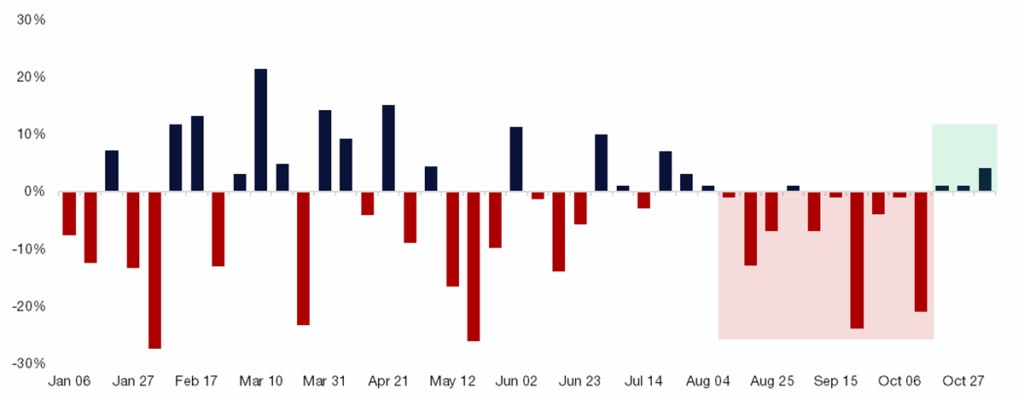
Source: Citadel Securities, as of November 7th, 2025. Figures are for illustrative purposes only. Past performance figures do not guarantee future results.
V. Corporates Demand: 2025 into 2026
- I’m spending time on the 2026 flow-of-funds framework. Do corporates continue to buy back stock at this pace in 2026 given cash flow needs? Corporates have repurchased >$1T in each of the past two years and have been the largest buyers of equities.
- 80% of the S&P 500 Market Cap has reported earnings. We are fully in the open corporate window.
- EventVestor: U.S. authorizations have surpassed $1.3T (fastest pace on record) for Russell 3000; could reach $1.5T by year-end. Assuming a 90% execution rate means $1.35T actual executions (a record). S&P 500 companies have seen $1T authorizations YTD. Keep an eye on this dynamic after reported Q3 results.
- Buyback math: ~$1.35T of VWAP executions over 251 trading days ≈ $5.3B of implied daily buyback demand.
- Nov–Dec are historically the strongest buyback execution months for U.S. corporates. I expect corporates to fill their authorizations by end of 2025.

Source: EventVestor as compiled by Citadel Securities, as of September 29th, 2025. Figures are for illustrative purposes only. Past performance figures do not guarantee future results.
GMI Bottom Line: Wall of Worry vs. Positive Technical Backdrop
Equity futures are ticking neon green as I type this morning. Locally short positioning in macro products remains elevated. Despite pervasive macro anxiety, positioning and flows tell a different story. Retail and corporate demand continue to underpin markets, suggesting the year-end rally is delayed—not derailed.
Copyright © Citadel Enterprise Americas LLC or one of its affiliates. All rights reserved.
Legal Entities Disseminating this Material: This material is disseminated in the United Kingdom by Citadel Securities (Europe) Limited (“CDGE”) authorized and regulated by the Financial Conduct Authority (“FCA”) (Registered company number: 05462867); in the European Union by Citadel Securities GCS (Ireland) Limited (“CSGI”) and its Paris Branch authorized and regulated by the Central Bank of Ireland (“CBI”) (Registration Number: C173437); in Hong Kong by Citadel Securities (Hong Kong) Limited (“CDHK”) licensed by the Securities and Futures Commission of Hong Kong (“SFC”), in Japan by Citadel Securities Japan Co., Ltd (“CSJC”) registered as a Type 1 financial instruments business operator with the Japan Financial Services Agency (“JFSA”); and in the United States of America by Citadel Securities LLC (“CDRG”) registered with the Securities Exchange Commission (“SEC”), Financial Industry Regulatory Authority (“FINRA”), and Securities Investor Protection Corporation (“SIPC”), Citadel Securities Institutional LLC (“CSIN”) registered with the SEC, FINRA, and SIPC, or Citadel Securities Swap Dealer LLC (“CSSD”) registered with the SEC, Commodities Futures Trading Commission (“CFTC”), and National Futures Association (“NFA”). Unless governing law permits otherwise, you must contact a Citadel Securities entity in your home jurisdiction if you want to use our services in effecting a transaction in any financial instruments or securities, including derivatives.
FOR INSTITUTIONAL USE ONLY; FOR PROFESSIONAL CLIENTS AND ELIGIBLE COUNTERPARTIES ONLY. This material is not intended as and does not constitute investment research. Contents of this material will be strictly limited to non-specific, generic information (i.e. macro events/topics) and are not subject to the Markets in Financial Instruments directive (MiFID II) or FINRA research rules. This material does not constitute an offer, solicitation, invitation, or inducement to purchase, acquire, subscribe to, provide, or sell any financial instrument or otherwise engage in investment activity. Please see additional important disclosures, including disclosures that may be relevant to your country of residence or business at www.citadelsecurities.com/GlobalSalesTrading.
Explore
Market Insights - What We Do