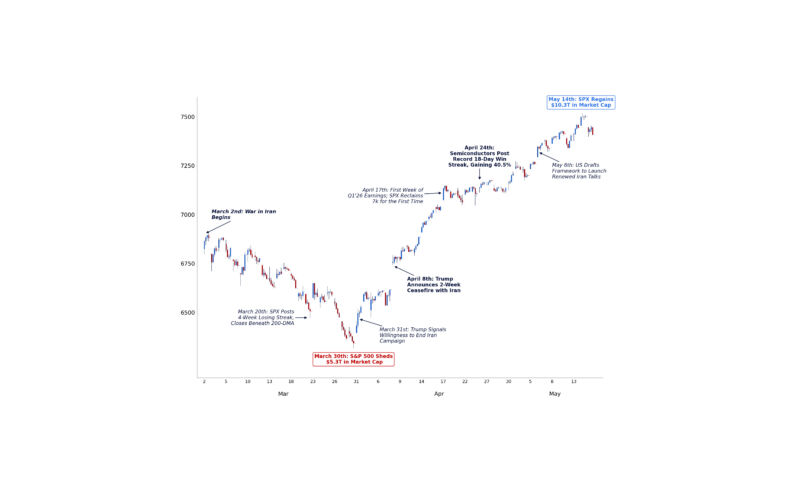
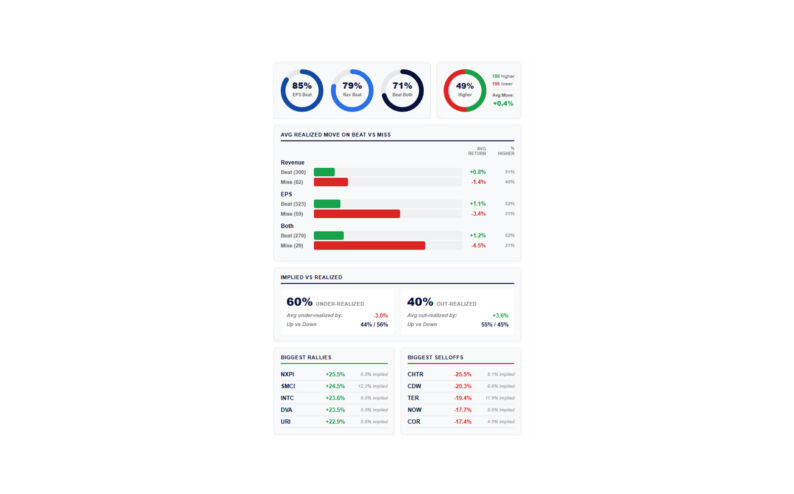
The S&P 500 has made 26 all-time highs this year despite a wall of macro worry. Why?
Because underneath the noise, the balance of flows is beginning to shift.
The macro crosscurrents are real, dispersion remains extreme, and positioning has moved quickly. There are plenty of reasons to be cautious, which is why most of my inbound continues to focus on the same question: What can go wrong?
That question still matters. But for August, I think there is a more interesting one:
Who becomes a buyer higher? The answer matters because the list of buyers is getting longer.
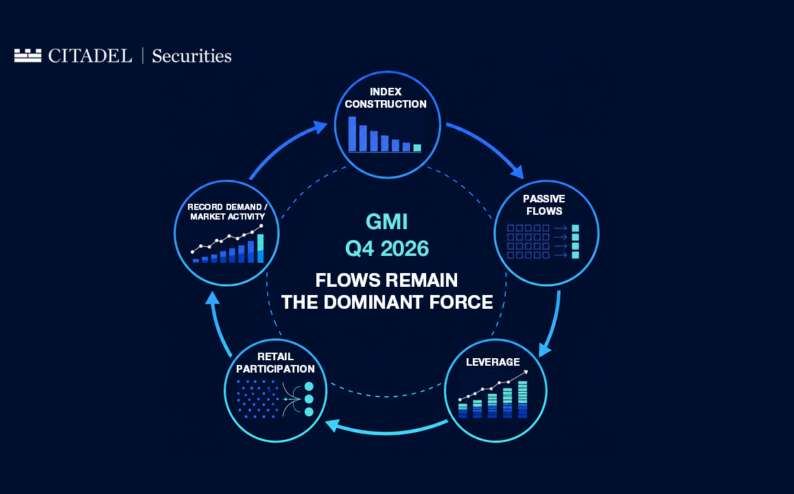
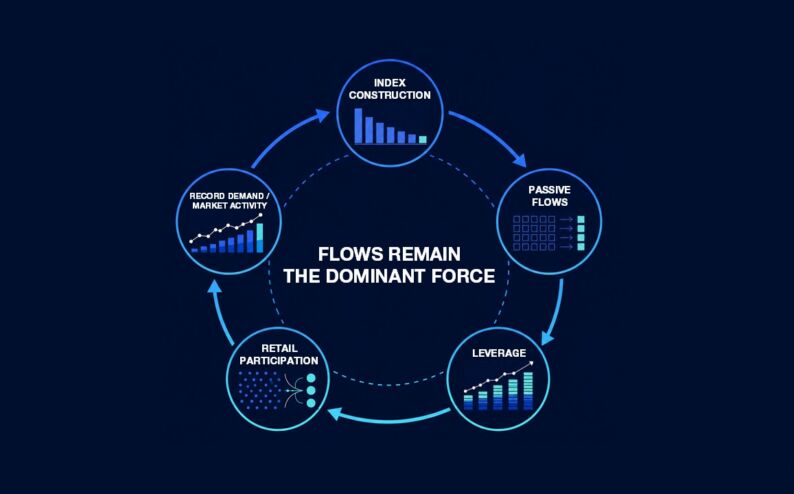
Earnings are beating while multiples compress. The leverage reset has largely run its course, creating room for systematic strategies to add exposure as volatility falls. Retail is buying again. Passive demand remains relentless. More than $1 trillion of corporate buyback authorizations are coming back into an open window. Breadth is improving, correlation is near record lows, and investors are increasingly willing to pay for upside.
No single one of these forces determines the market.
But when several sources of demand strengthen at the same time that selling pressure fades, the flow asymmetry changes.
Earlier this year, the market was absorbing deleveraging and crowded positioning. Today, much of that pressure has passed, buying capacity is rebuilding, and the first signs of upside demand are beginning to emerge.
That is the setup for August.
Here are the 10 things on my GMI Checklist right now.

2. Valuation: Earnings are Doing the Work
3. Leverage: The Reset is Mature
4. Retail: Buyers are Back
5. Passive Flows: The Bid Never Left
6. Buybacks: $1 Trillion Comes Back Online
7. Index Construction: SPX is Not the Market
8. Dispersion: Breadth Up, Correlation Down
9. Volatility: Below 15 Changes the Math
10. Options: Hedging the Right Tail
GMI Bottom Line
1. Earnings: Better than Feared
Start with earnings.
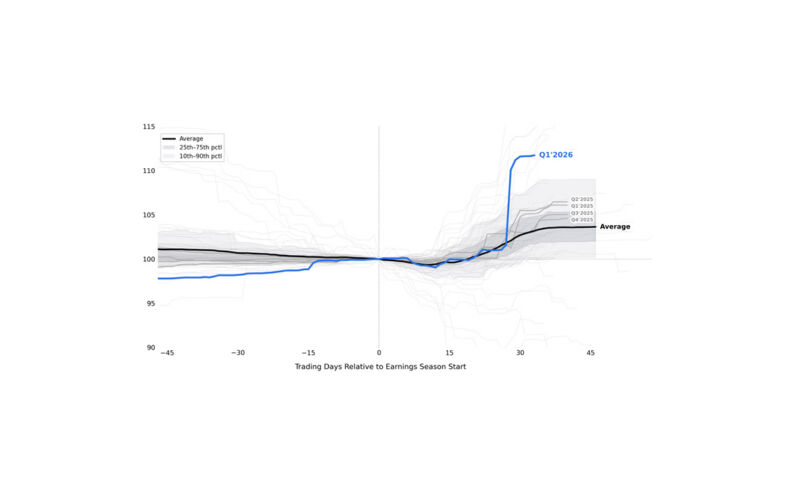
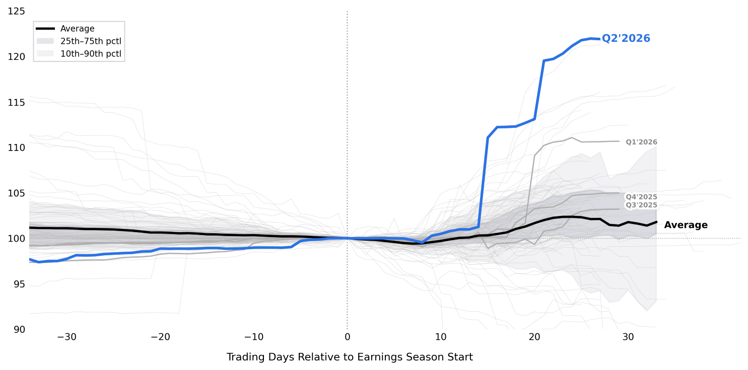
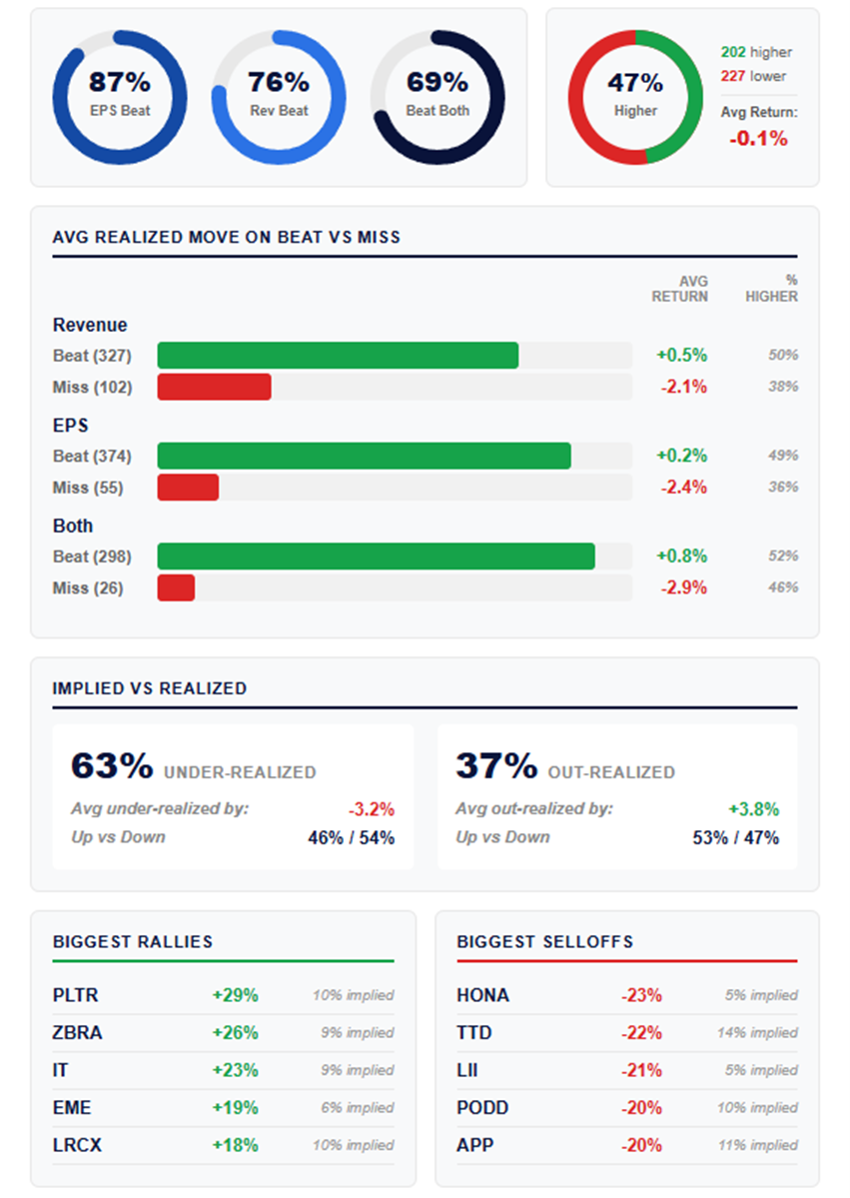
Q2 is tracking toward one of the largest beats on record, with S&P 500 EPS growth running at approximately 33%, the strongest pace outside of post-recession recoveries.
Companies are not simply beating elevated expectations. They are driving the steepest earnings revision path since at least 2000.
Importantly, this is not just an AI story. The macro debate remains complicated, but the message from corporate America is much simpler:
Earnings are better than expected, and by a wide margin.
2. Valuation: Earnings are Doing the Work
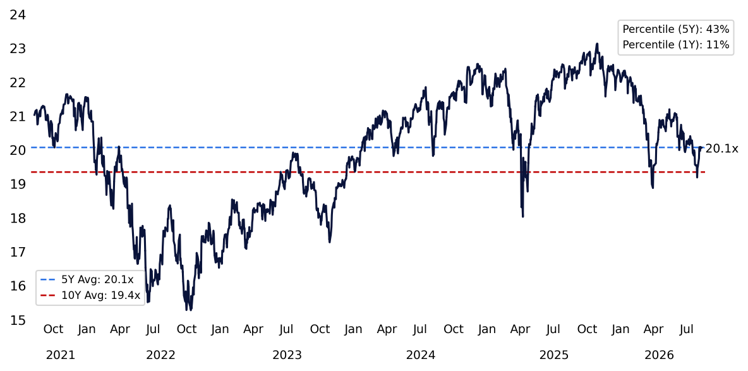
This is one of the charts I keep coming back to.
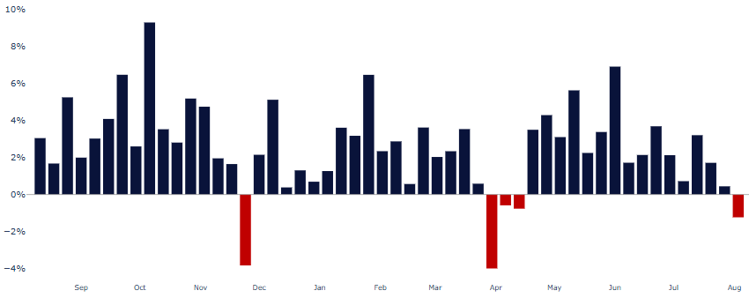
The S&P 500 is making all-time highs while its forward multiple is falling.
The 12-month forward P/E is approximately 20.1x today versus 23.1x last October, roughly 15% multiple compression despite a higher index.
Why? Earnings estimates are rising faster than prices.
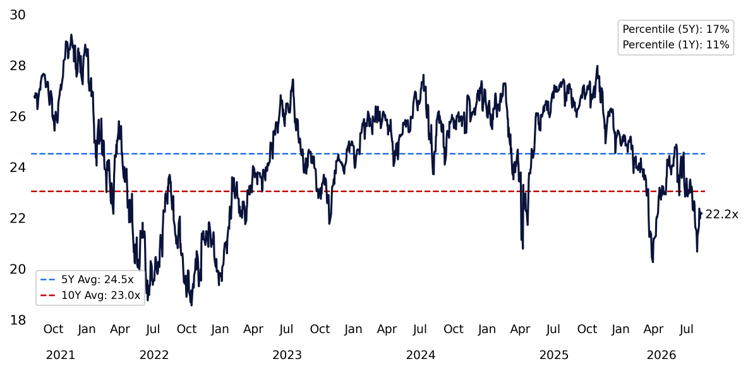
The equal-weight S&P trades at approximately 17.1x, while NDX forward P/E is below its 10-year average and sits in only the 11th percentile versus the past year.
There are legitimate valuation debates. But this is a very different setup from 1999.
So far, earnings, not multiple expansion, are doing the heavy lifting.
3. Leverage: The Reset is Mature
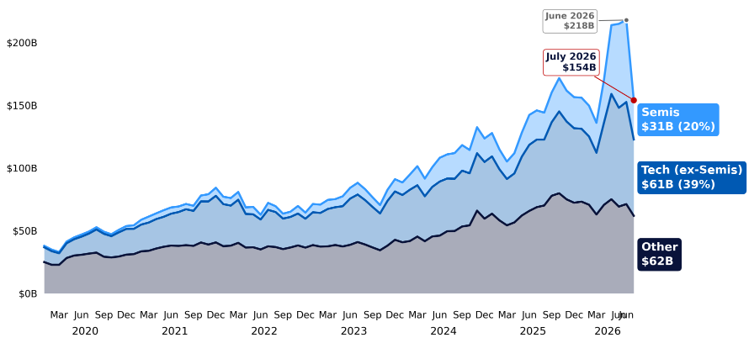
The global leverage reset looks increasingly mature. Much of the systematic deleveraging impulse has already occurred, positioning has reset, and the rules-based selling overhang is smaller.
That does not mean the market cannot go lower. It means the mechanical asymmetry is changing.
If volatility continues to fall and trends rebuild, systematic strategies can begin adding exposure again.
The next meaningful mechanical flow may be releveraging rather than deleveraging.
4. Retail: Buyers are Back
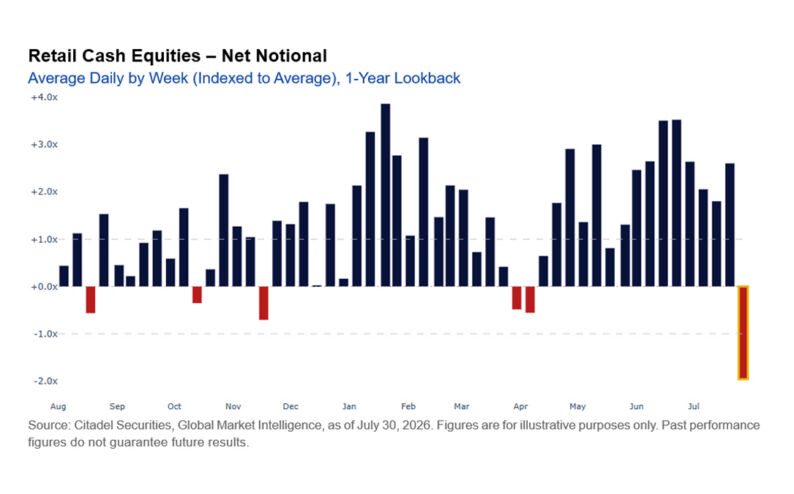
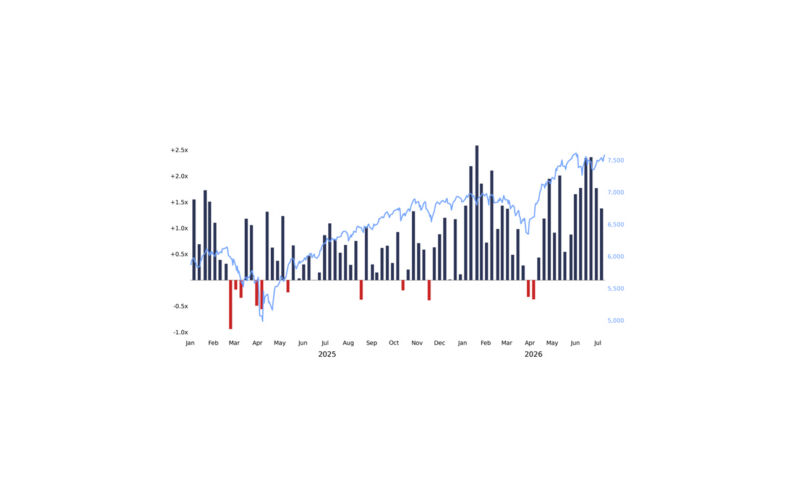
Retail returned as a net buyer across our platform last week, reversing the selling at the end of June.
The cash-equity capitulation impulse has faded and participation is rebuilding. But the more interesting signal is in options.
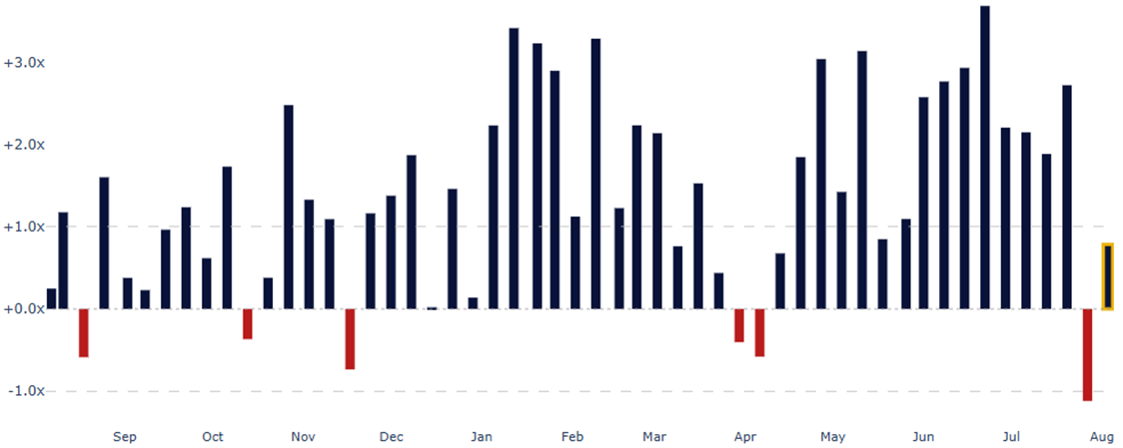
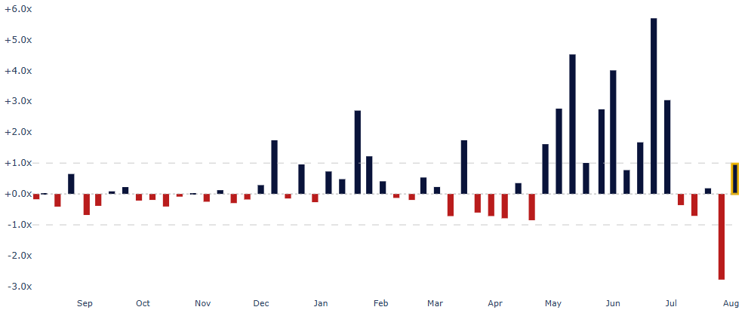
While retail was buying cash equities, traders at Citadel Securities were simultaneously hedging through options. Retail was skewed better for sale in options for the first time since April and at the lowest reading since the late March lows.
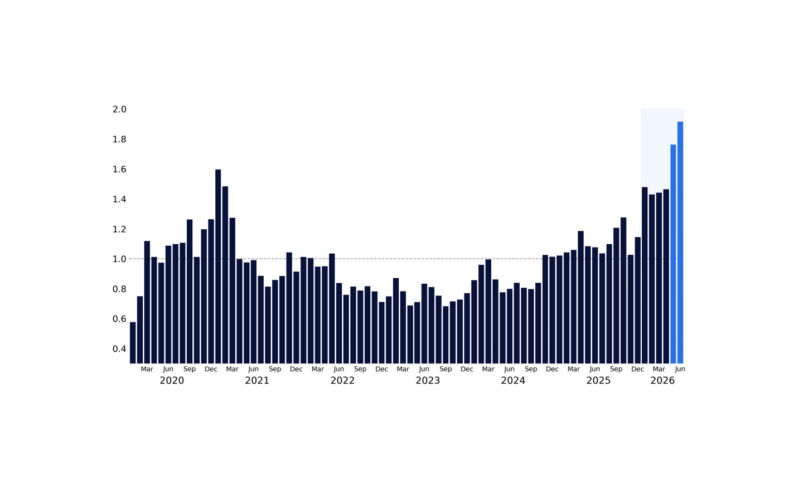
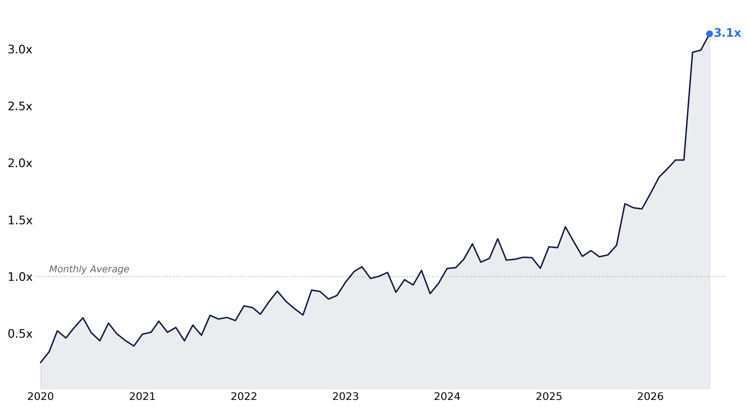
Broad-based ETF option activity has also surged. Average daily contracts this month have climbed to a record 3.1x the monthly average, while average daily net put premium has risen to approximately $29 million, roughly 8x the one-year average and nearly 10x the historical average.
Retail is buying the market again, but it is still paying for protection.
That distinction matters. Participation has returned, but conviction has not fully followed.
Markets can move quickly from caution to participation, and from participation to chasing.
5. Passive Flows: The Bid Never Left
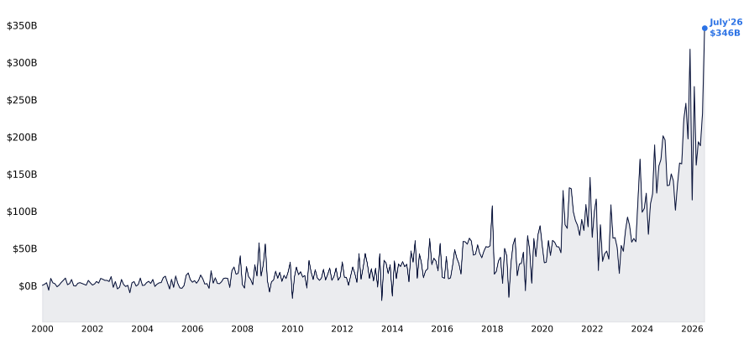
Household passive ETF demand remains exceptionally strong.
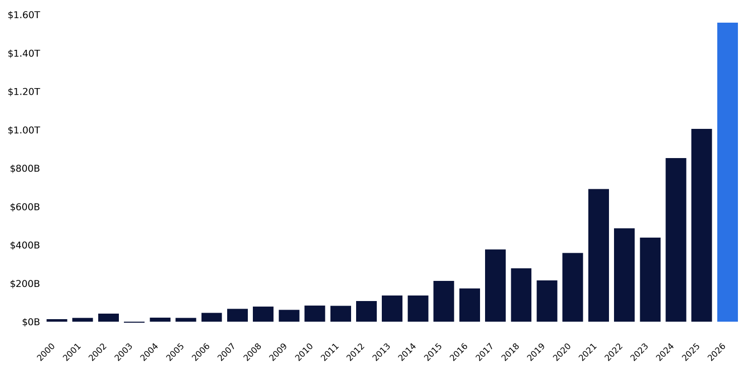
Household portfolio allocations have driven approximately $1.6 trillion of YTD inflows, or roughly $7.5 billion per day, beating the previous record pace by 55%.
July alone saw nearly $350 billion of inflows, the largest monthly total on record. Four of the ten largest months on record have occurred in 2026.
The structural passive buyer never left.
6. Buybacks: $1 Trillion Comes Back Online
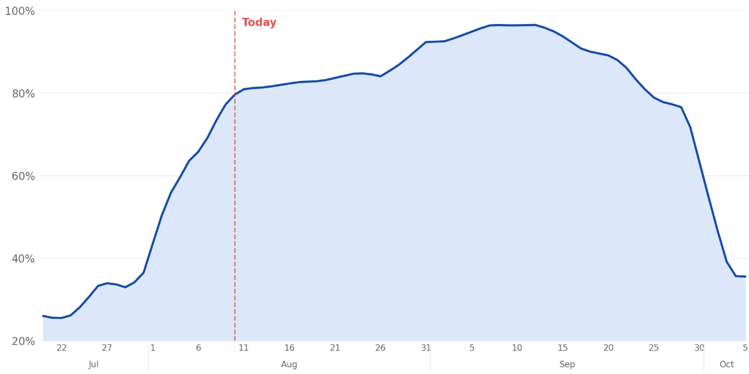
The corporate buyback window reopens this week with more than $1 trillion of announced authorizations, the largest amount on record at this point in the calendar.
August has historically been one of the stronger months for execution. Buybacks should exceed equity issuance and continue to absorb supply.
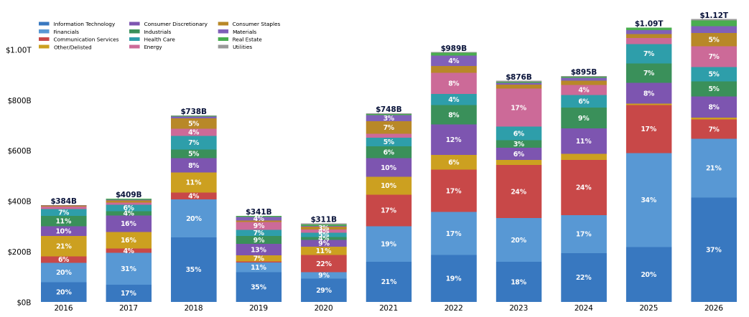
This is not just a Technology story. Nearly 70% of the largest authorized buybacks YTD are outside Tech.
The corporate bid is coming back, and it should increasingly reach the average stock.
7. Index Construction: SPX is Not the Market
This may be the most important point for understanding why this market feels so difficult.
SPX is not the average stock.
Underneath the index, outcomes have been binary and factor rotations violent. Yet SPX keeps grinding higher.
On days when the SOX Index has fallen more than 3% this year, SPX has declined only 0.8% on average versus 2.4% over the last 20 years. Software has actually been positive on average, the first such occurrence since at least 2001.
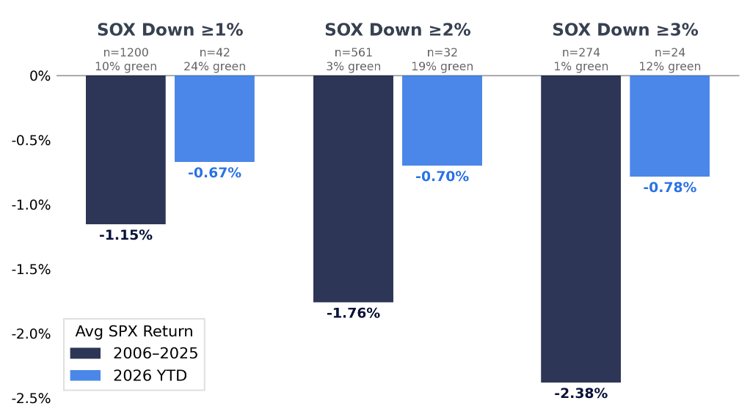
Index construction matters. Concentration matters. Where the marginal passive dollar goes matters.
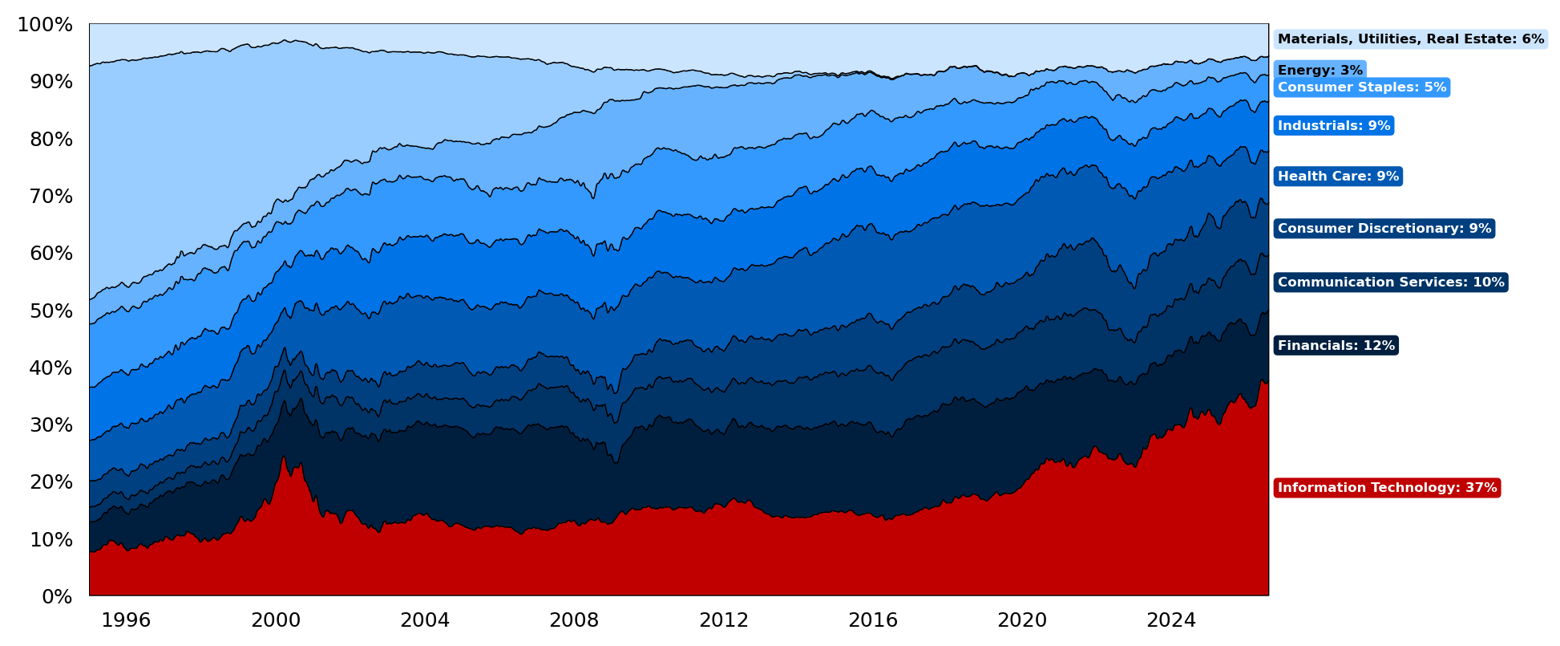
You can have a brutal market underneath the hood and a resilient headline index at the same time. Both can be true.
8. Dispersion: Breadth Up, Correlation Down
The average stock is starting to look healthier.
More than 70% of S&P 500 constituents are above their 200-day moving average, the strongest breadth since December 2024. At the same time, one-month and three-month realized correlations are near all-time lows.
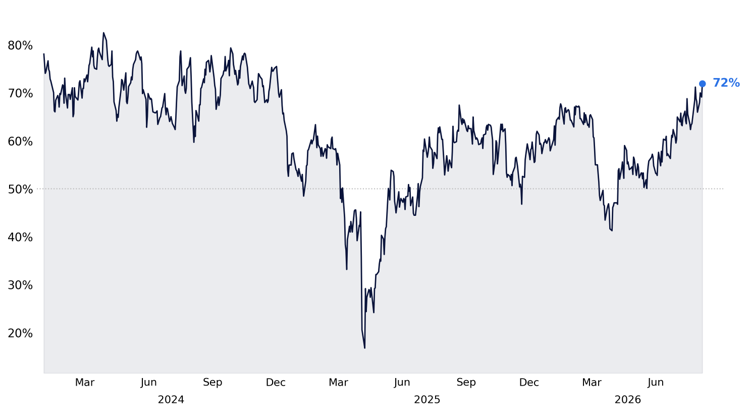
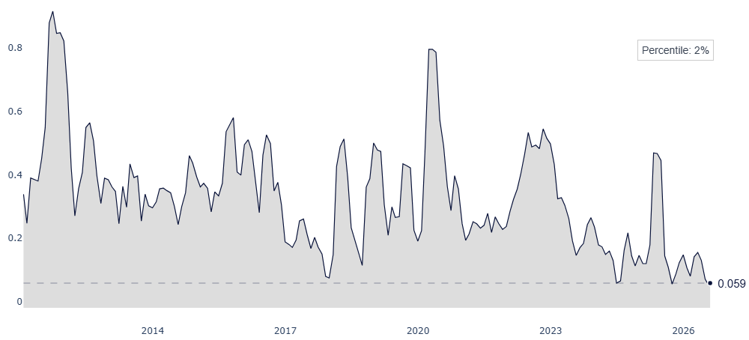
Breadth is rising while correlation is falling and dispersion remains high.
That combination is creating a richer environment for stock selection.
The opportunity set for single-stock alpha is expanding.
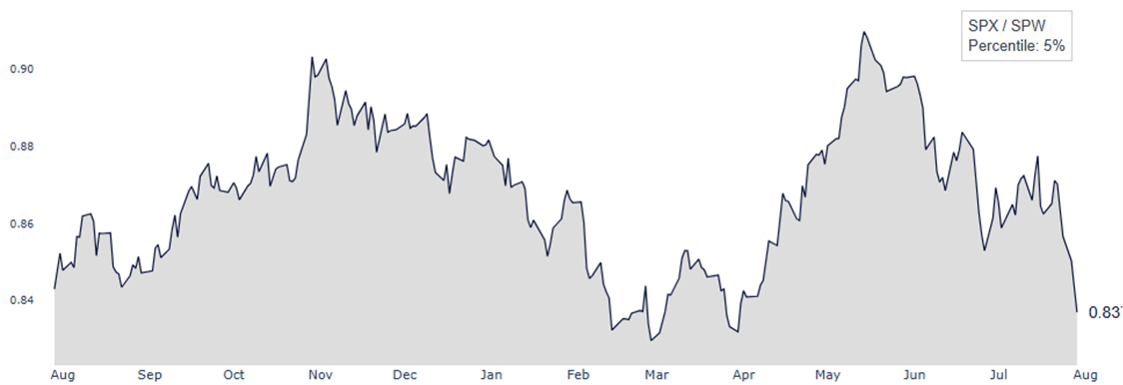
9. Volatility: Below 15 Changes the Math
Volatility may be moving from an output to an input.
Low volatility is normally viewed as a consequence of higher equities. But as 30-day and 60-day realized volatility windows reset lower, lower volatility itself creates additional capacity for systematic exposure.
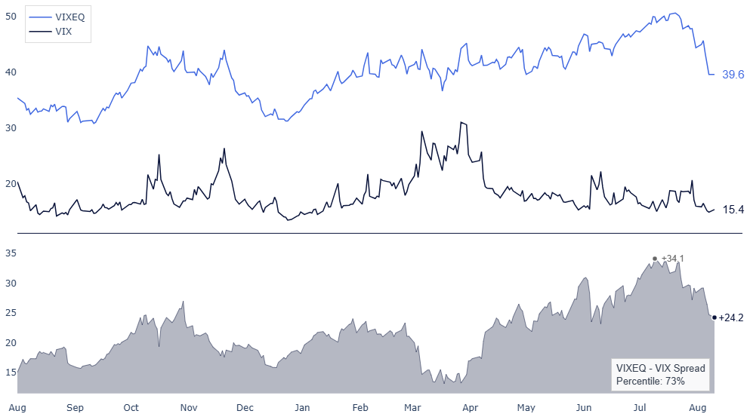
At the same time, the extreme volatility embedded in semiconductor and memory has started to normalize. Average three-month implied volatility across the 10 largest SOX constituents has fallen nearly 20 points this month, while the spread between VIXEQ and VIX has compressed sharply from record highs.
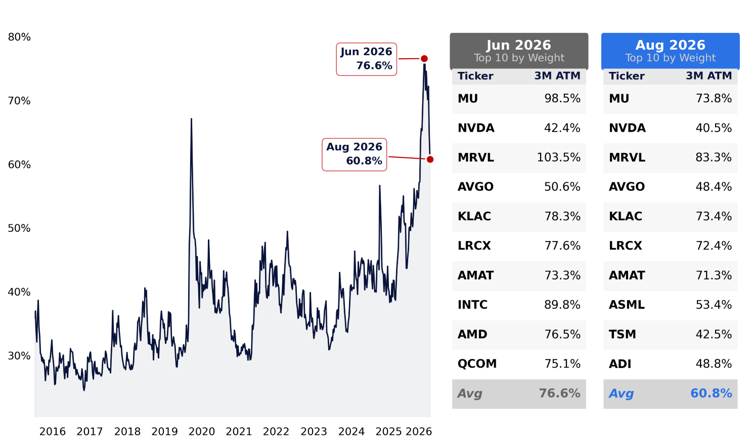
Lower volatility is no longer just describing the market. It is beginning to change the flow math.
10. Options: Hedging the Right Tail
This is the setup I am watching most closely.
As implied volatility has collapsed, demand for upside has accelerated toward record levels.
August 4 was the most active day for SPX calls on record, with volume nearly 2x the one-year average and 10% above the previous record from May. The five sessions from July 30 through August 5 also marked the largest five-day period of SPX call volume in history.
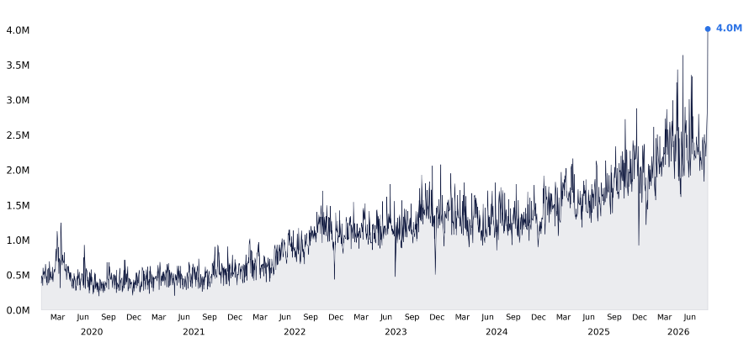
At the same time, S&P one-month and three-month 25-delta skews are at their flattest levels since January 2025. Nearly 35% of the S&P 500 is trading with inverted three-month call skew, the highest share on record.
That is the statistic I keep coming back to.
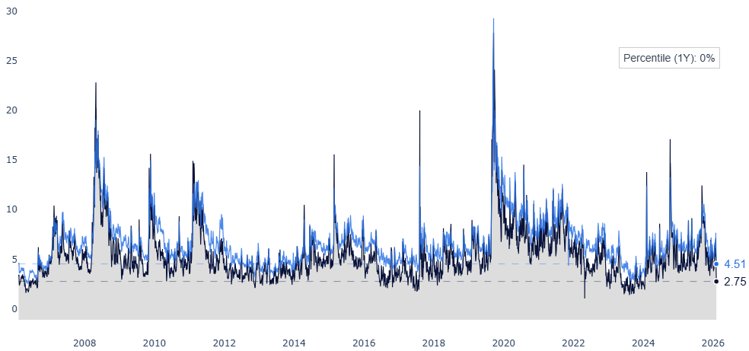
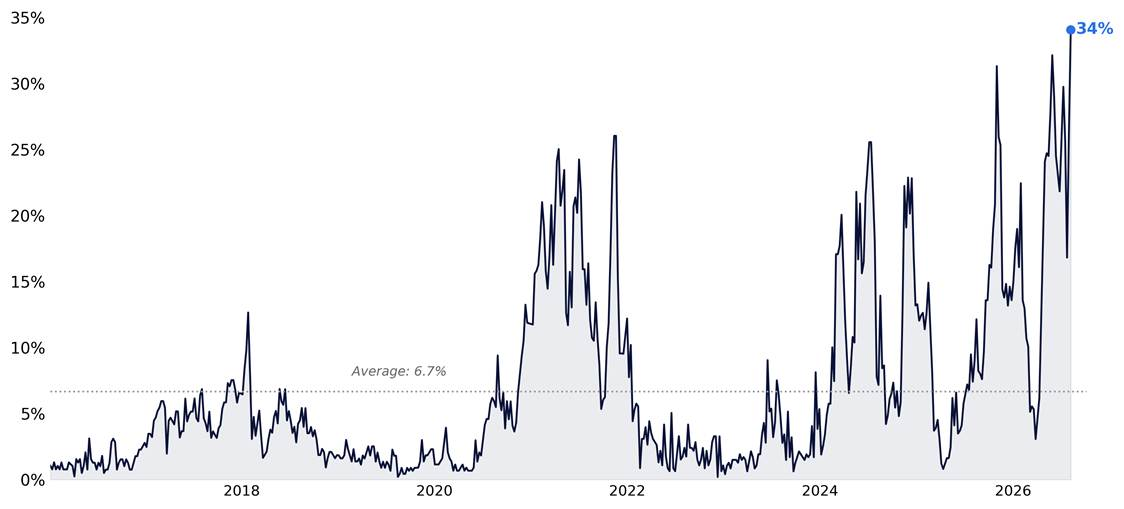
Investors are not simply paying less for downside protection. In parts of the market, they are willing to pay more for upside convexity. That behavioral shift matters. It is a very different psychology.
GMI Bottom Line
This remains a difficult market. The macro risks are real, and the path will not be linear.
But after working through the checklist, one thing stands out:
The balance of flows is shifting in a more constructive direction.
Earnings are supporting prices rather than multiples doing all the work. The leverage reset is increasingly mature. Retail is buying again. Passive demand never left. The corporate bid is returning. Breadth is improving. Volatility is falling. And demand for upside is accelerating.
Not every signal is bullish, and none of them determines the market on its own.
What matters is that more of them are now reinforcing one another.
Lower volatility creates capacity for systematic strategies to add exposure. Additional buying can strengthen trends. Stronger trends can draw investors back into the market. Broader participation can create another source of demand.
That is how a market that spent much of the year absorbing selling pressure can begin to rebuild buying capacity.
For August, that may be the underappreciated risk. The market does not need everyone to become bullish. It needs enough incremental buyers to keep showing up as prices move higher.
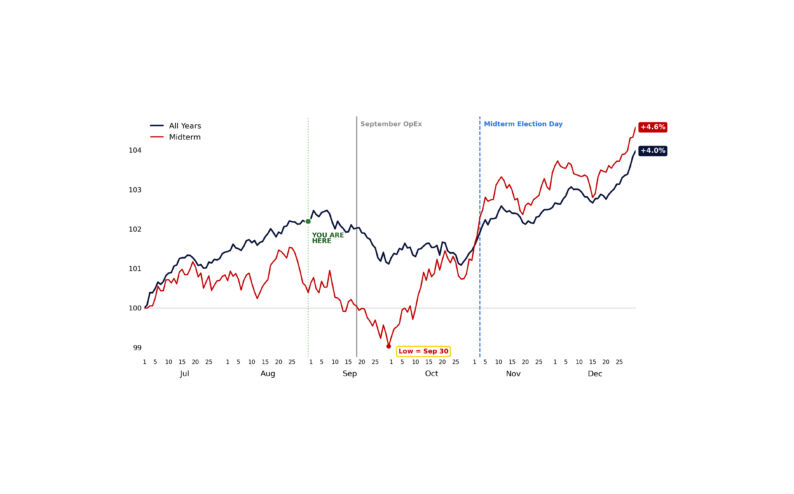
September may be a different conversation. Seasonality gets harder, positioning may be fuller, and if August turns into a chase, some of today’s buying capacity will already have been deployed.
August may be about buyers coming back. September may be about how much buying power is left. For now, the buyer checklist keeps getting longer.
Copyright © Citadel Enterprise Americas LLC or one of its affiliates. All rights reserved.
Legal Entities Disseminating this Material: This material is disseminated in the United Kingdom by Citadel Securities (Europe) Limited (“CDGE”) authorized and regulated by the Financial Conduct Authority (“FCA”) (Registered company number: 05462867); in the European Union by Citadel Securities GCS (Ireland) Limited (“CSGI”) and its Paris Branch authorized and regulated by the Central Bank of Ireland (“CBI”) (Registration Number: C173437); in Hong Kong by Citadel Securities (Hong Kong) Limited (“CDHK”) licensed by the Securities and Futures Commission of Hong Kong (“SFC”), in Japan by Citadel Securities Japan Co., Ltd (“CSJC”) registered as a Type 1 financial instruments business operator with the Japan Financial Services Agency (“JFSA”); and in the United States of America by Citadel Securities LLC (“CDRG”) registered with the Securities Exchange Commission (“SEC”), Financial Industry Regulatory Authority (“FINRA”), and Securities Investor Protection Corporation (“SIPC”), Citadel Securities Institutional LLC (“CSIN”) registered with the SEC, FINRA, and SIPC, or Citadel Securities Swap Dealer LLC (“CSSD”) registered with the SEC, Commodities Futures Trading Commission (“CFTC”), and National Futures Association (“NFA”). Unless governing law permits otherwise, you must contact a Citadel Securities entity in your home jurisdiction if you want to use our services in effecting a transaction in any financial instruments or securities, including derivatives.
FOR INSTITUTIONAL USE ONLY; FOR PROFESSIONAL CLIENTS AND ELIGIBLE COUNTERPARTIES ONLY. This material is not intended as and does not constitute investment research. Contents of this material will be strictly limited to non-specific, generic information (i.e. macro events/topics) and are not subject to the Markets in Financial Instruments directive (MiFID II) or FINRA research rules. This material does not constitute an offer, solicitation, invitation, or inducement to purchase, acquire, subscribe to, provide, or sell any financial instrument or otherwise engage in investment activity. Please see additional important disclosures, including disclosures that may be relevant to your country of residence or business at www.citadelsecurities.com/GlobalSalesTrading.