We remain constructive on US equities. But the setup that carried the market through August is changing, and the near-term asymmetry has shifted.
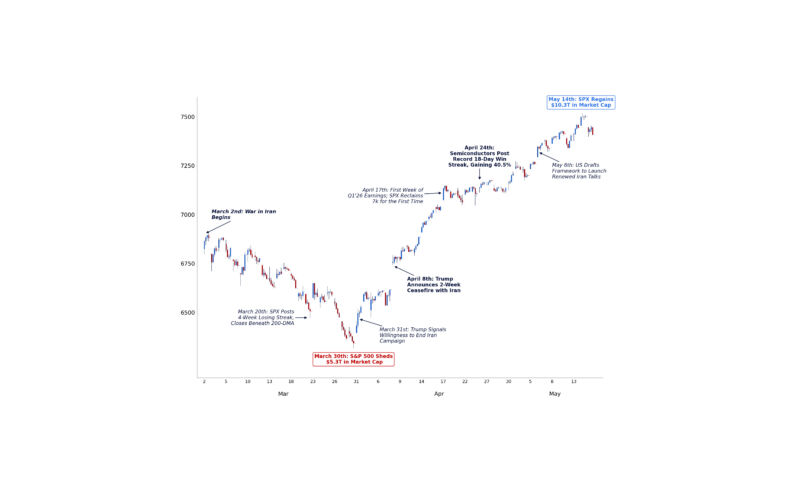
I have remained constructive through the summer, and much of that view has played out. Earnings were exceptional. The July reset cleaned up leverage and positioning. Retail returned. Volatility collapsed. Systematic investors rebuilt exposure, and equities recovered. Since the March 30 low, the S&P 500 has rallied approximately 22%, adding roughly $12 trillion in market capitalization in just five months.
September presents a different setup.
The earnings tailwind is largely behind us just as the calendar turns decisively back toward macro. Retail and corporate demand remain supportive, but both historically fade through September. Much of the systematic capacity created by the July reset has already been redeployed. Volatility has compressed substantially. Downside protection is inexpensive. And we are entering the weakest seasonal window of the year.
This is not a change in our longer-term constructive equity view. It is a change in the near-term risk/reward.
The question I keep coming back to is simple: what is the next catalyst that pushes equities meaningfully higher from here? A few weeks ago, the answer was easier.
For the first time since the July reset, I would rather use strength to reduce some exposure and add inexpensive protection than chase the market higher into this event window. I view September as a tactical downside window, not the beginning of a broader bearish turn.

1. The Tailwinds Are Fading
A. Earnings Are Now in the Rearview
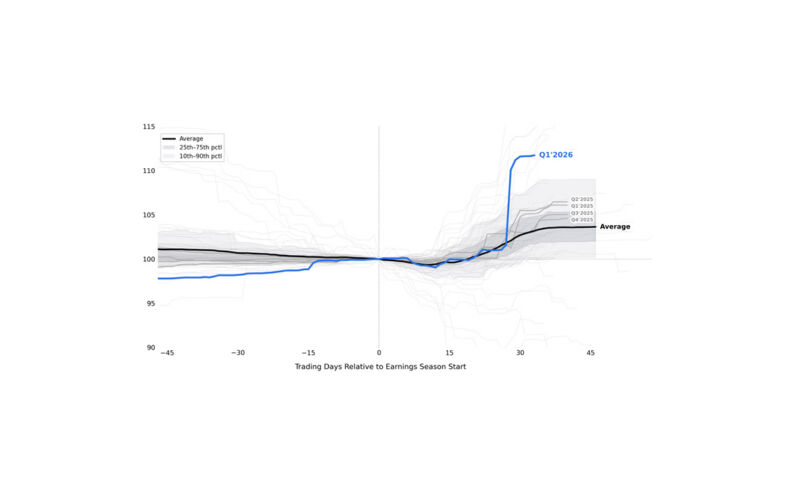
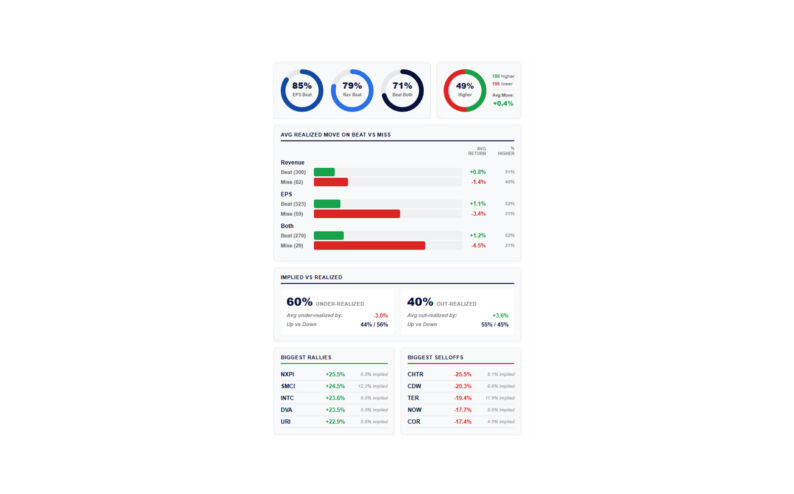
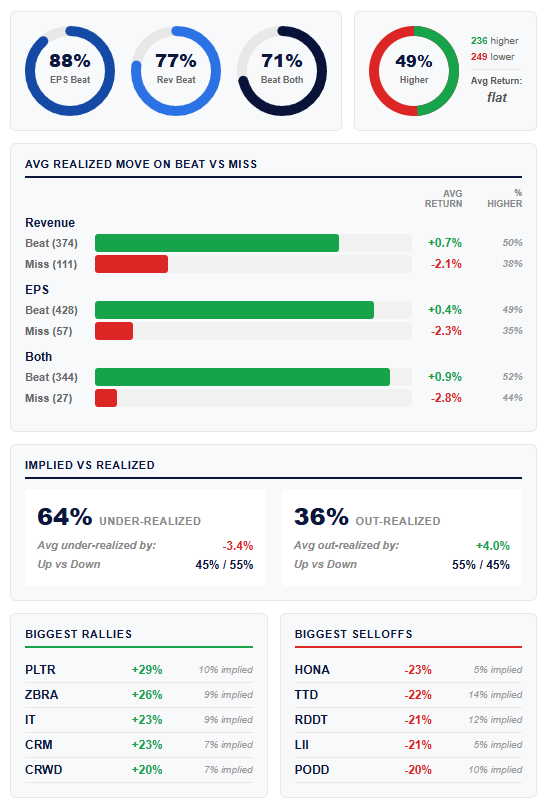
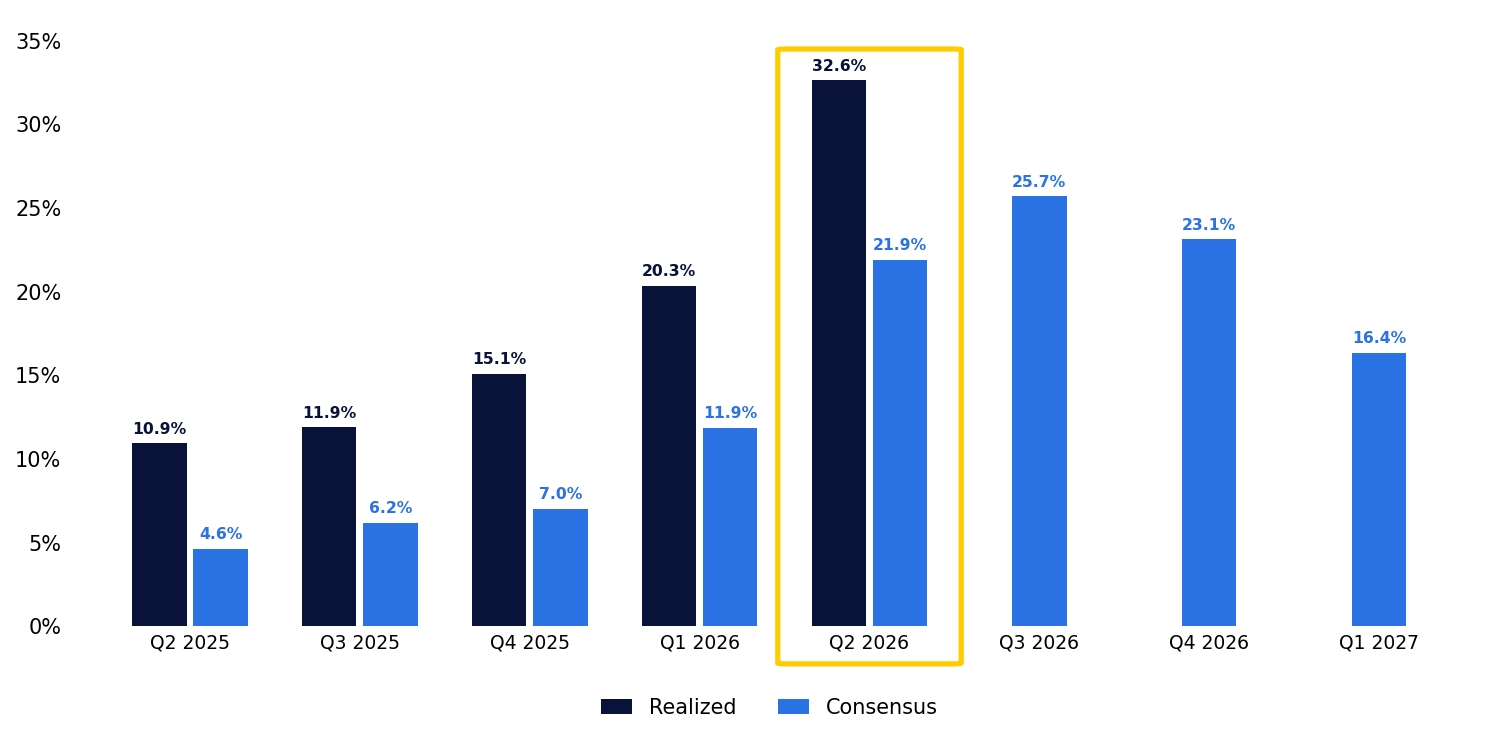
Earnings were better than expected, and by a wide margin. With 93% of the S&P 500 by weight having reported, 88% have beaten EPS estimates by a median of 7%, while the 12% that missed have done so by a median of just 3%. Q2 S&P 500 EPS growth tracked around 33%, the strongest pace outside of post-recession recoveries, while estimates followed the steepest upward revision path we have seen since at least 2000.
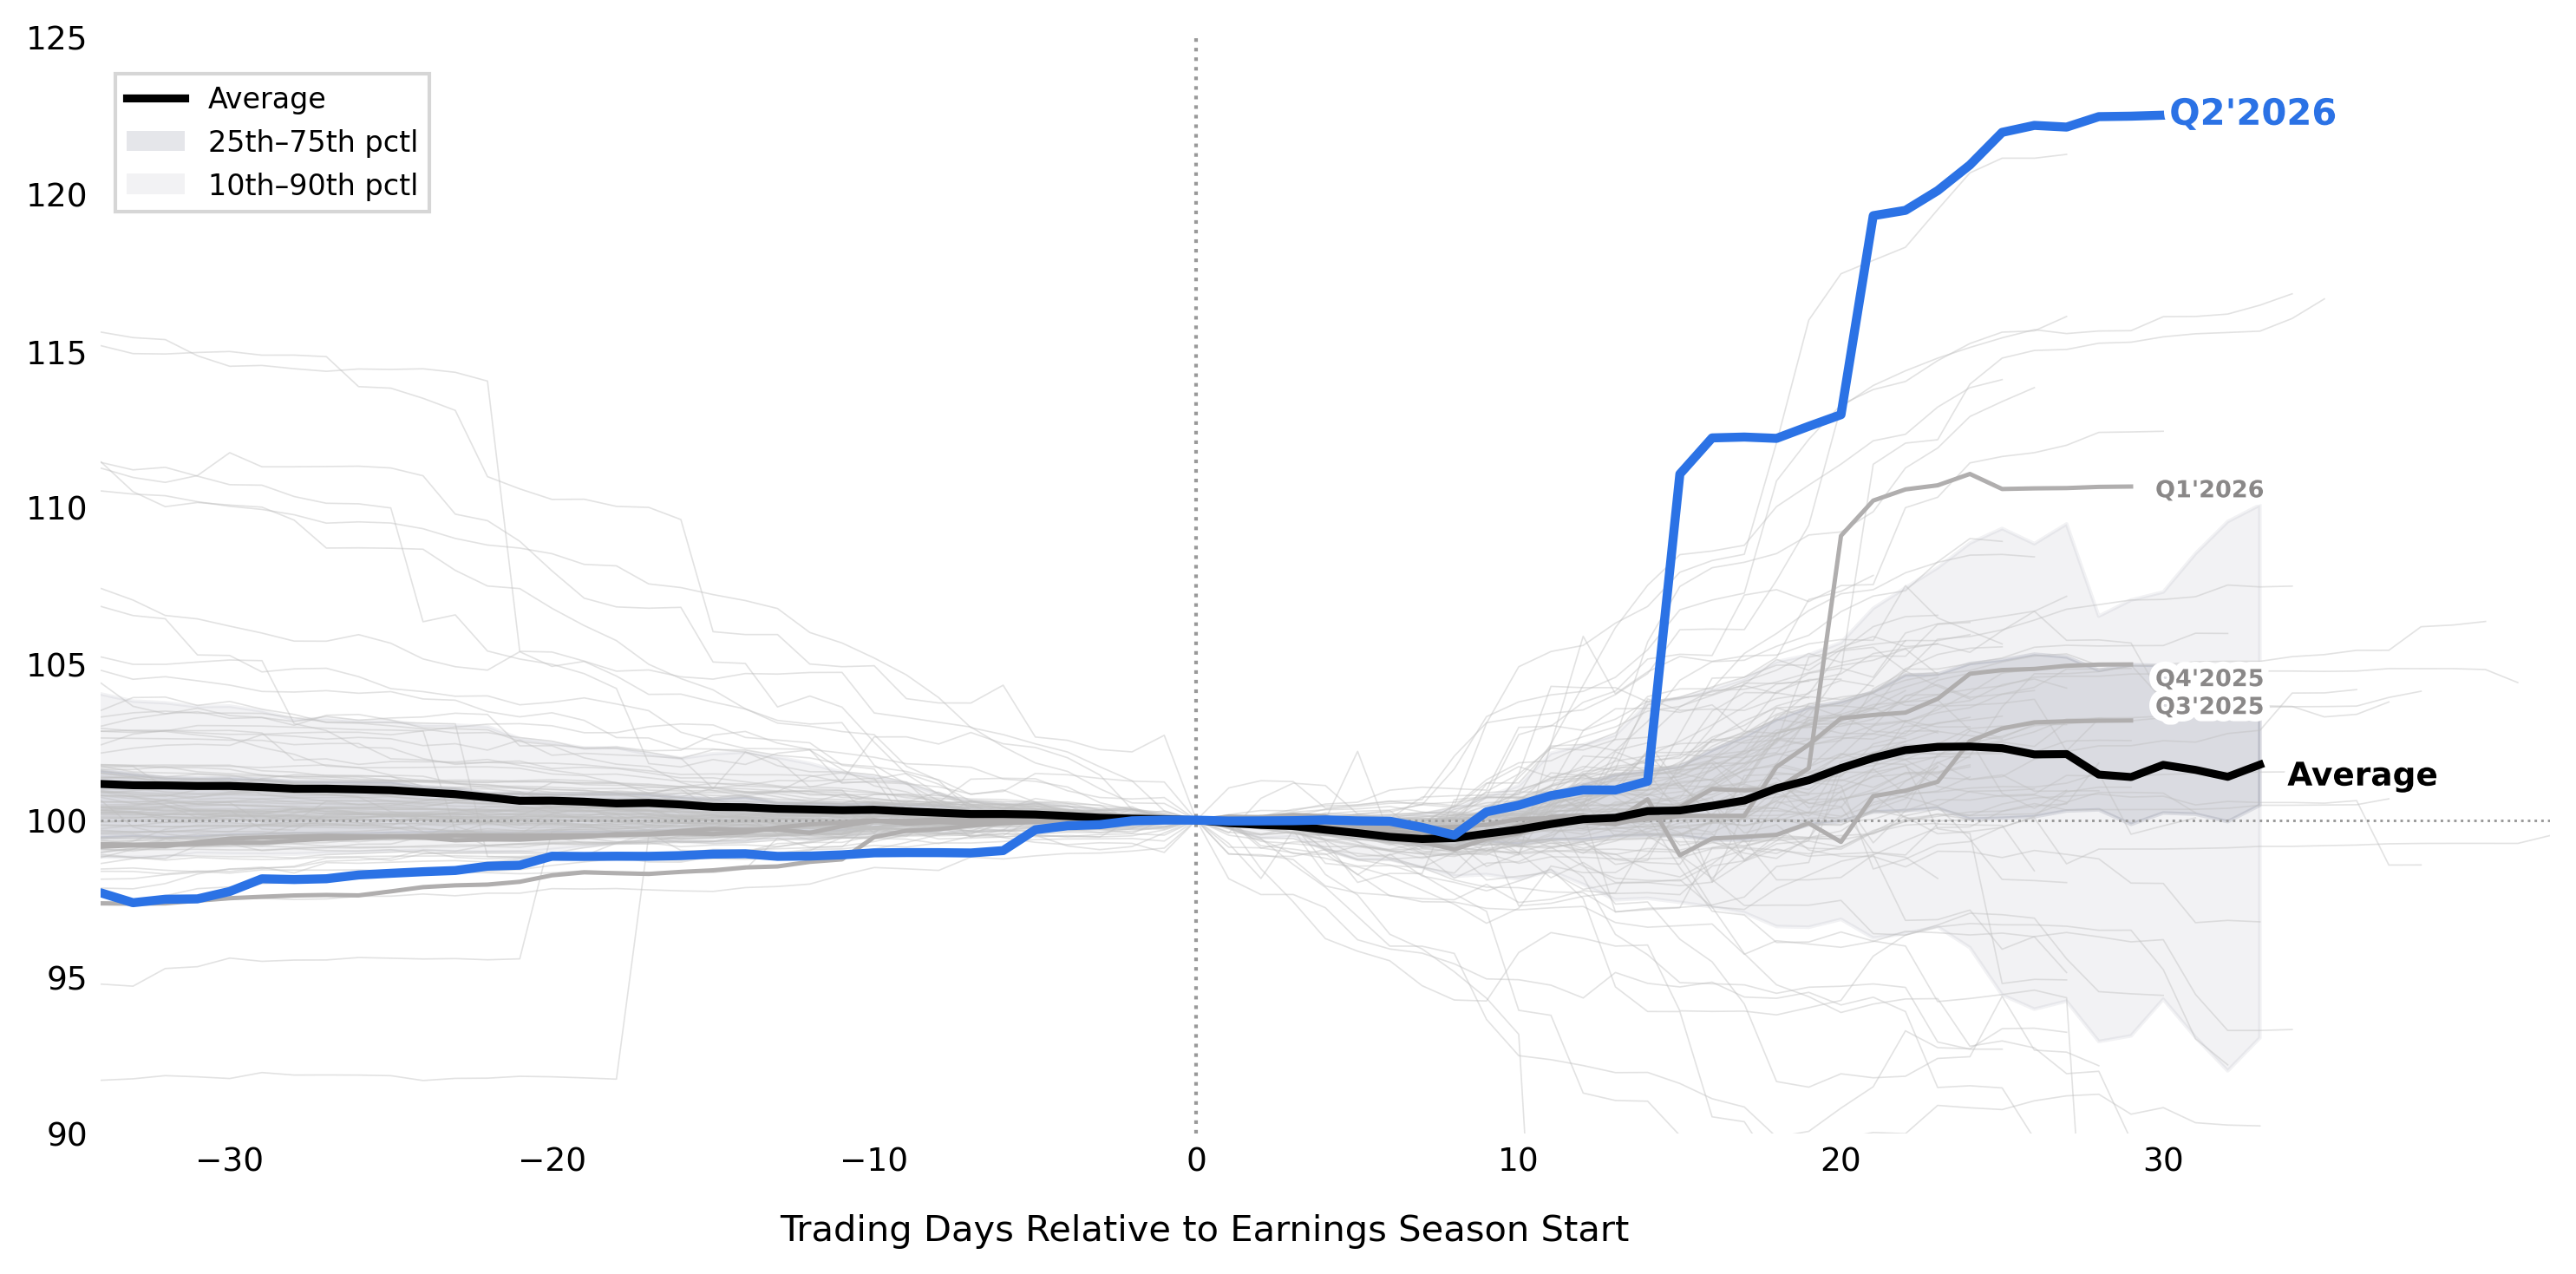
With NVDA now behind us, the largest earnings catalysts are largely in the rearview. The corporate calendar gets much lighter from here, removing one of the clearest sources of positive surprises through the summer. Historically, US equities have rallied through the first month of earnings season, with momentum fading as the reporting calendar enters a lull.
B. Retail Typically Slows in September
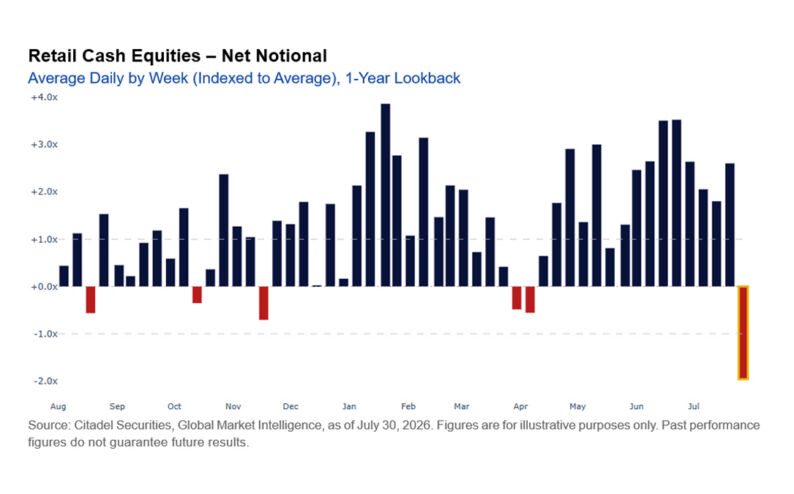
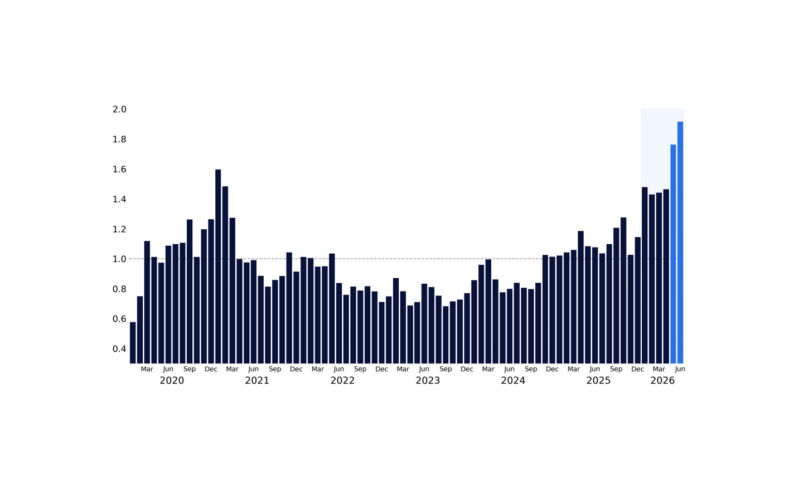
Retail returned as a buyer through August after turning better for sale during the late-July selloff. Average daily net notional this month is tracking around the 65th percentile versus the past year, roughly 10% above average, even as overall participation has continued to seasonally slow. Average daily gross notional is tracking in only the 35th percentile, roughly 4% below average.
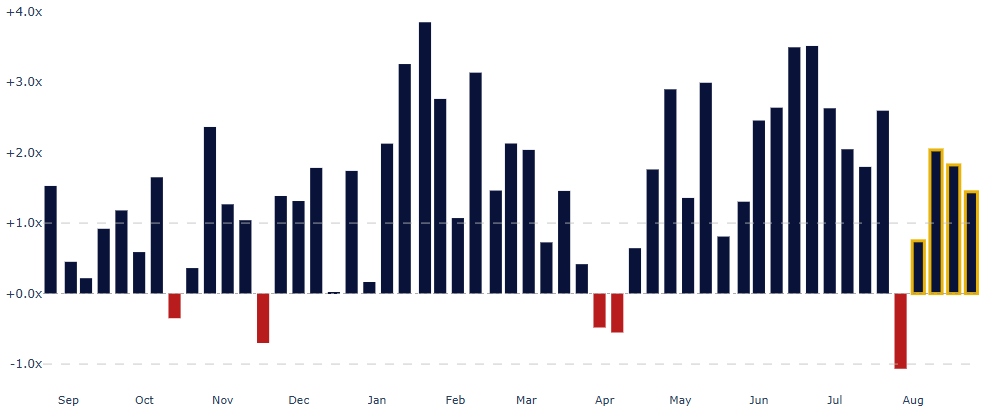
The distinction between direction and participation matters. Retail remains a source of positive demand, but that demand is arriving on lighter overall activity.
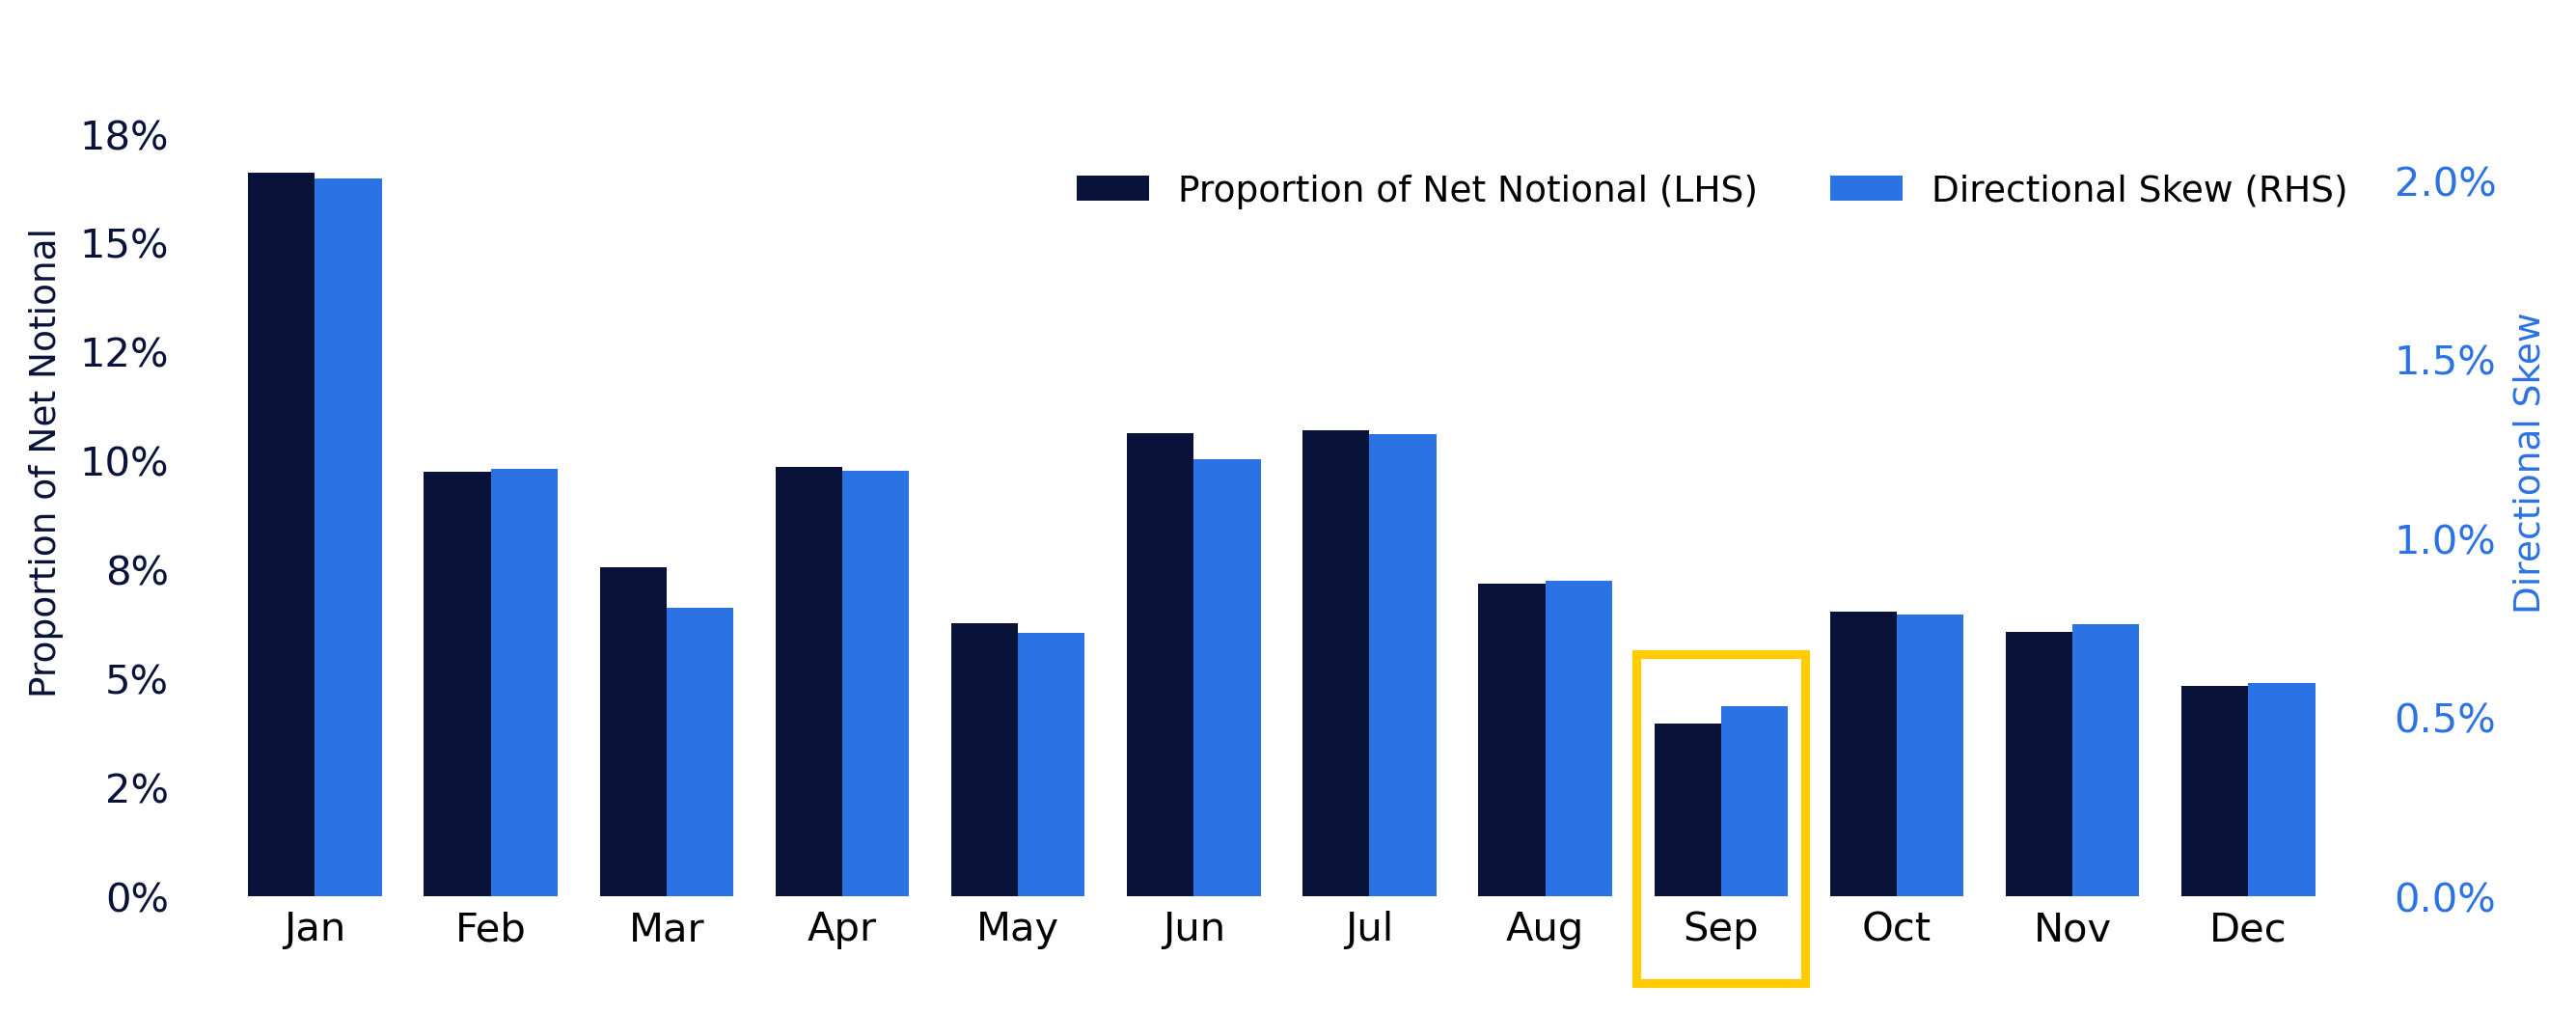
September has historically been the weakest month of the year for retail demand on our platform, recording both the lowest proportion of annual retail net notional and the lowest directional skew of any month.
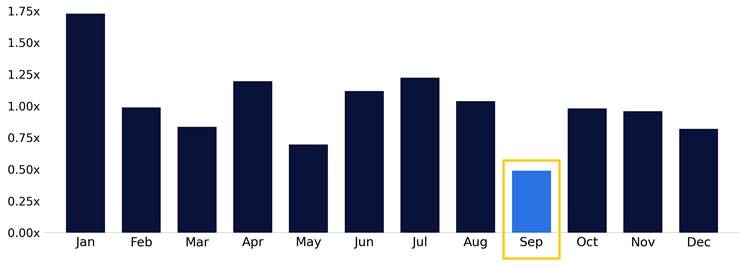
The seasonal slowdown also extends to buying the dip. Since 2019, average retail net buying on S&P 500 down days in September has been roughly half the all-month average, the lowest level of any month.
C. The Corporate Bid Also Begins to Slow
Corporate demand provided another important source of support through August, with more than $1.1 trillion of announced buyback authorizations moving back into an open window. Importantly, 67% of the largest authorized buybacks YTD are outside of Technology.
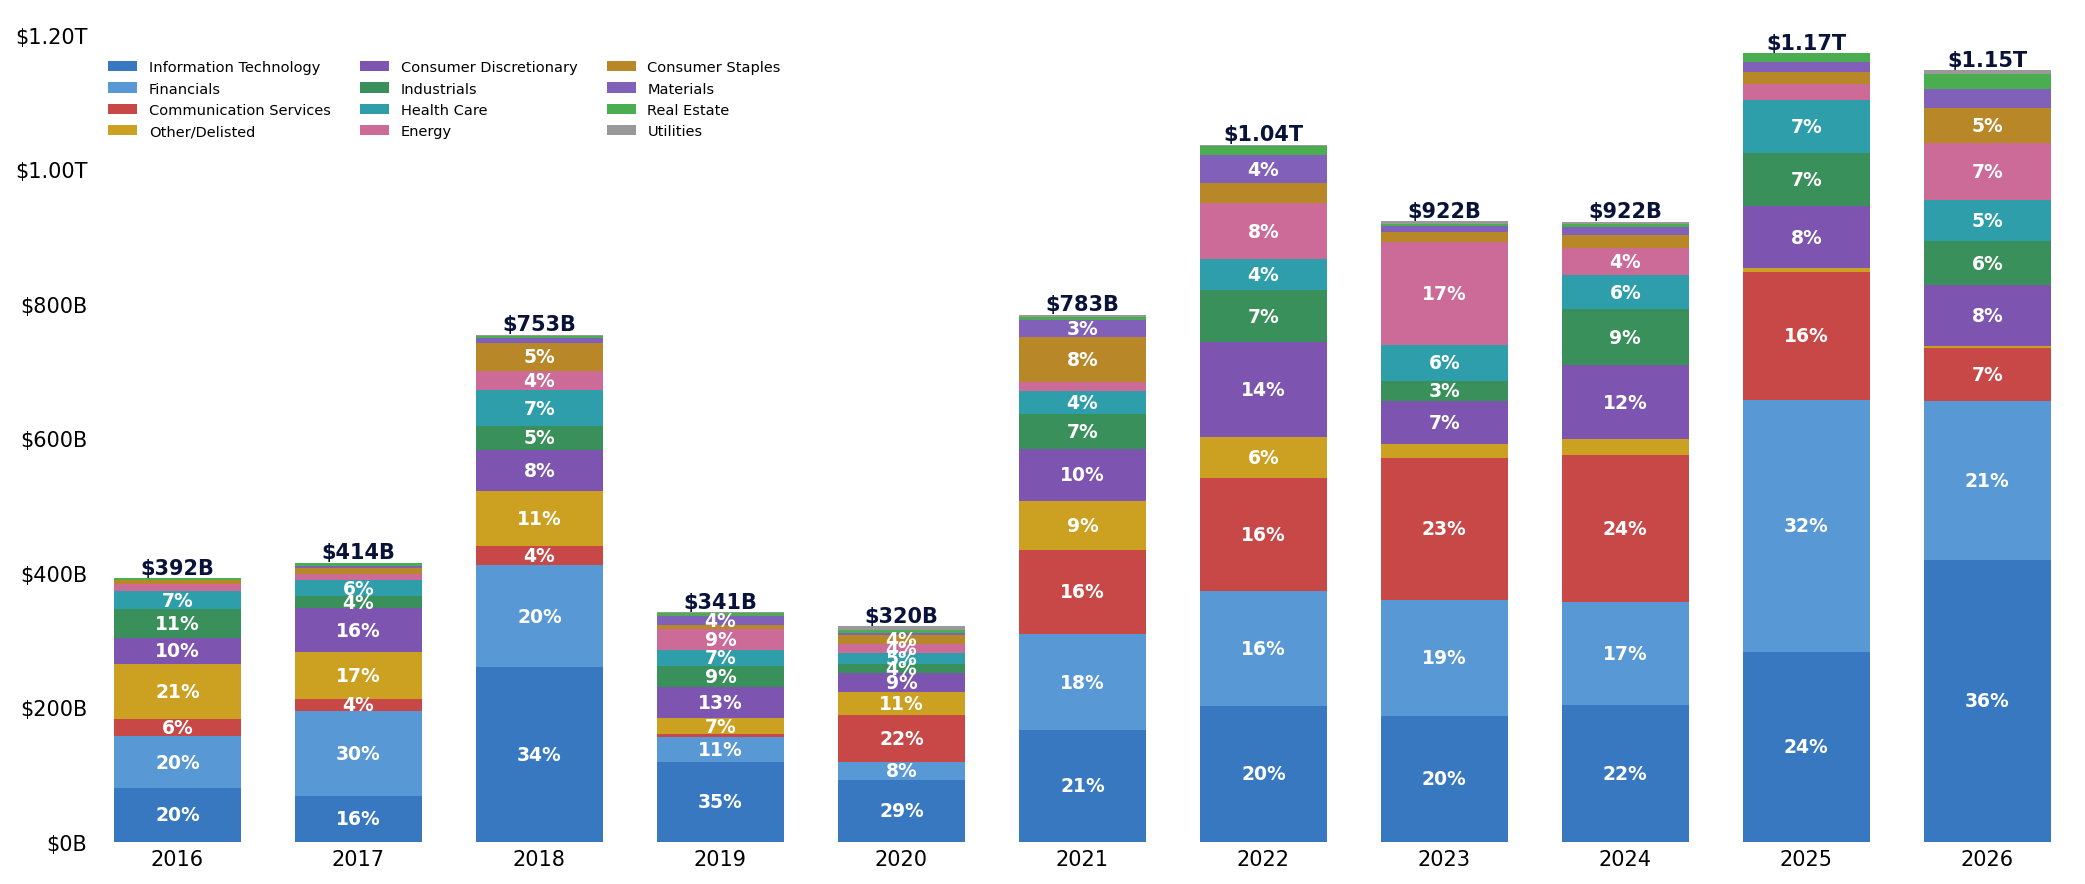
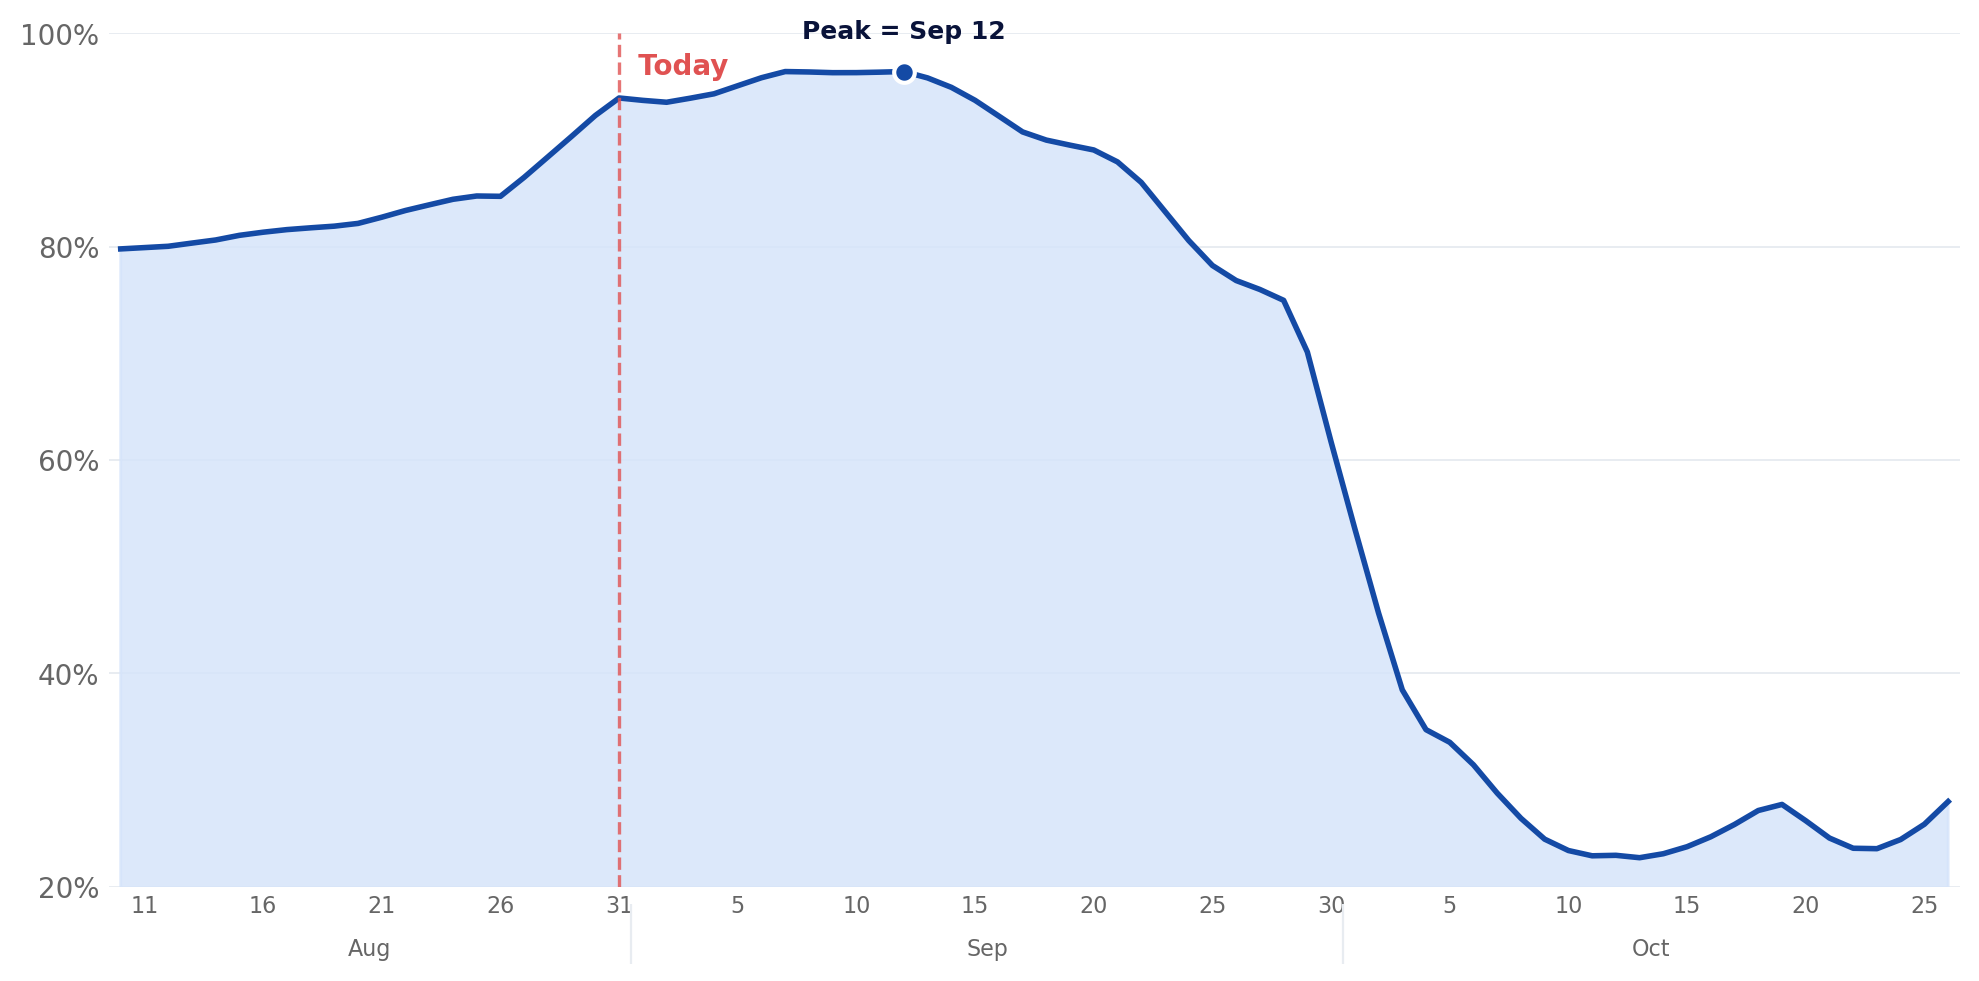
That support begins to fade through September as an increasing share of companies enter pre-earnings blackout periods ahead of Q3 reporting. The blackout window begins to accelerate around September 12.
One of the market’s largest and most consistent sources of structural demand therefore becomes progressively smaller as the month advances.
2. Protection Is Cheap
A. Index Downside Protection Is Inexpensive
The market is pricing relatively little demand for downside protection, particularly compared with demand for upside. S&P 500 skew is trading near its flattest level of the past year, ranking in the first percentile over that period.
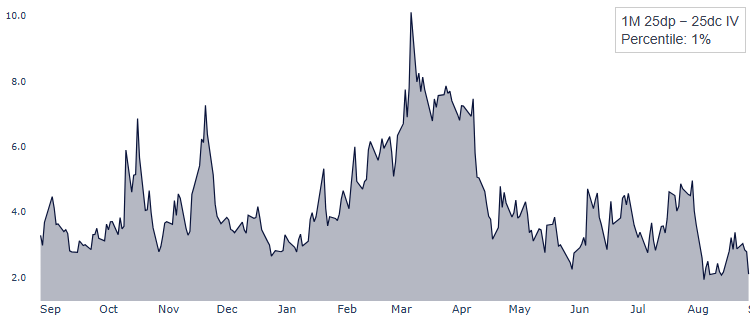
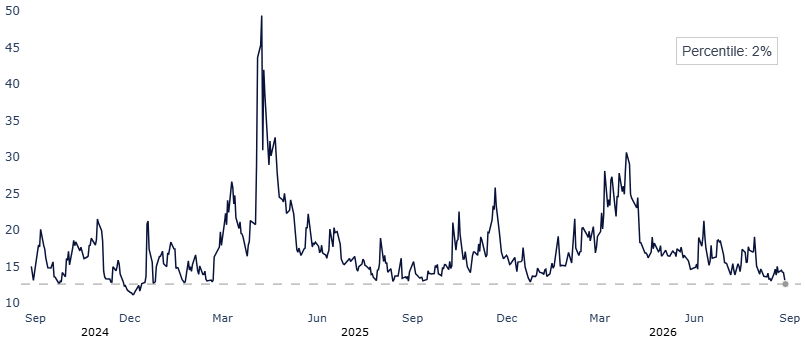
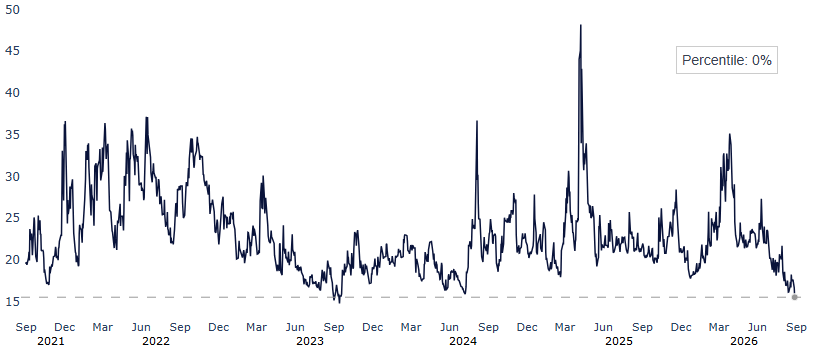
On Friday, 1-month 25-delta downside protection in SPX fell to its cheapest level since December 2024, while the VIX closed at 14.4, its second-lowest closing level since December 2025.
Implied volatility is particularly inexpensive in more rate-sensitive areas of the market, including Small Caps, Financials, Regional Banks and Consumer/Retail.
B. Single-Stock Volatility Has Collapsed
That is the disconnect. Investors are entering a much more macro event-heavy period while paying relatively little premium for protection.
The July reset removed a significant amount of leverage from the market. Leveraged ETF AUM fell by nearly $70 billion, or 31%, from its June peak, including declines of 38% across Technology and 50% across Semiconductors.
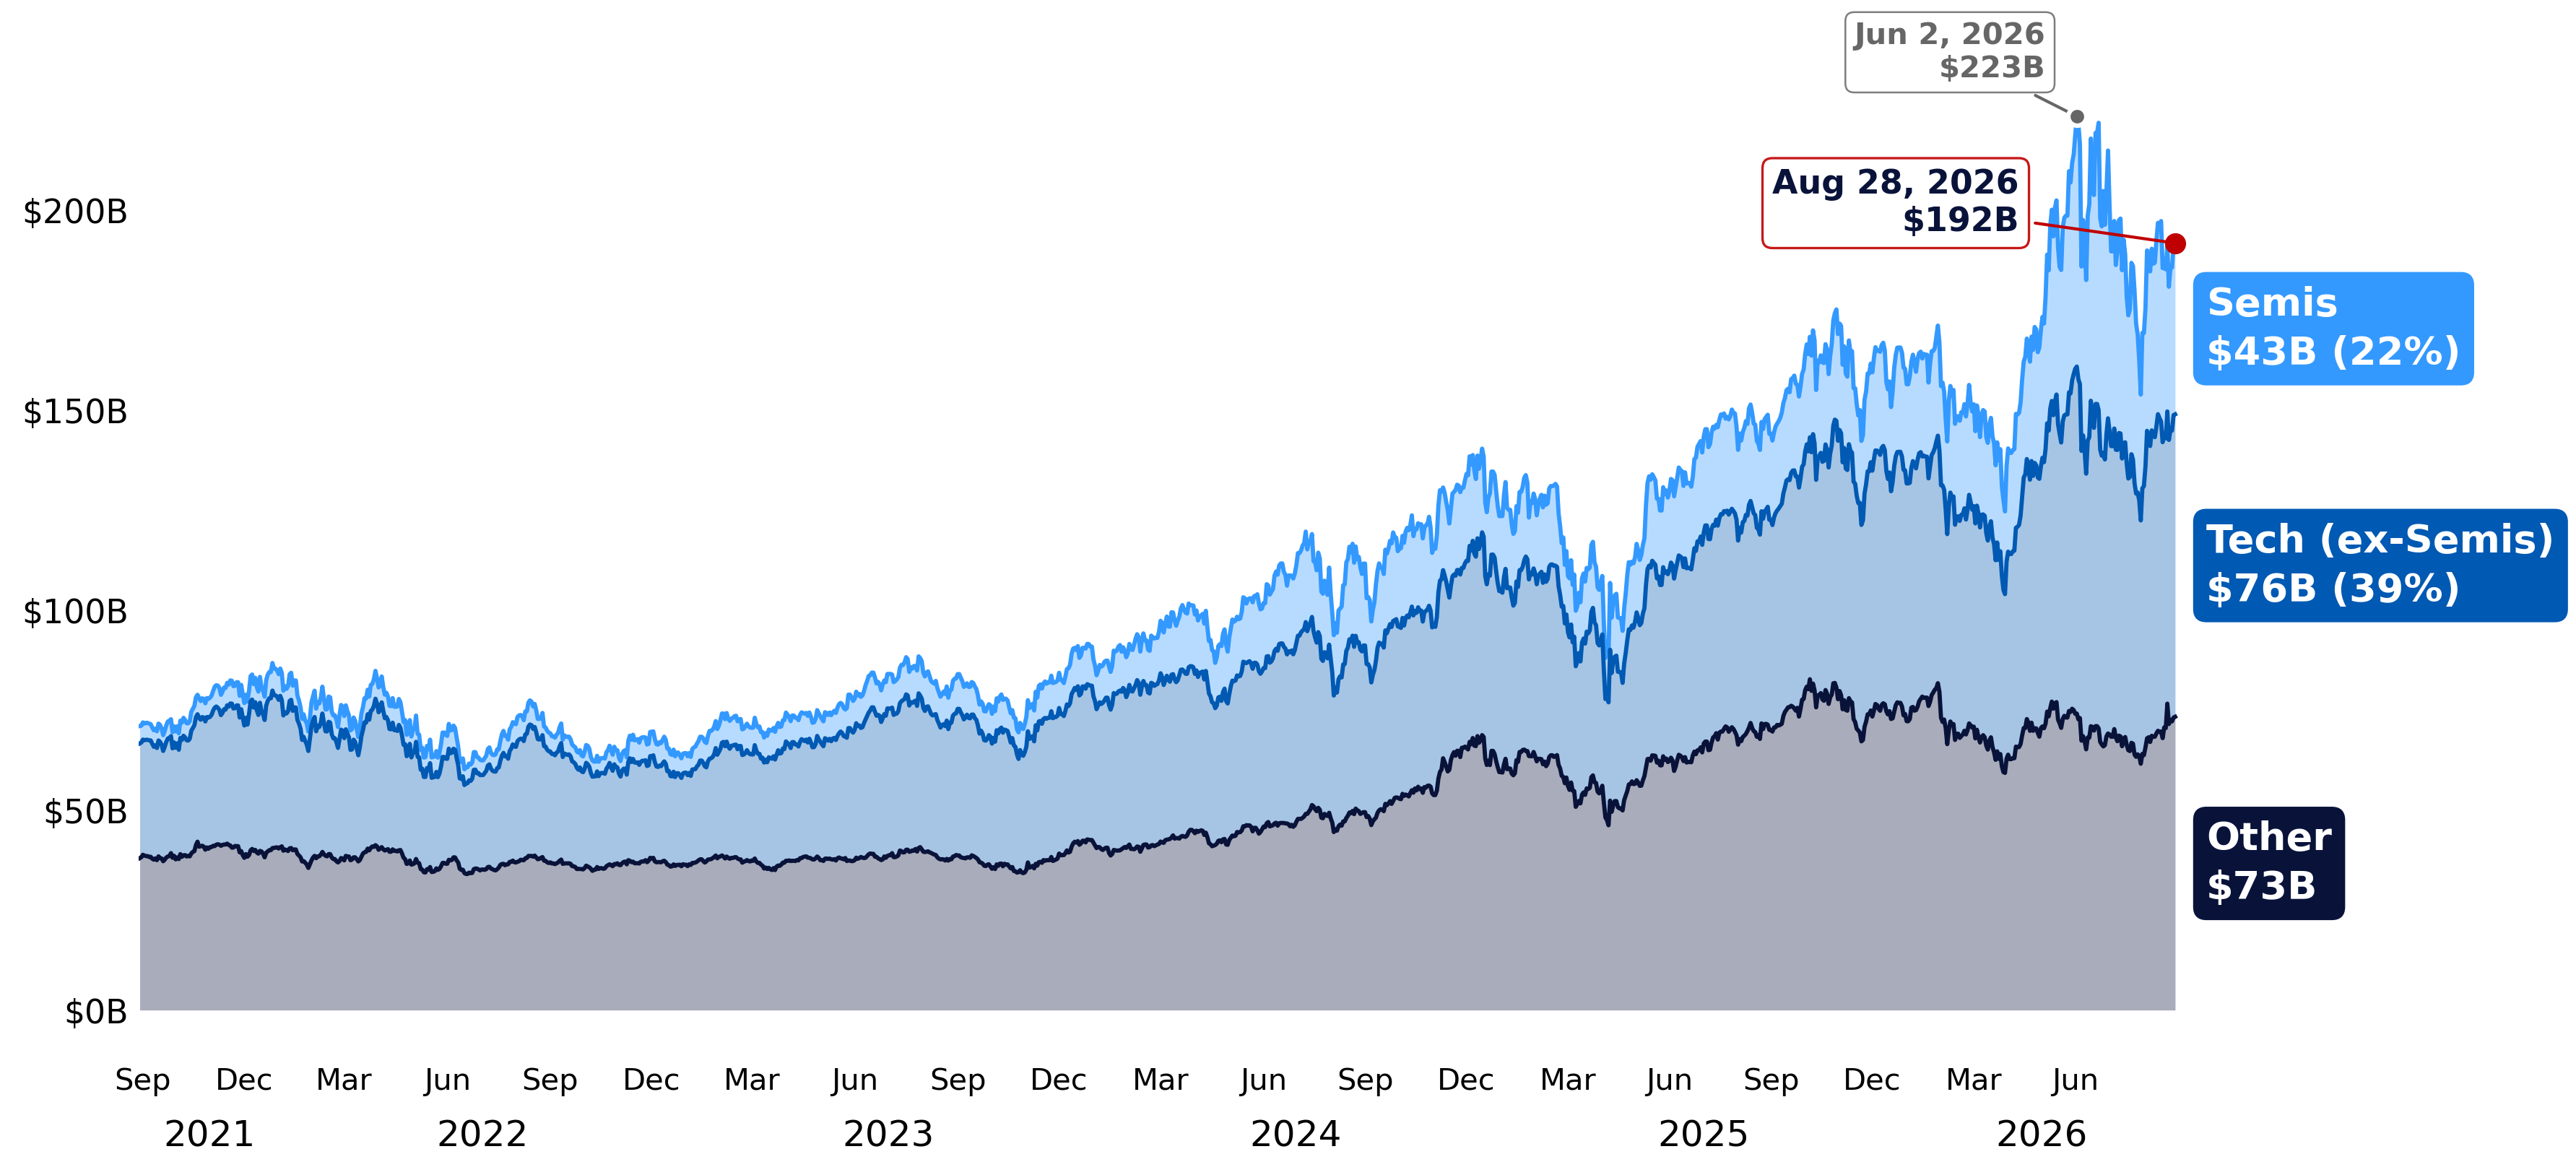
As leverage came out, so did much of the incremental demand for single-stock optionality, accelerating the collapse in implied volatility.
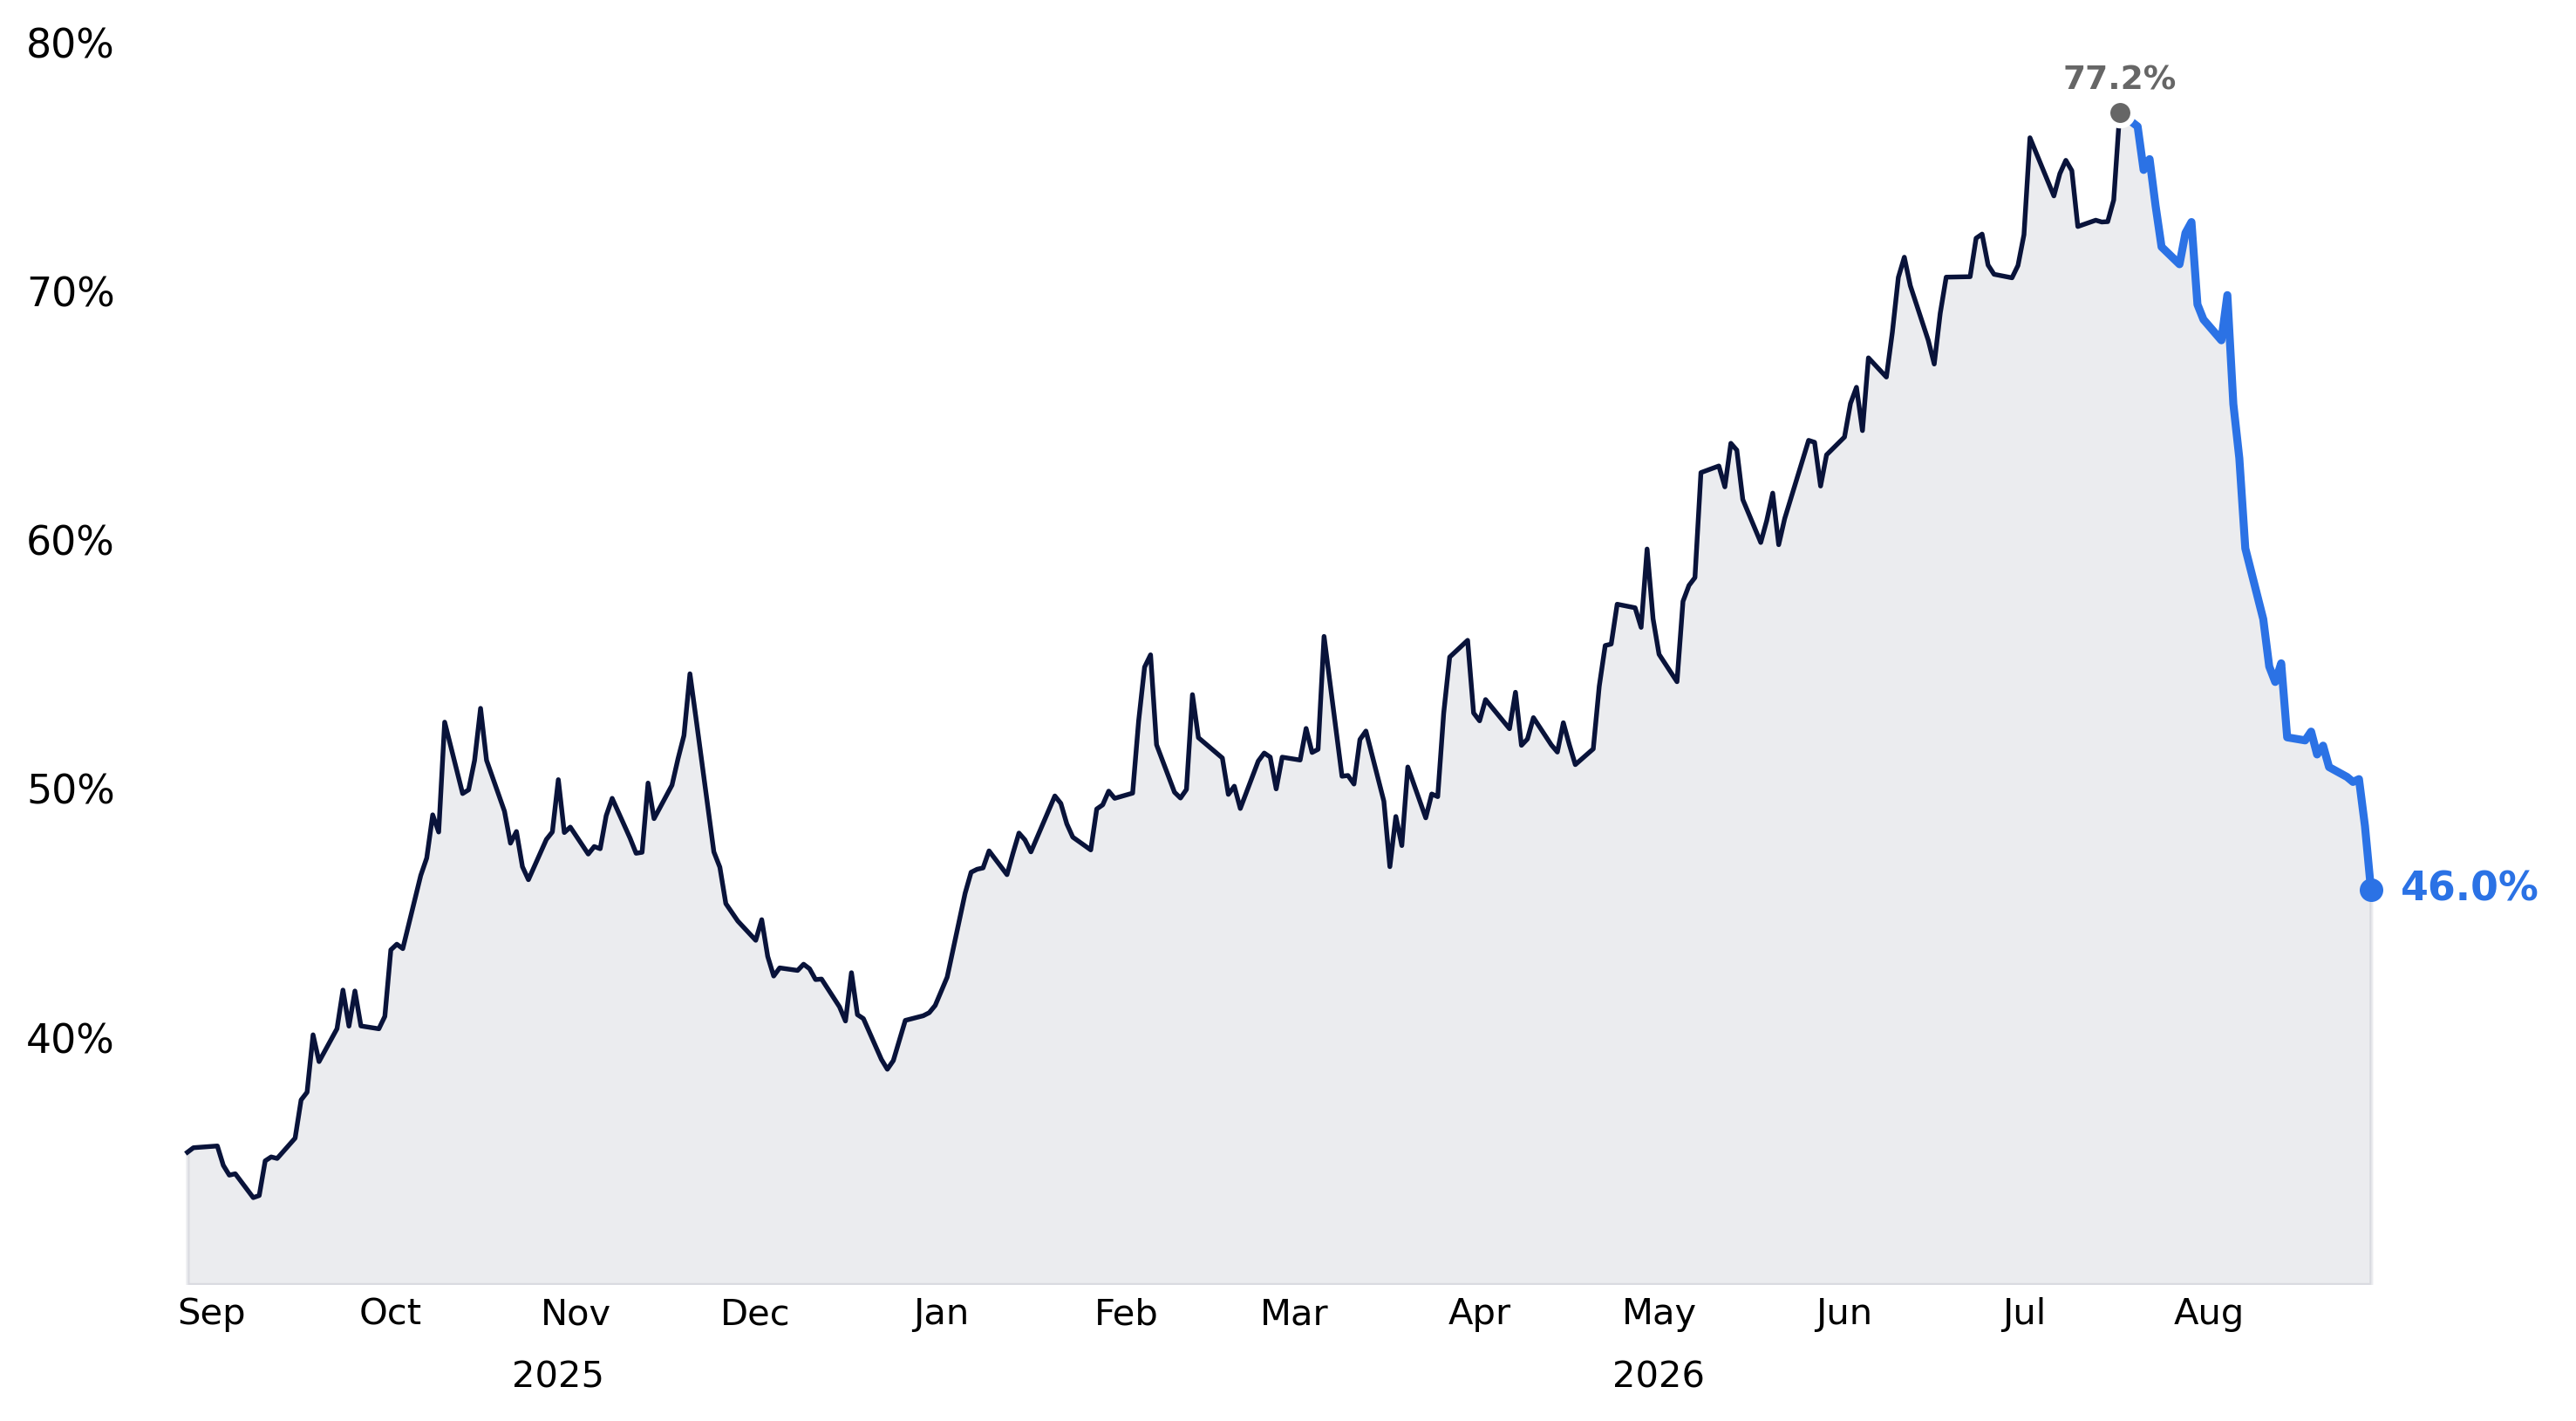
From the end of March through July expiry, average 1-month ATM implied volatility across the 15 largest SOX constituents climbed from 53.0 to 77.2 over 74 trading sessions.
It took just 20 sessions to give the entire move back.
Thirty sessions after the peak, implied volatility sits at 46.0, down 31.2 vol points, or 40%, and already below where the run-up began.
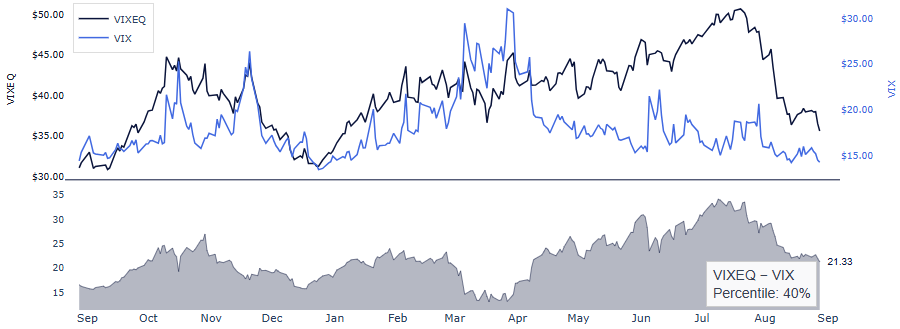
The spread between VIXEQ and VIX has normalized sharply after reaching record highs, while VVIX is now sitting near multi-year lows. Across both single-stock and index volatility, much of the July dislocation has been unwound.
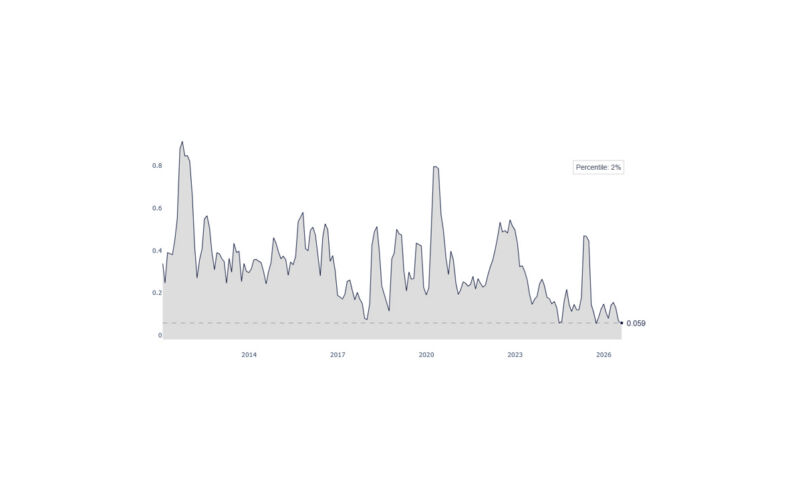
Vol of Vol (VVIX) ranks in the first percentile since the start of 2025.
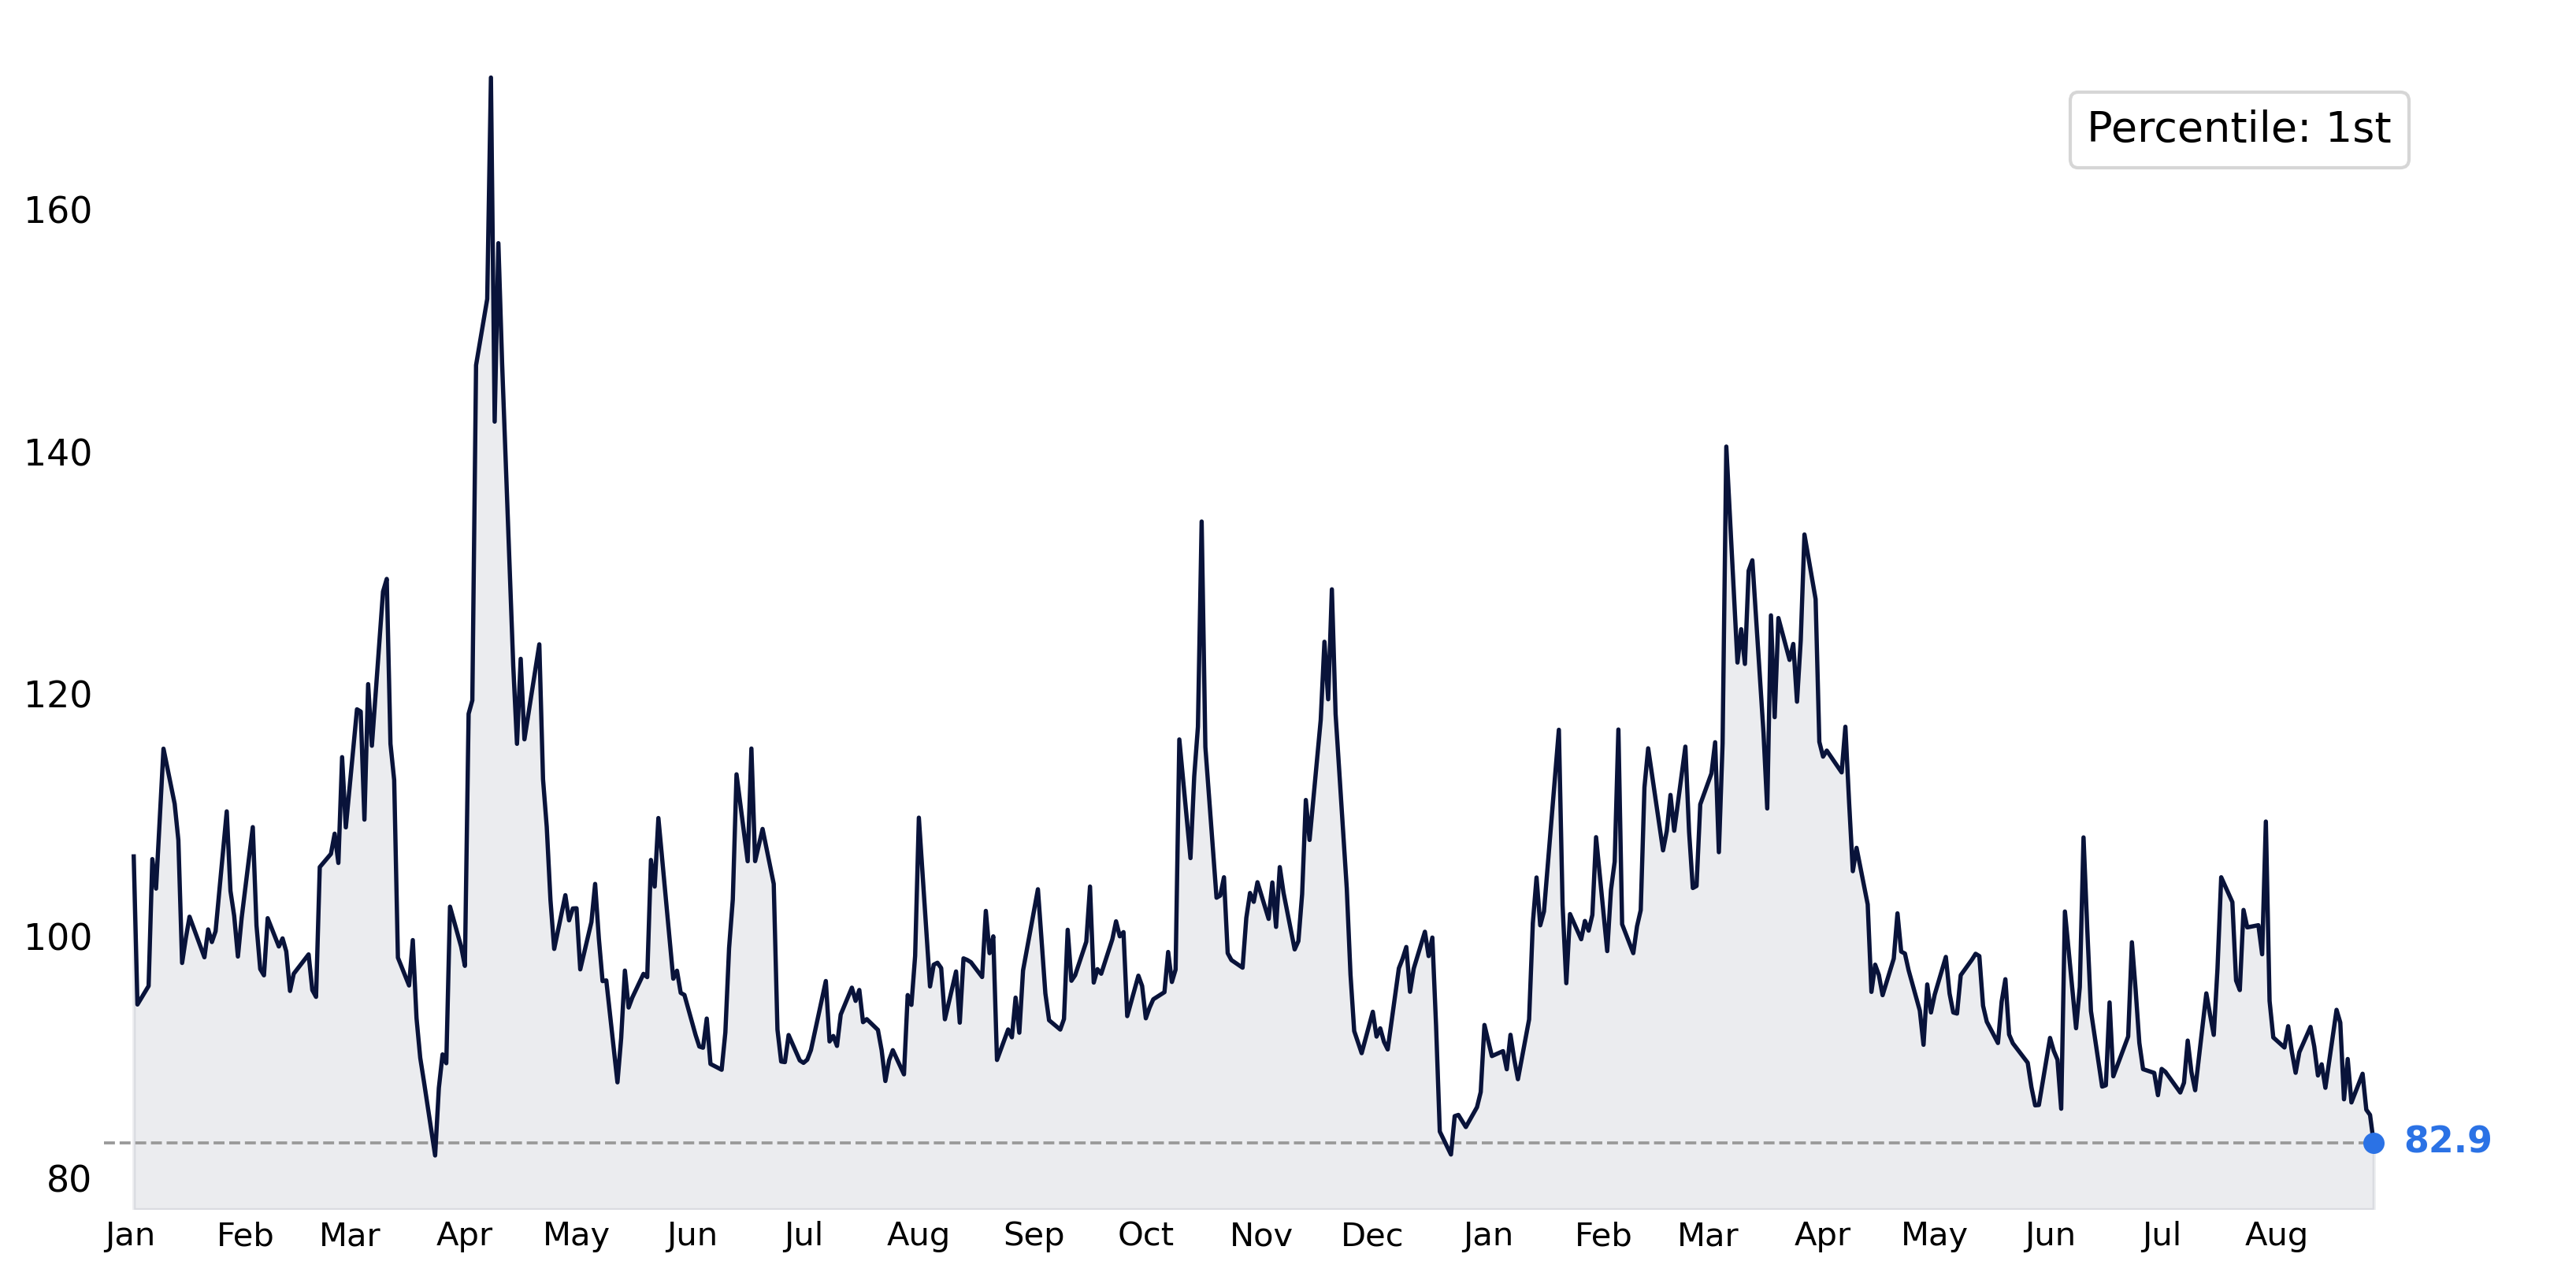
The asymmetry has changed. We are not looking for a return to July conditions, but there is much less volatility left to compress from here. With earnings behind us and the catalyst calendar turning back toward macro, there is more room for volatility to reprice higher than for another volatility collapse to provide the same tailwind to equities.
3. Exposure Has Rebuilt, and Equities Have Competition
A. Some of the July Capacity Has Already Been Redeployed
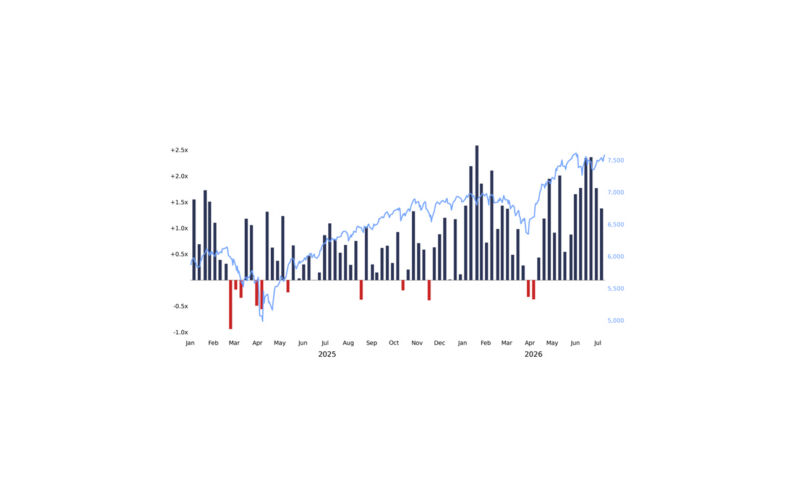
After a month of steady non-fundamental supply, systematic strategies have started to re-add exposure as realized volatility declined. CTA, Vol-Control and Risk-Parity strategies have all rebuilt exposure from the July lows, with the largest increases concentrated in the S&P 500 and Russell 2000, while Nasdaq exposure remains roughly flat.
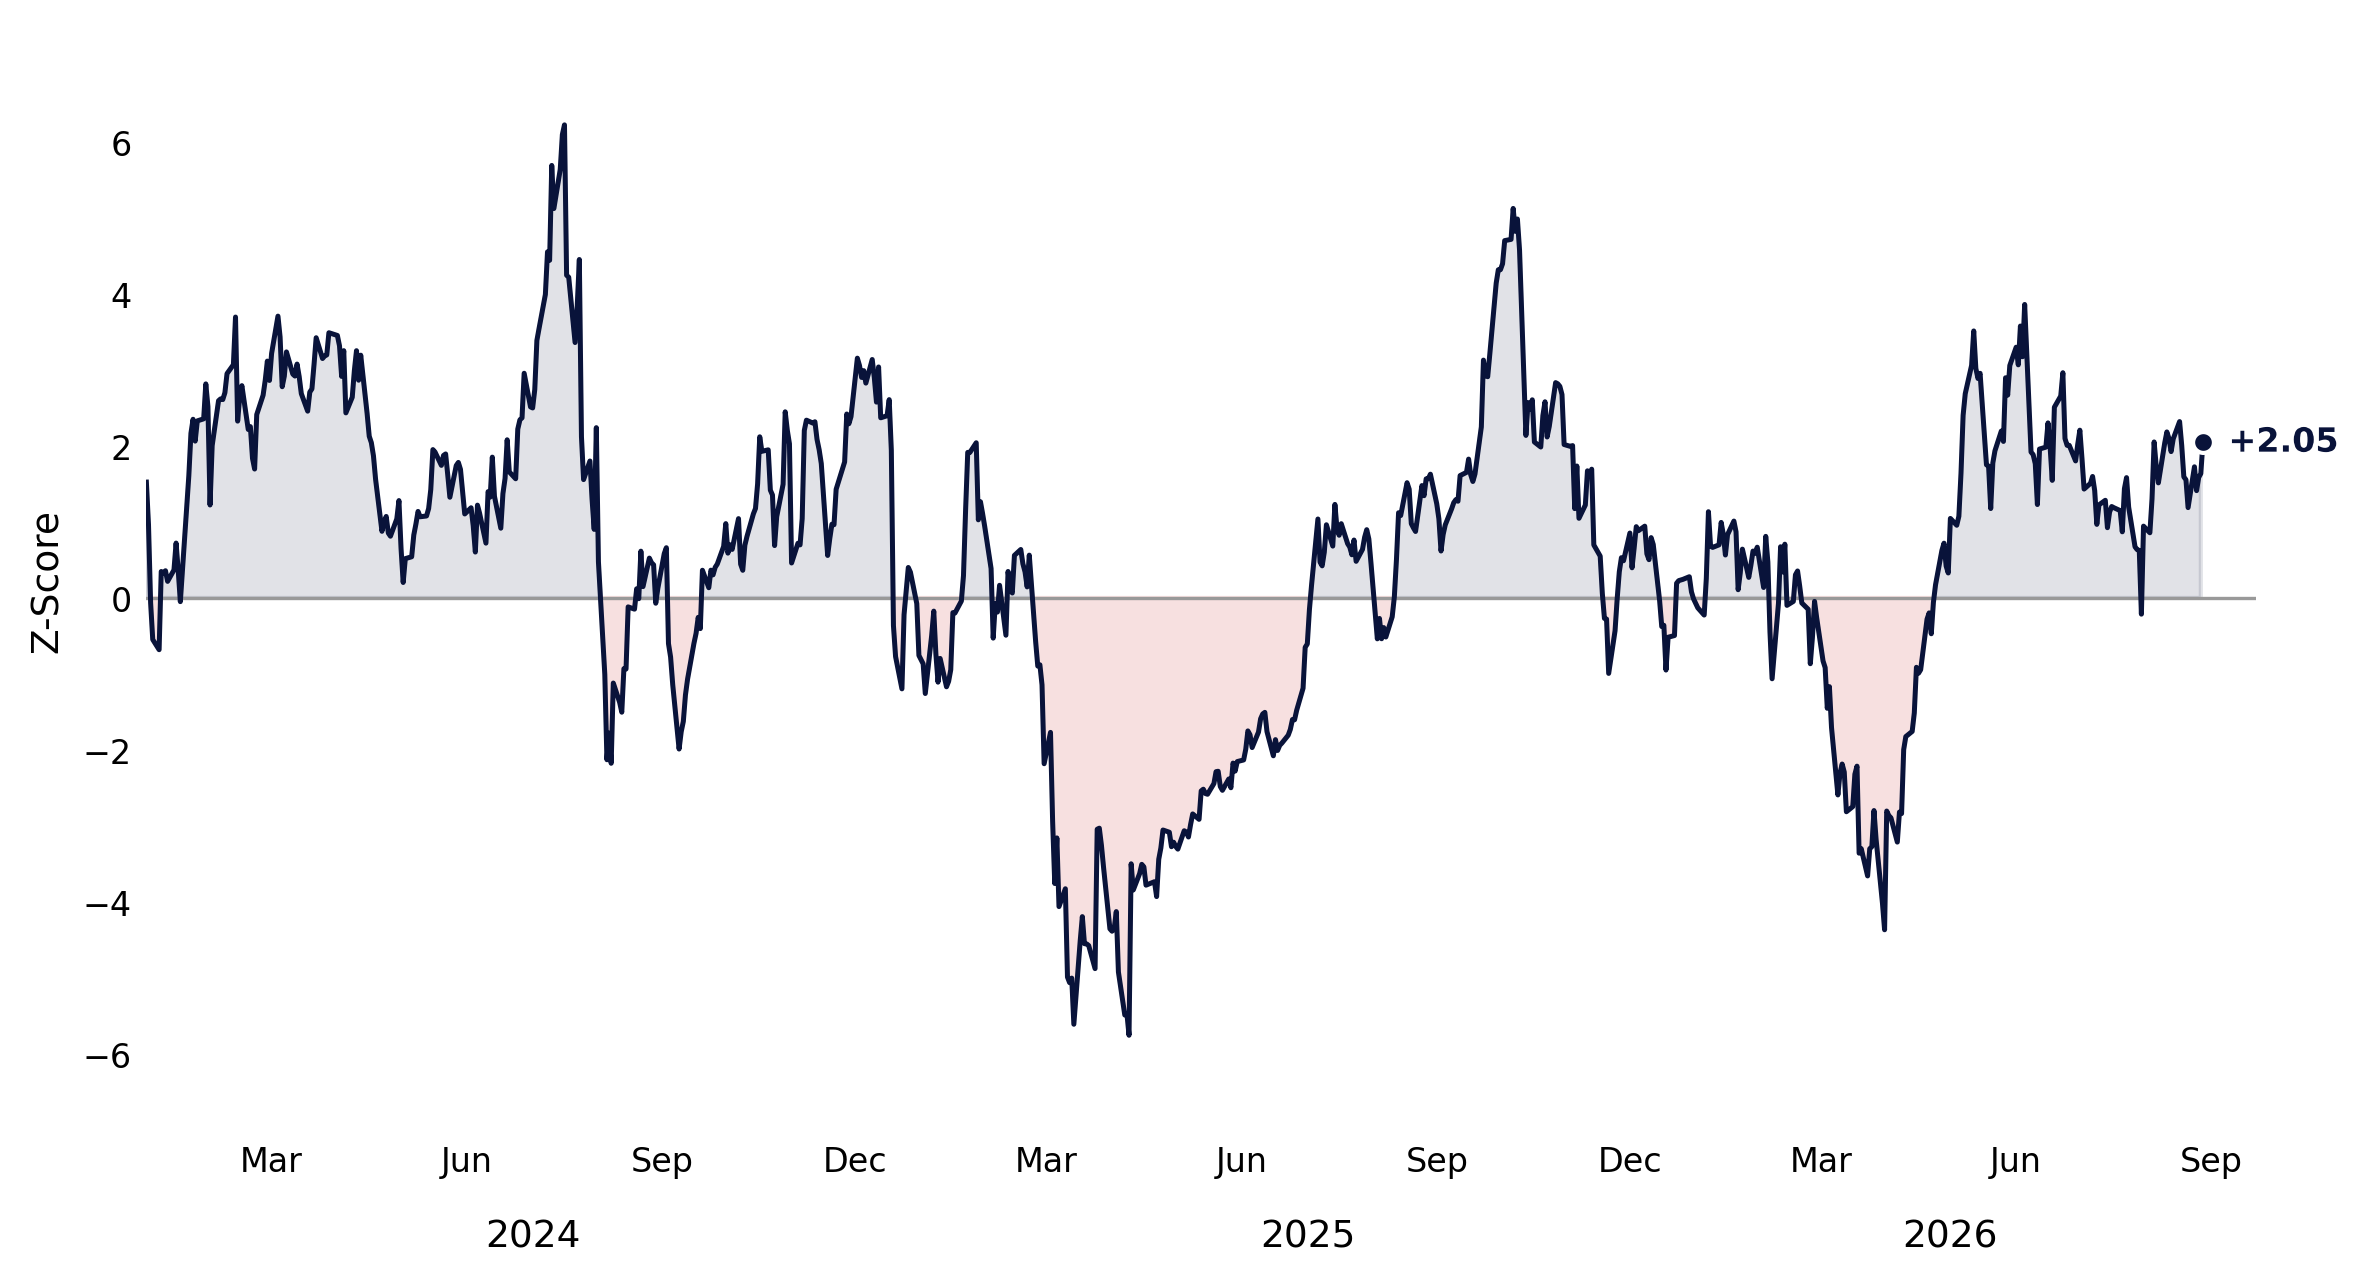
This was exactly what we were looking for following the July reset. Lower volatility created capacity, and systematic investors began deploying it.
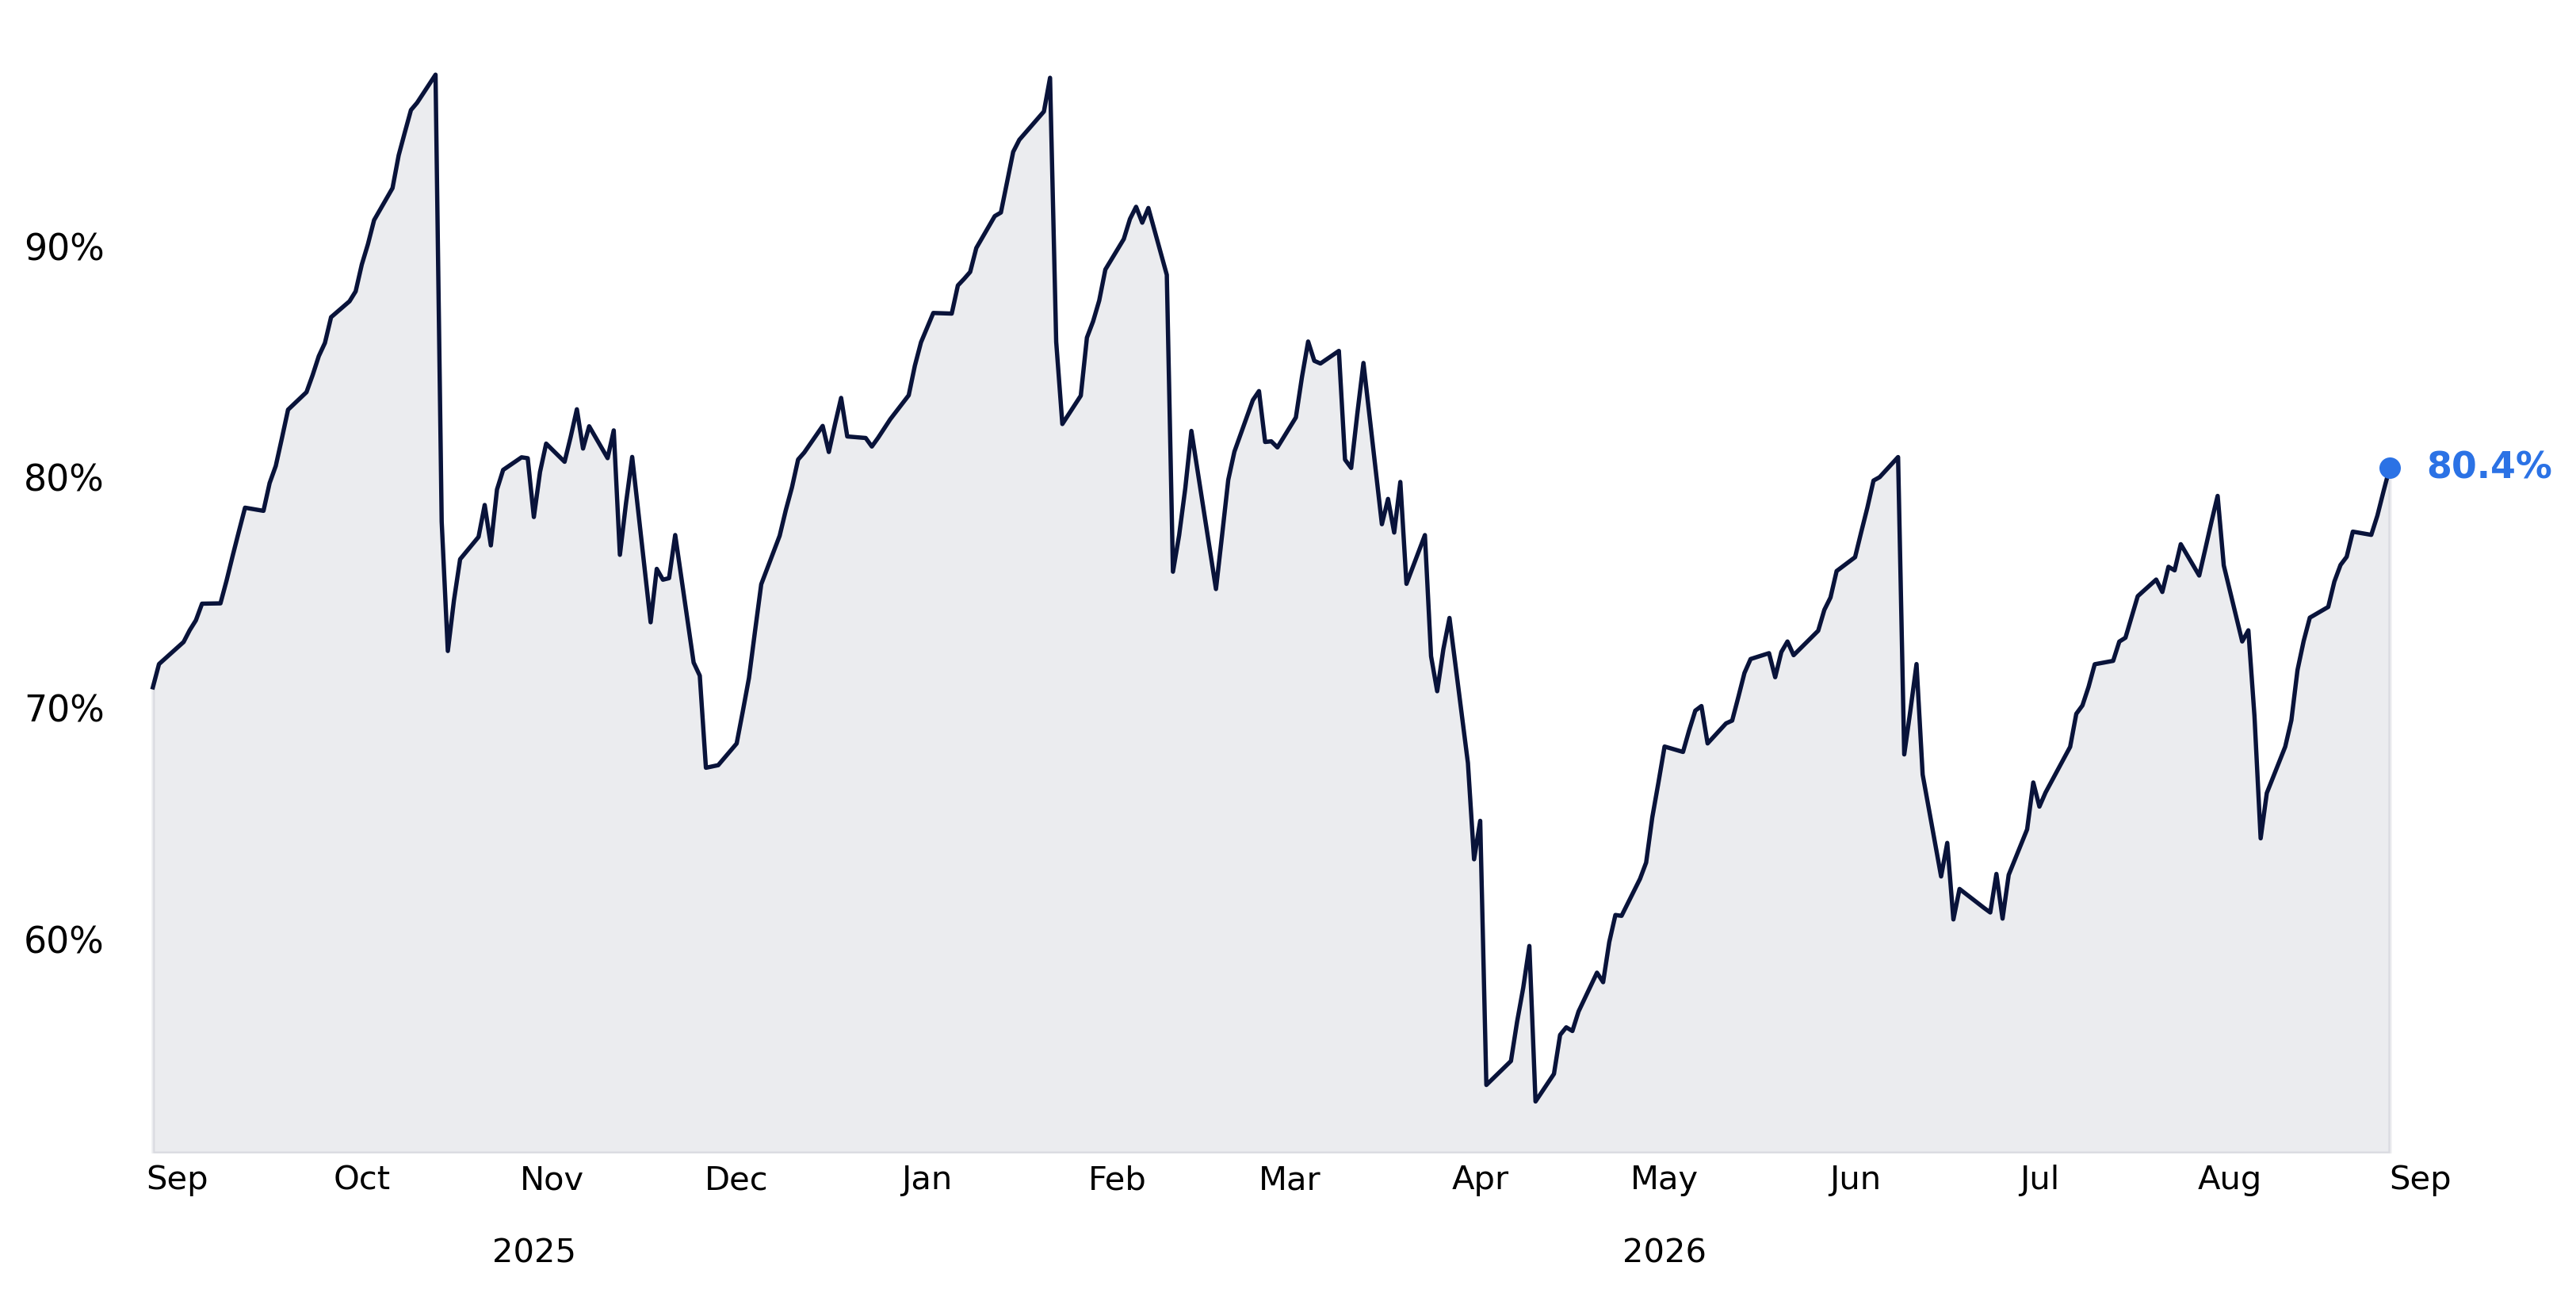
Positioning is not stretched. But the market no longer has the same reservoir of unused systematic buying capacity that existed immediately following the July reset.
B. Quarter-End Adds Another Technical Event
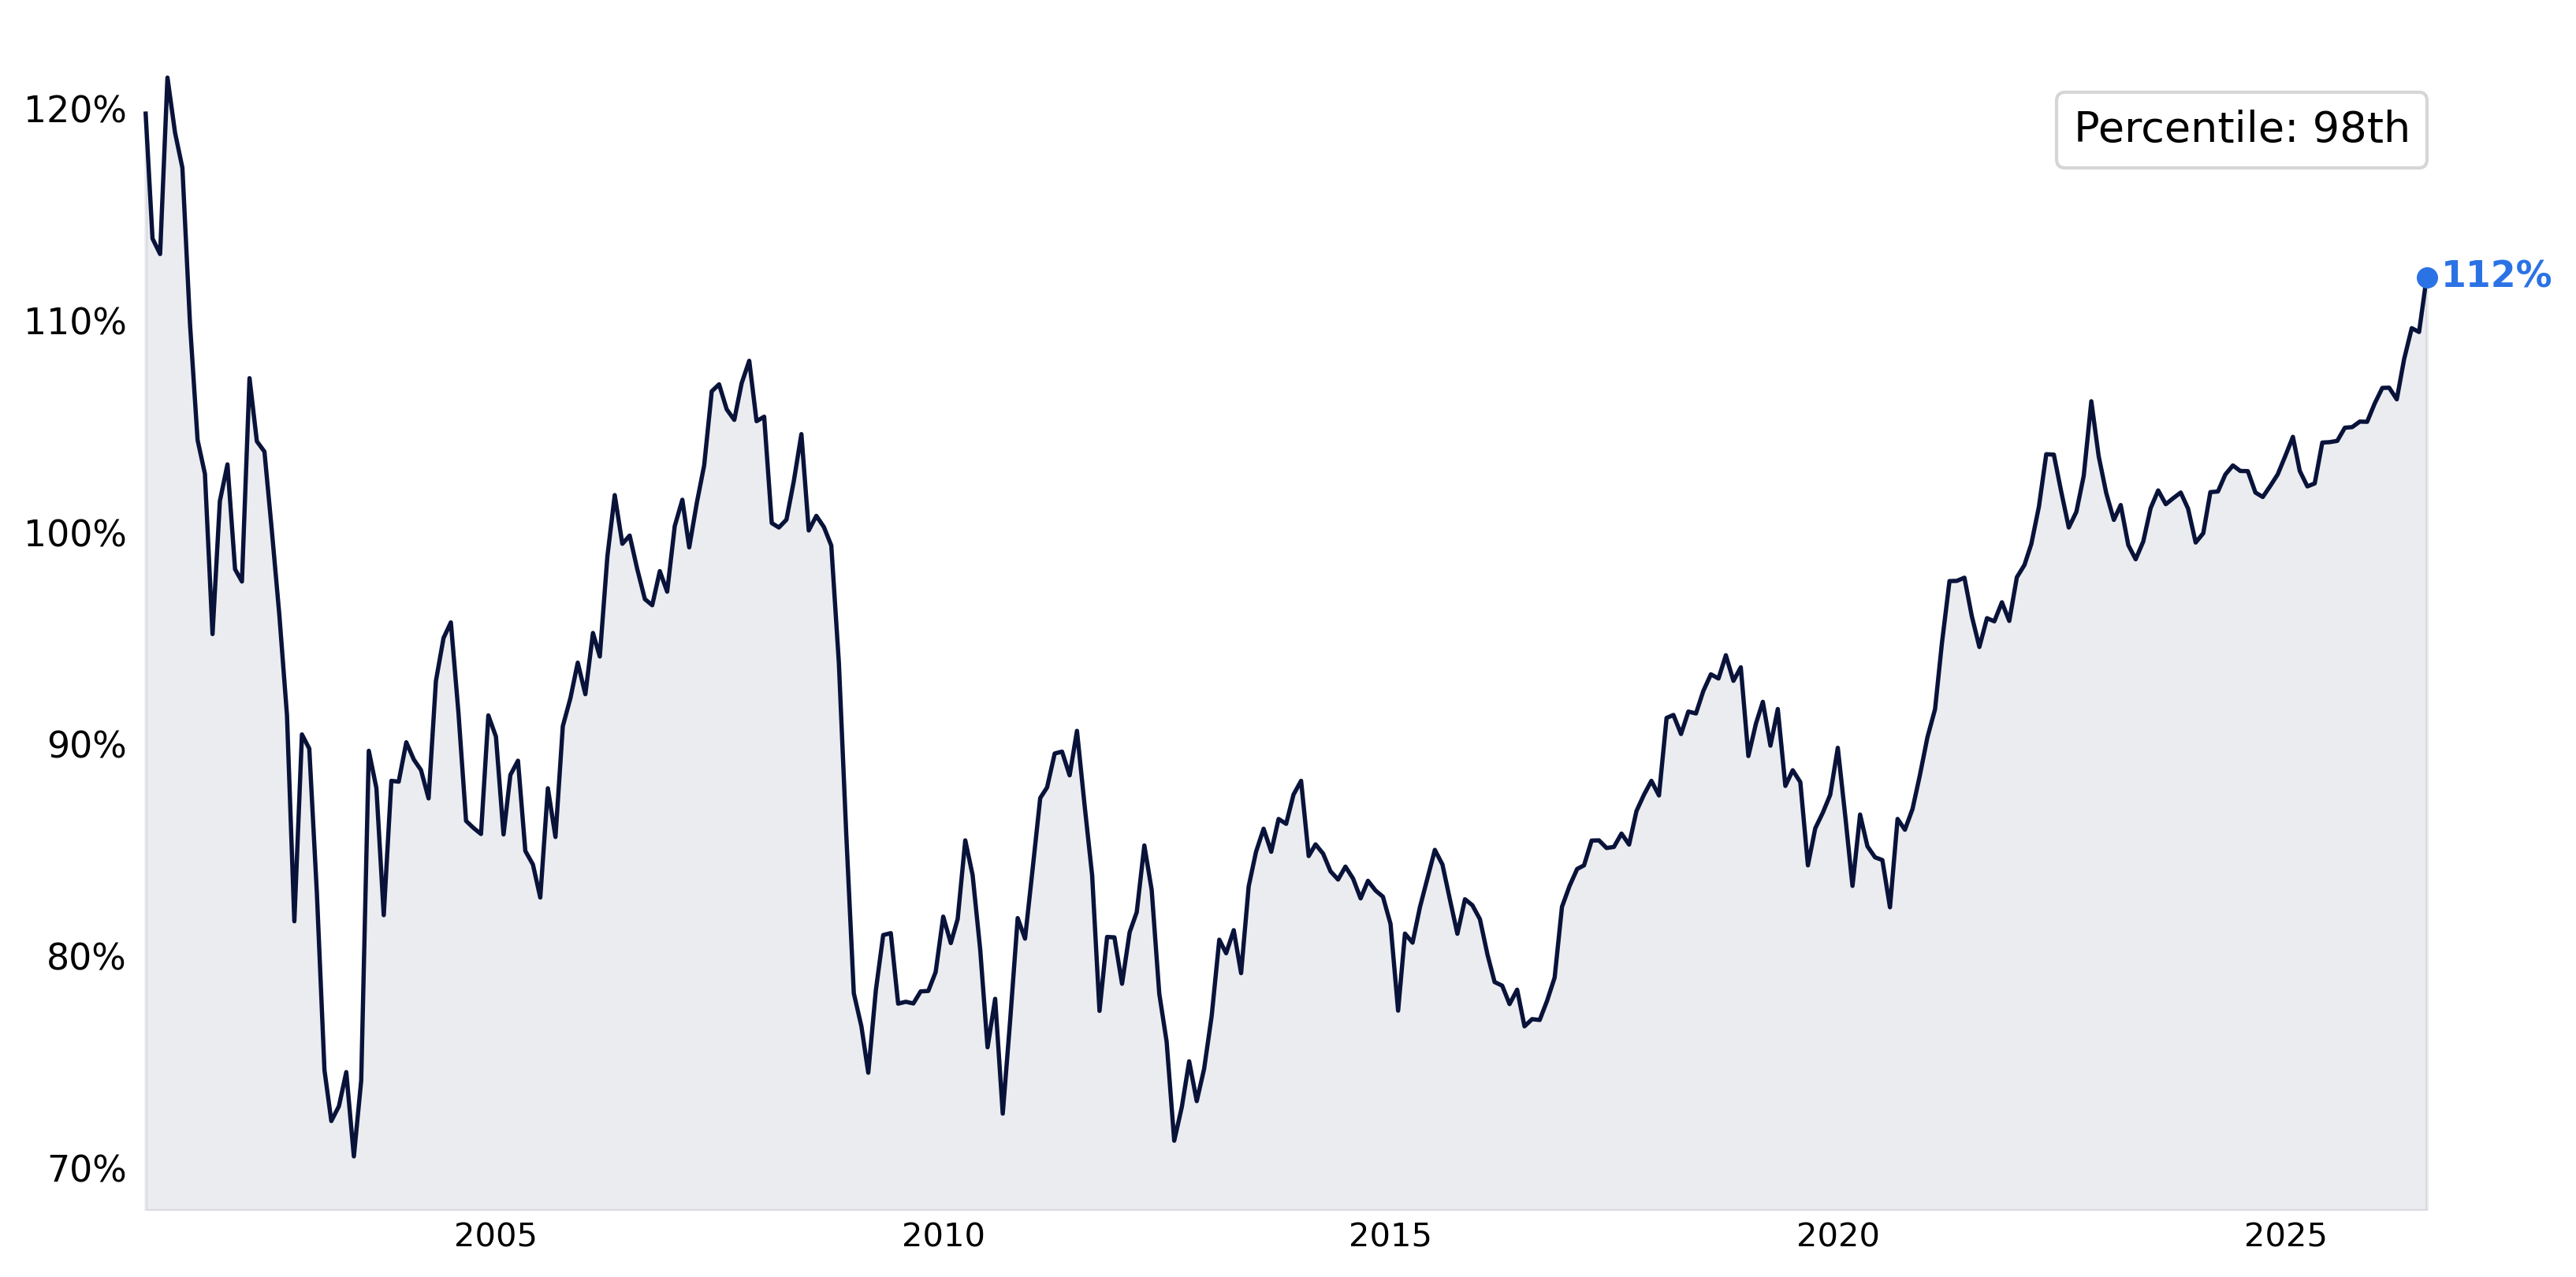
A major technical event also arrives at quarter-end. The top 100 US pension plans are approximately 112% funded, their highest funding levels since 2001.
Strong funding levels continue to incentivize plans to de-glide and immunize portfolios, creating the potential for mechanical equity selling and fixed income buying into quarter-end.
At the same time, systematic equity exposure has rebuilt meaningfully from the July lows while duration remains unusually under-owned.
For the first time since the July reset, the cleaner systematic positioning opportunity may therefore sit in bonds rather than equities.
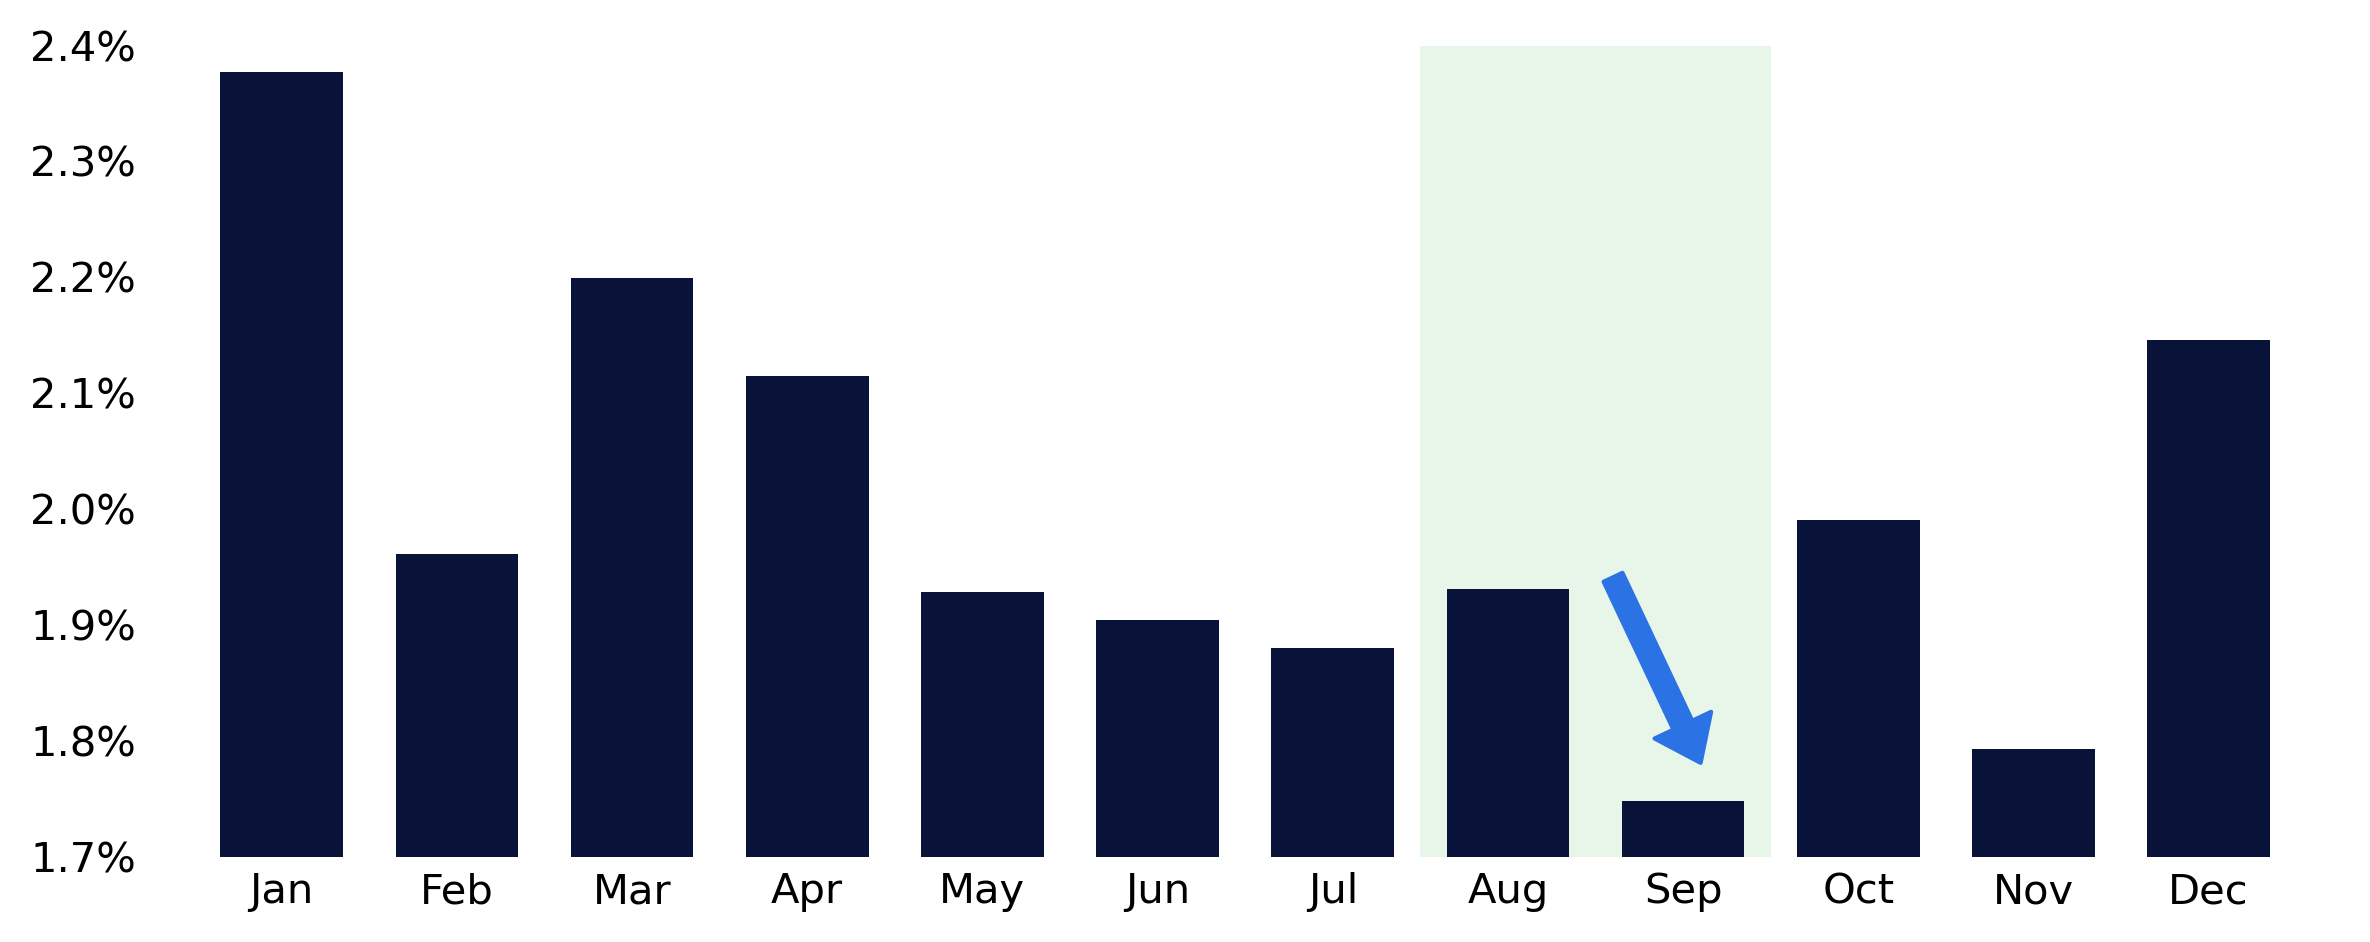
The seasonal equity allocation bid is also relatively weak. September has historically been the weakest month of the year for equity mutual fund purchases, with median purchases of roughly 1.79% of AUM since 1984.
C. September Option Expiration Creates Another Potential Reset
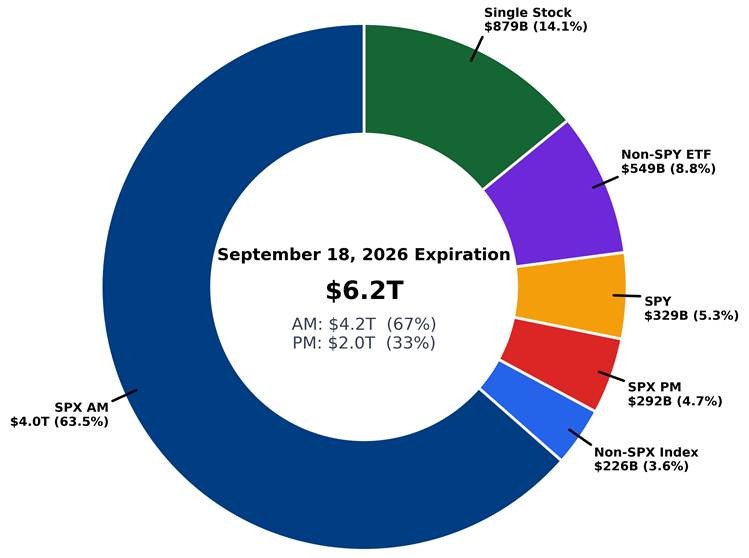
September also brings quarterly options expiration, and it is already shaping up to be a very large event. Approximately $9.6 trillion of US options exposure will expire between now and September 18, representing roughly 35% of total US options exposure.
On September 18, $6.2 trillion is currently set to expire, or 23% of total exposure. That figure should continue to grow as positions in the front weeks roll out the curve. At the current pace, September is tracking to surpass June’s record $7.7 trillion triple-witching expiration.
That creates another potential reset for the market’s technical backdrop. As these positions roll or expire, supportive long gamma dealer positioning can fade with them, potentially removing another shock absorber underneath equities.
4. The Calendar Turns Back to Macro
A. The Next Major Catalysts Are Macro
With earnings largely behind us, the market moves into a very different catalyst calendar.
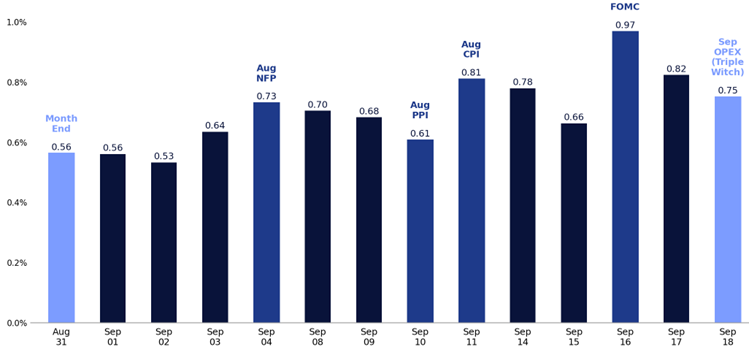
Jackson Hole is followed quickly by NFP on September 4, PPI on September 10, CPI on September 11 and the FOMC decision on September 16.
Unlike earnings, the macro calendar presents a much more two-sided catalyst set. After an earnings season dominated by positive surprises, the right tail around the next set of events is less obvious.
B. September Is the Weakest Part of the Calendar
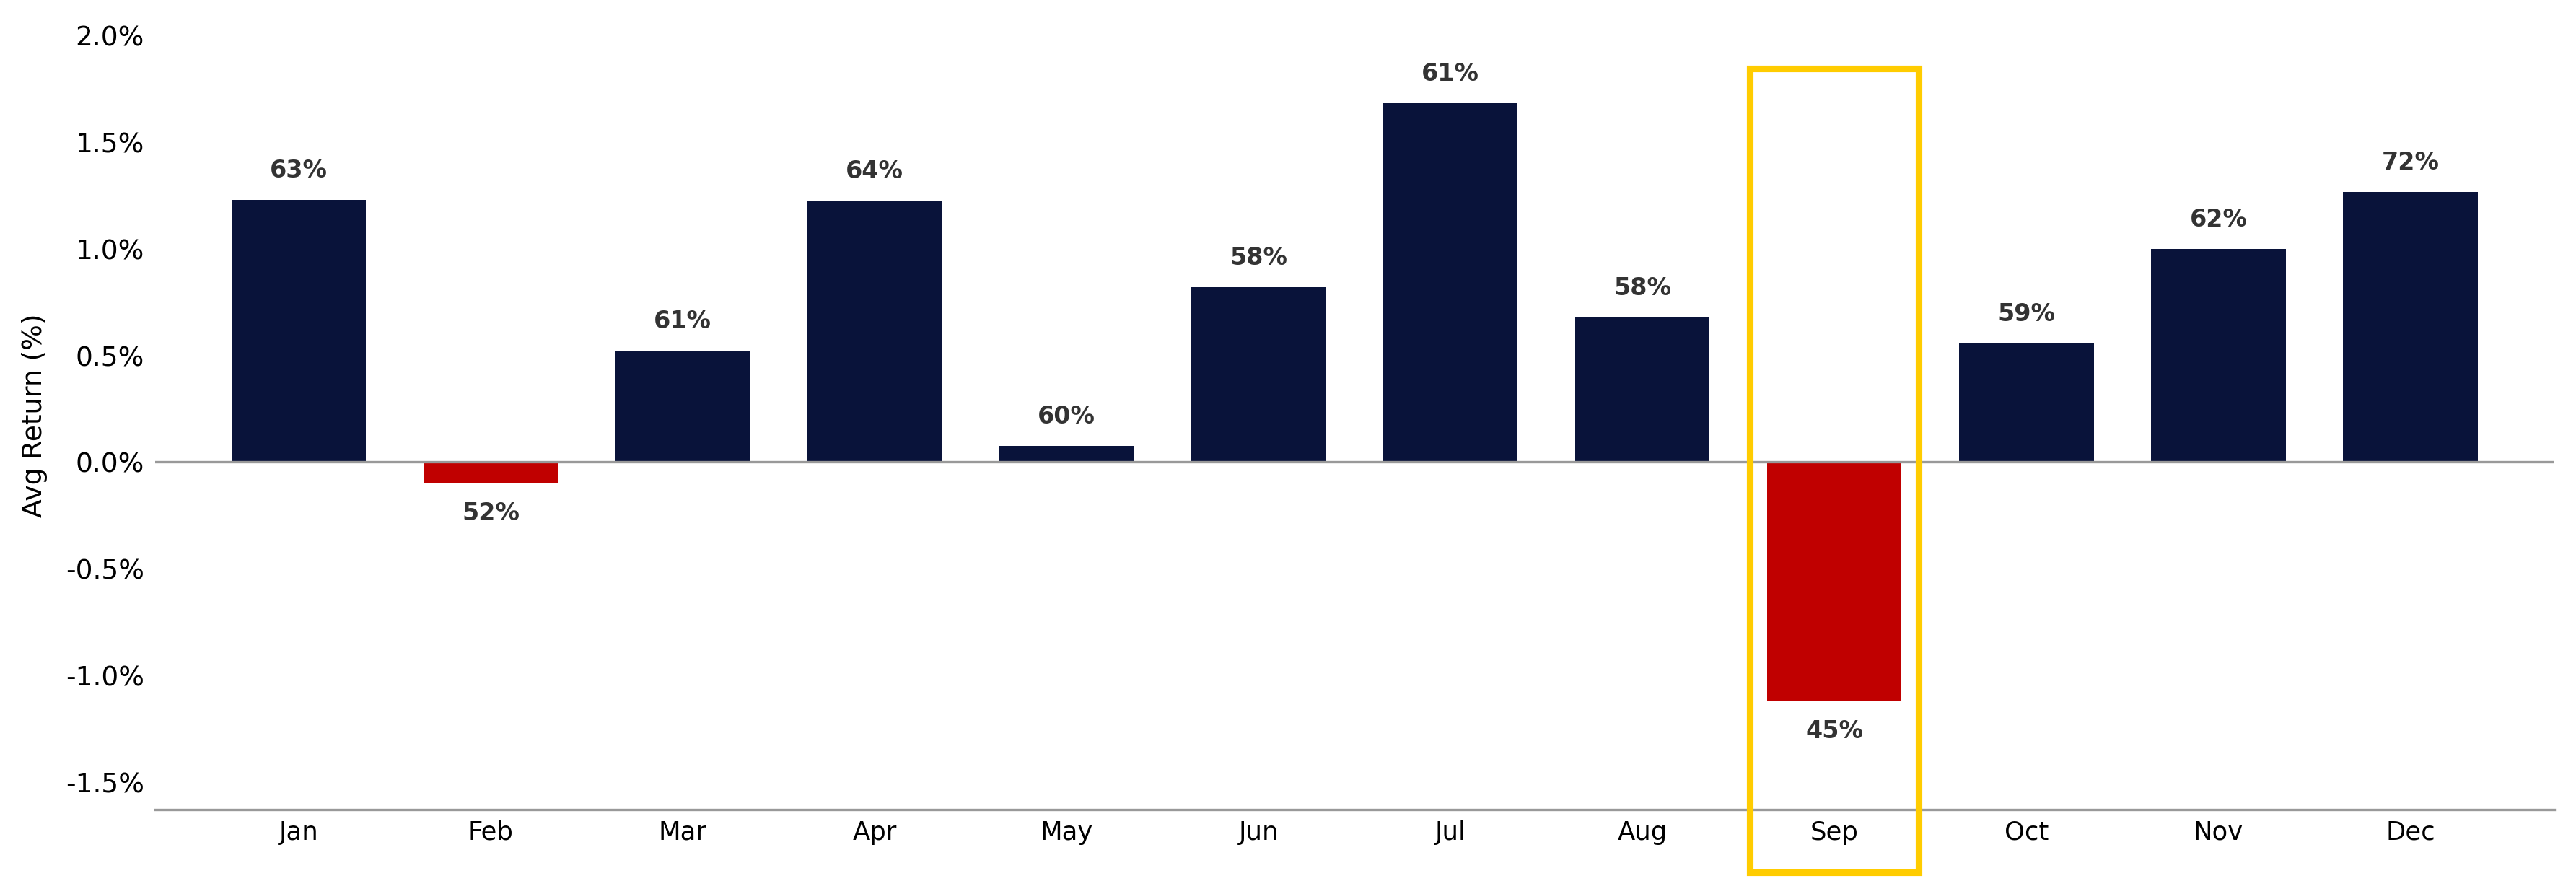
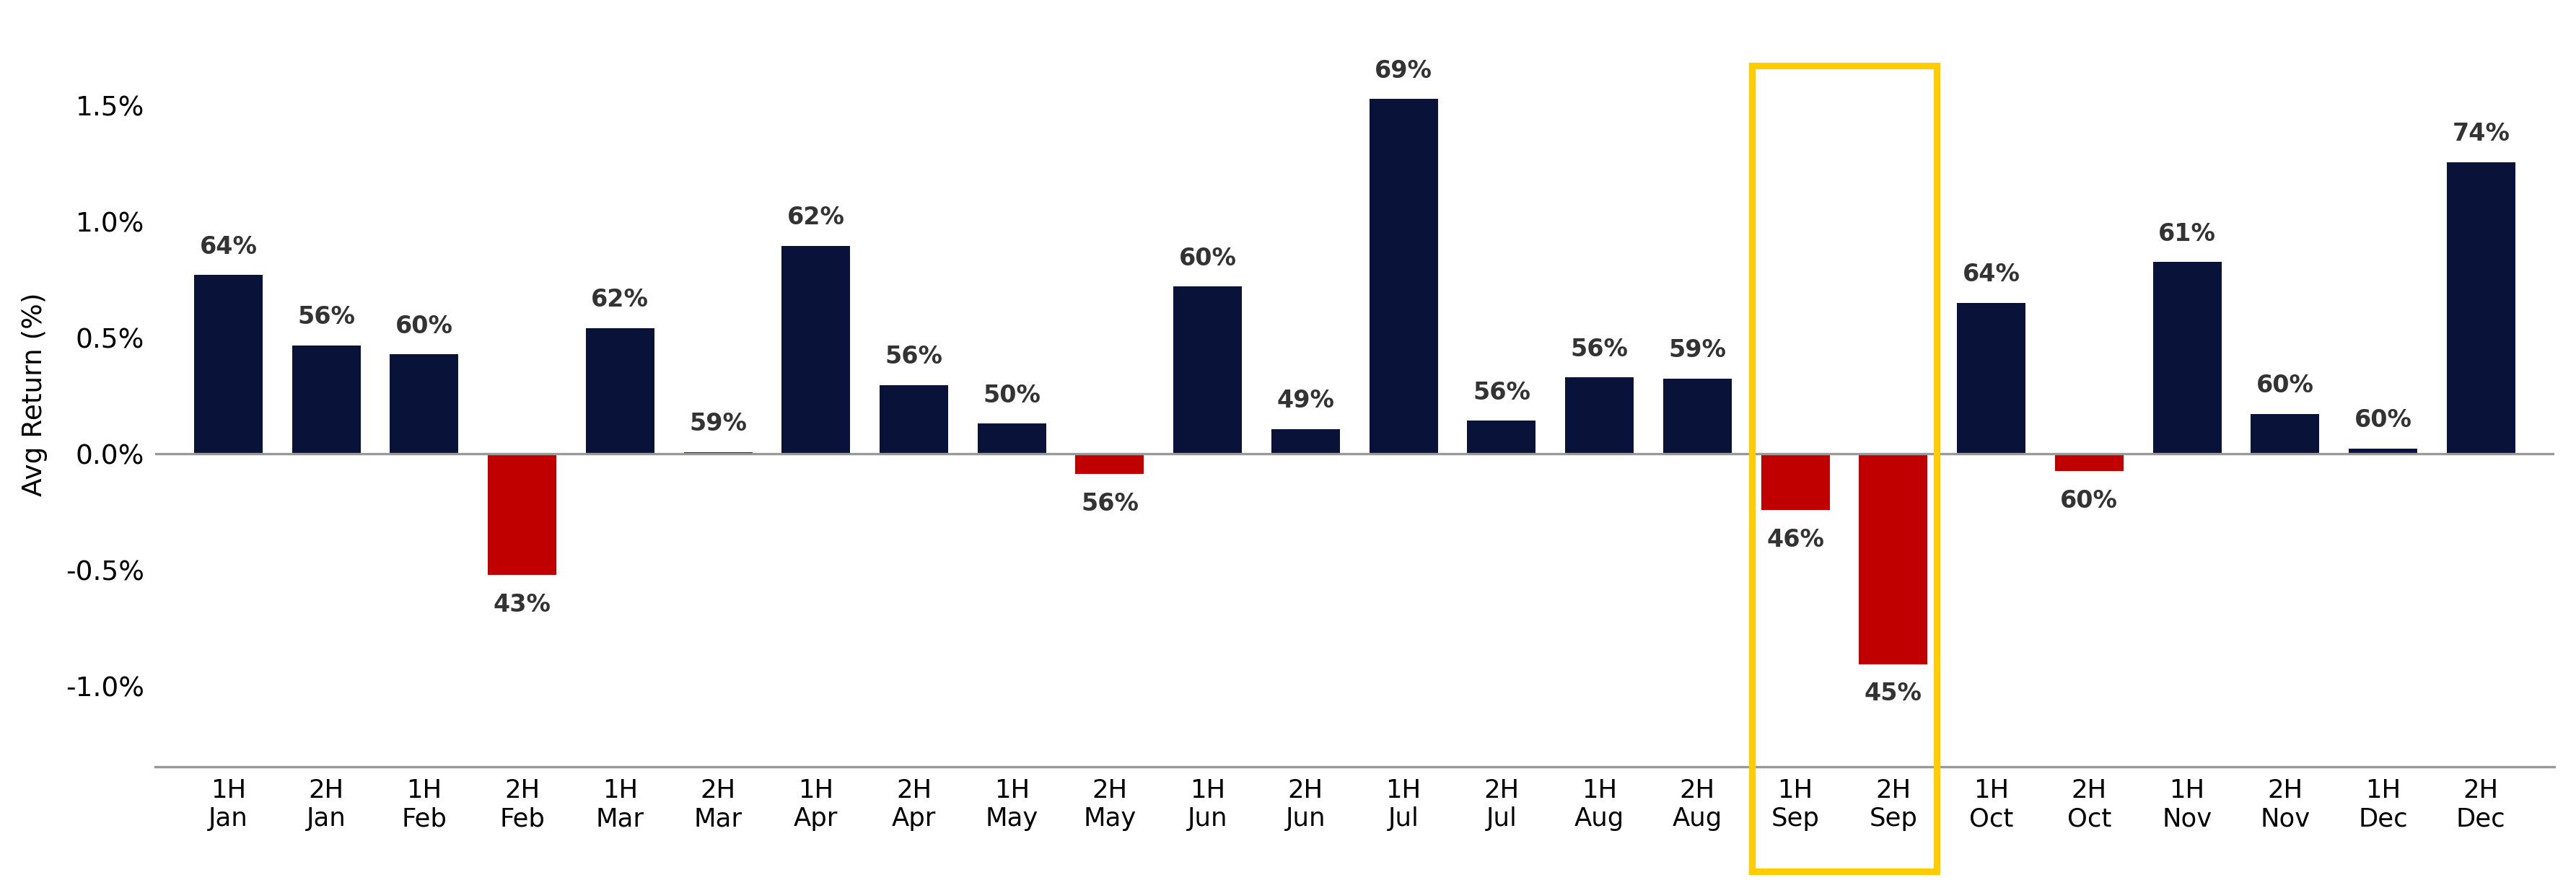
Since 1928, September is the only month in which the S&P 500 has finished lower more often than higher. The index has closed lower in 55% of years, with an average monthly return of negative 1.1% and an average selloff of negative 4.7%.
The weakness has historically been concentrated later in the month. The second half of September has averaged a negative 0.91% return and historically represents the weakest two-week period of the year.
C. Midterm Seasonality Adds Another Headwind
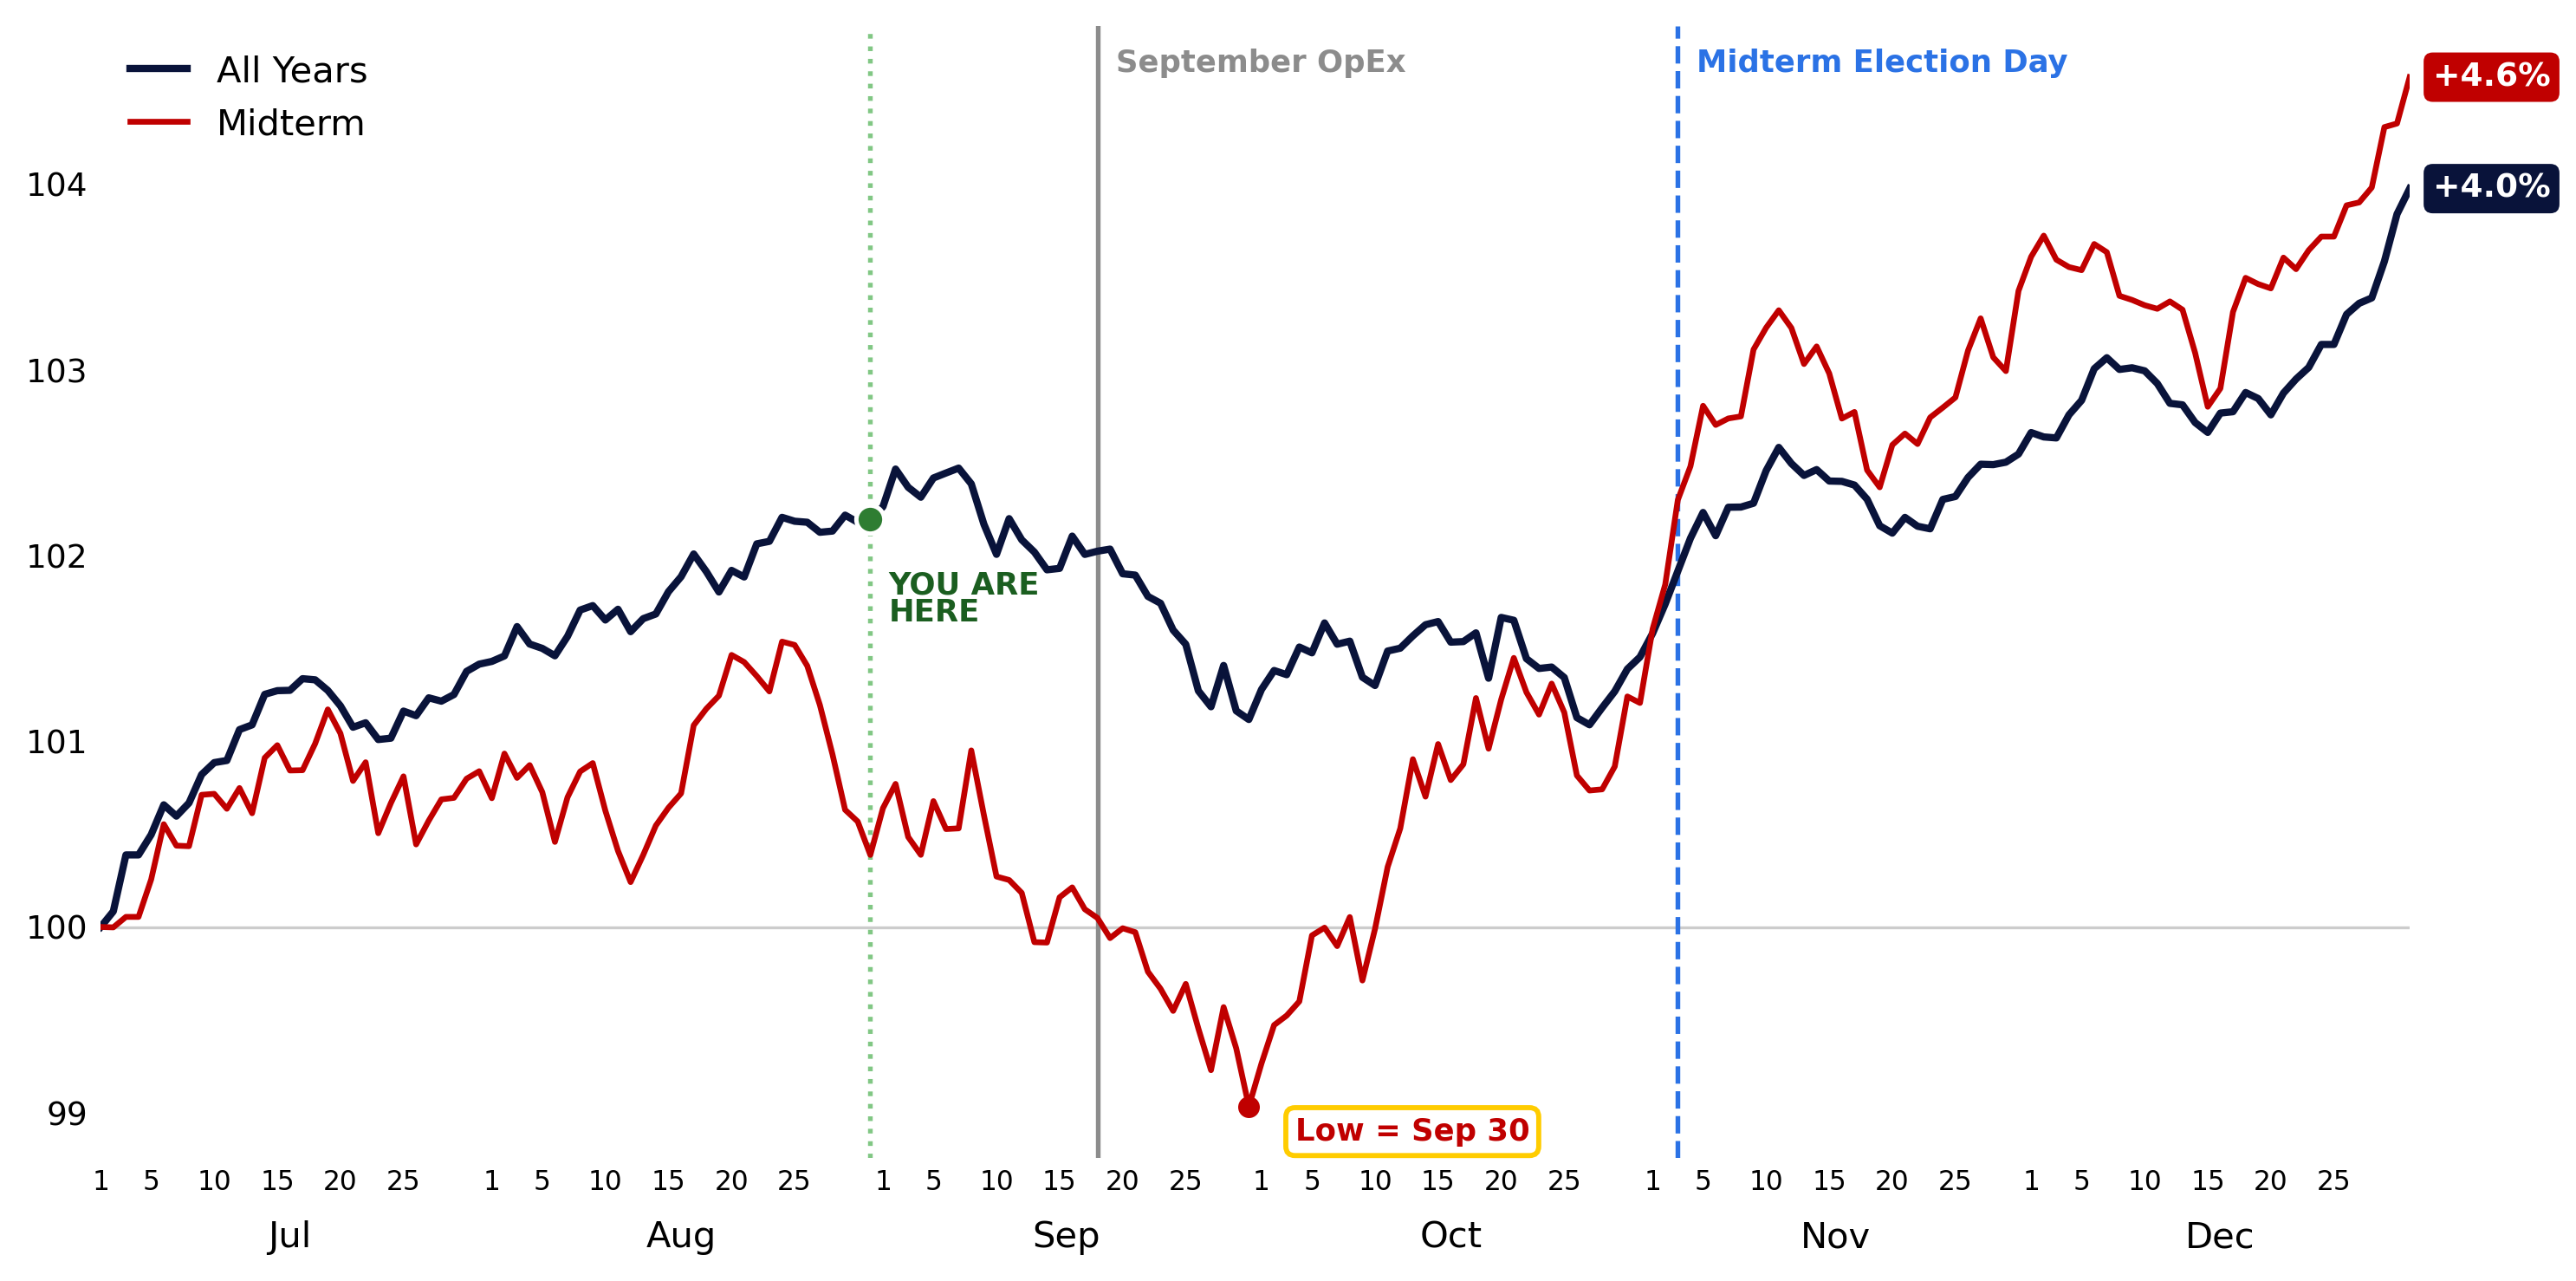
Midterm-election years have amplified the September pattern. September has averaged a negative 1.5% return and a negative 6.2% selloff, with the average path weakening through month-end before recovering in October and accelerating higher around Election Day into year-end.
That path is much closer to how we are thinking about the next several weeks: a tactical window of weakness, followed by a potentially more constructive setup beginning around mid-October, not a change in the broader equity trend.
GMI Bottom Line
I remain constructive on the longer-term outlook for US equities. My concern is the path over the next several weeks.
The setup that carried equities through August is changing. Earnings delivered and are now largely behind us. Retail remains a buyer but historically becomes a smaller source of incremental demand in September. Systematic exposure has rebuilt. The corporate bid should fade as blackout windows return. And after a significant collapse in volatility, that tailwind is now largely behind us.
At the same time, downside protection is inexpensive, duration remains relatively under-owned, September option expiration creates another potential technical reset, and the calendar is turning decisively back toward macro just as we enter the weakest seasonal window of the year.
None of these factors changes the longer-term equity story. But collectively, they change the near-term asymmetry. The upside catalysts are becoming less obvious just as the downside catalysts are becoming more numerous.
I would use strength to reduce some exposure and add inexpensive protection into this event window. I am not looking for the beginning of a broader bearish turn. I am looking for a tactical reset. If September delivers one, it could create a better entry point as we move toward a potentially more constructive setup beginning around mid-October.
Copyright © Citadel Enterprise Americas LLC or one of its affiliates. All rights reserved.
Legal Entities Disseminating this Material: This material is disseminated in the United Kingdom by Citadel Securities (Europe) Limited (“CDGE”) authorized and regulated by the Financial Conduct Authority (“FCA”) (Registered company number: 05462867); in the European Union by Citadel Securities GCS (Ireland) Limited (“CSGI”) and its Paris Branch authorized and regulated by the Central Bank of Ireland (“CBI”) (Registration Number: C173437); in Hong Kong by Citadel Securities (Hong Kong) Limited (“CDHK”) licensed by the Securities and Futures Commission of Hong Kong (“SFC”), in Japan by Citadel Securities Japan Co., Ltd (“CSJC”) registered as a Type 1 financial instruments business operator with the Japan Financial Services Agency (“JFSA”); and in the United States of America by Citadel Securities LLC (“CDRG”) registered with the Securities Exchange Commission (“SEC”), Financial Industry Regulatory Authority (“FINRA”), and Securities Investor Protection Corporation (“SIPC”), Citadel Securities Institutional LLC (“CSIN”) registered with the SEC, FINRA, and SIPC, or Citadel Securities Swap Dealer LLC (“CSSD”) registered with the SEC, Commodities Futures Trading Commission (“CFTC”), and National Futures Association (“NFA”). Unless governing law permits otherwise, you must contact a Citadel Securities entity in your home jurisdiction if you want to use our services in effecting a transaction in any financial instruments or securities, including derivatives.
FOR INSTITUTIONAL USE ONLY; FOR PROFESSIONAL CLIENTS AND ELIGIBLE COUNTERPARTIES ONLY. This material is not intended as and does not constitute investment research. Contents of this material will be strictly limited to non-specific, generic information (i.e. macro events/topics) and are not subject to the Markets in Financial Instruments directive (MiFID II) or FINRA research rules. This material does not constitute an offer, solicitation, invitation, or inducement to purchase, acquire, subscribe to, provide, or sell any financial instrument or otherwise engage in investment activity. Please see additional important disclosures, including disclosures that may be relevant to your country of residence or business at www.citadelsecurities.com/GlobalSalesTrading.