I am currently on a multi-country global roadshow, and the biggest change I have noticed is how quickly sentiment around AI has turned negative.
That does not mean we think the September weakness is finished. The supply/demand setup into month-end remains unfavorable, the technical backdrop is still working against equities, and we continue to think equities can trade lower over the next two weeks.
But the setup is beginning to change. Positioning has been reduced, sentiment has deteriorated quickly, and we are increasingly comfortable using further weakness into month-end to add back to core longs.
We will be back shortly with our full Q4 playbook. For now, the message is simple: cautious into the end of September, increasingly constructive on what comes next.

1. Sentiment Has Flipped
A. The Selloff Is Broader Than It Looks
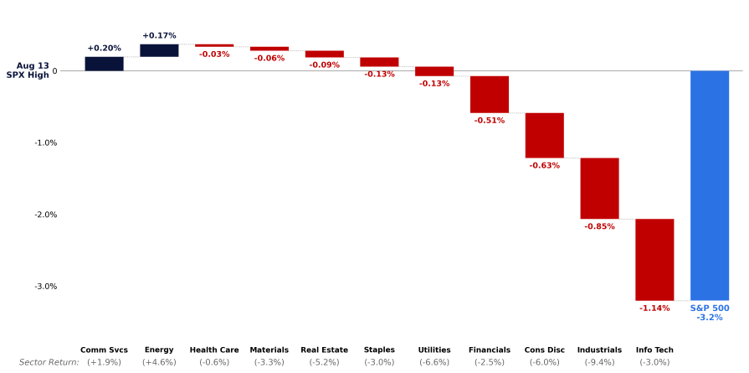
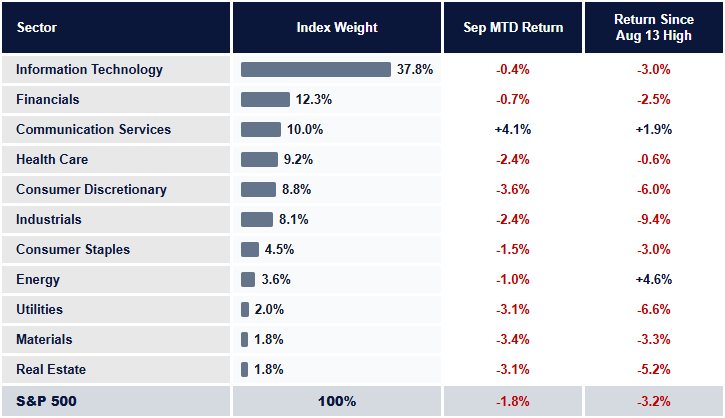
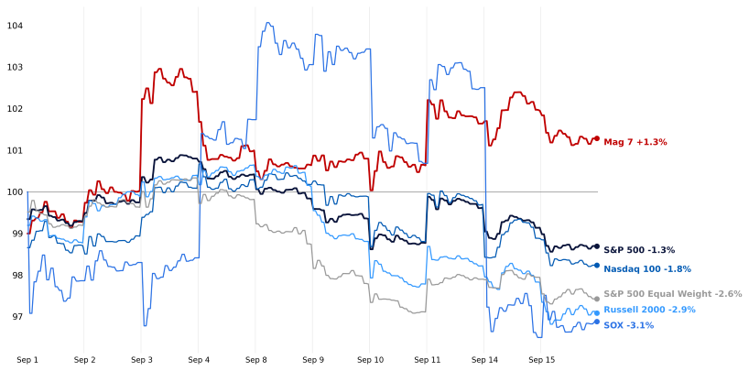
In the September Setup we argued that the tailwinds were fading and that we would rather reduce exposure into the September window than chase the market higher. That is how the month has traded. The S&P 500 is down 1.8% month-to-date and 3.2% from the August 13 high, but the headline index has understated the damage underneath.
Nine of eleven sectors are lower month-to-date. Only Energy and Communication Services, 14% of the index between them, are higher. Since the August high, Information Technology, Industrials and Consumer Discretionary account for the entire decline in index points, while Energy and Communication Services have added roughly 40 points against them. This has been a meaningful drawdown under the surface, but importantly, it has remained rotational rather than disorderly.
B. Concentration Has Cushioned the Index
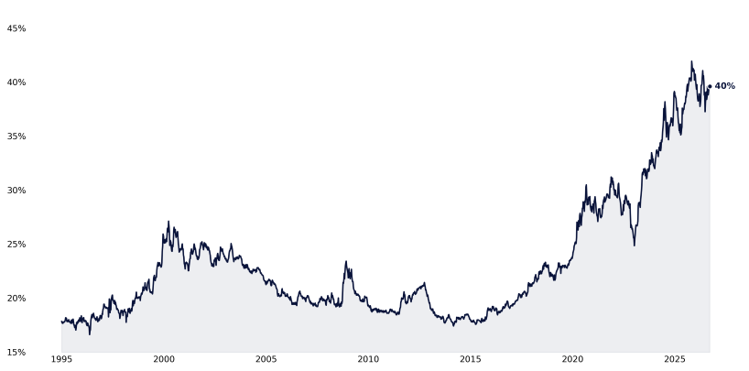
The concentration of the index has helped cushion the headline drawdown. The 10 largest S&P 500 constituents are now roughly 40% of the index, and the largest weights have generally held up better than the average stock. That has allowed the S&P 500 to look relatively contained even as weakness has spread across a much larger share of the market.
C. The Vol Market Looks Different This Time
The price action under the surface has been weak, but it has not looked disorderly. Unlike the July selloff, the current weakness has not been accompanied by the same single-stock volatility or positioning stress. Instead, the clearest repricing has occurred at the index level, where investors are finally paying up for protection.
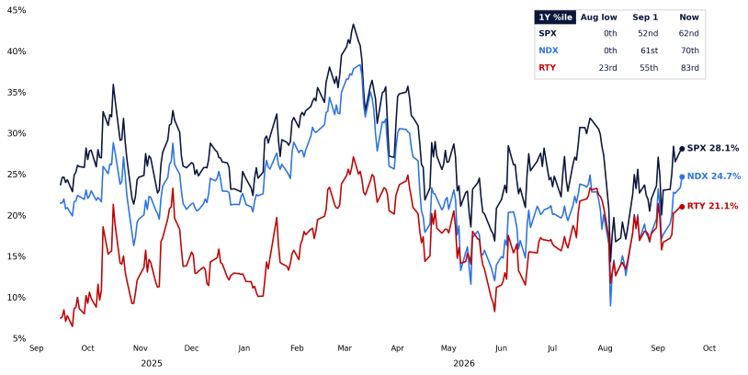
SPX 1-month normalized put/call skew is now in the 62nd percentile versus the past year, up from roughly the 5th percentile at the start of September. NDX is similarly in the 70th percentile, while RUT has moved into the 83rd percentile.
This is a meaningful change from the start of the month. When we published the September Setup, broad-based index hedges were among the cheapest they had been in years. They are not anymore.
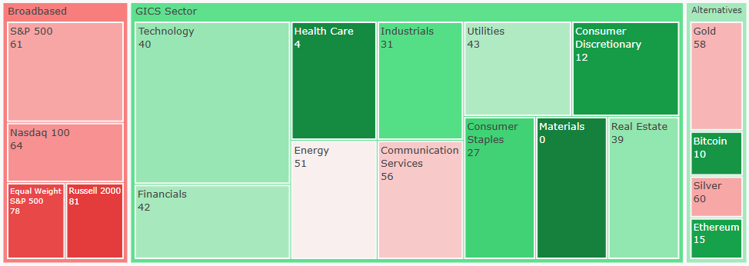
Importantly, that demand for protection has remained concentrated at the index level. Sector skew has only slightly repriced from the extreme lows, with Technology in just the 40th percentile, Industrials 31st, Consumer Staples 27th and Consumer Discretionary 12th. Outright sector vol also remains relatively subdued.
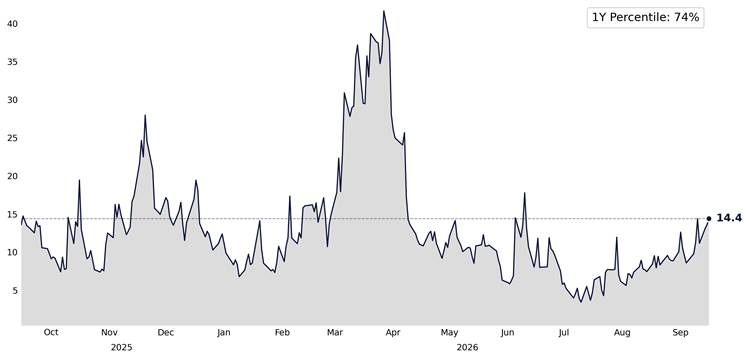
In other words, investors are paying up to hedge the market, but we are not seeing the same scramble for protection underneath it. Implied correlation is reflecting that shift as well: 1-month implied correlation has risen to roughly 14.5%, while 3-month is now around 13% – both the highest levels since early June.
The speculative upside bid has also cooled: the share of S&P 500 constituents with 1-month call IV above ATM has fallen from 60% at the June peak to 45%, and the share with skew fully inverted (calls priced over puts) has halved from 24% in mid-August to 13%.
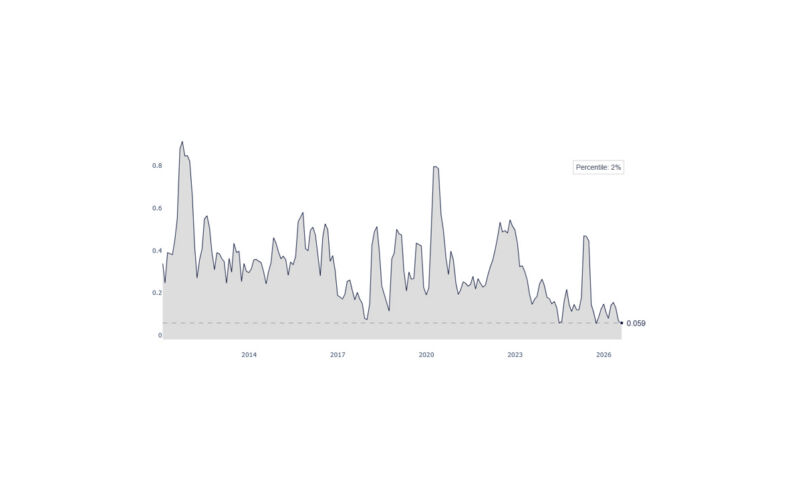
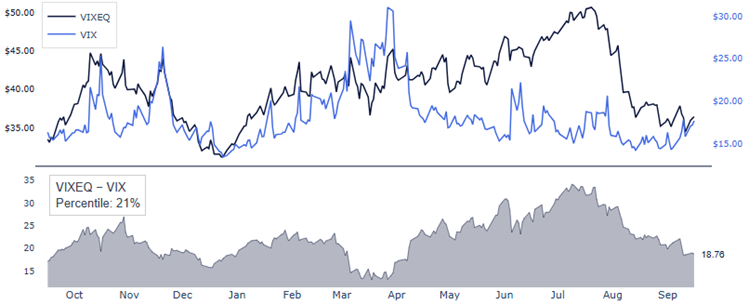
The VIXEQ/VIX spread tells the same story. After reaching record highs during the summer, the gap has continued to normalize as single-stock stress has faded. That does not remove the near-term downside risk, but it does suggest the market is entering this window with materially less embedded single-name leverage than it had in July.
D. Retail Participation Has Faded (Expected)
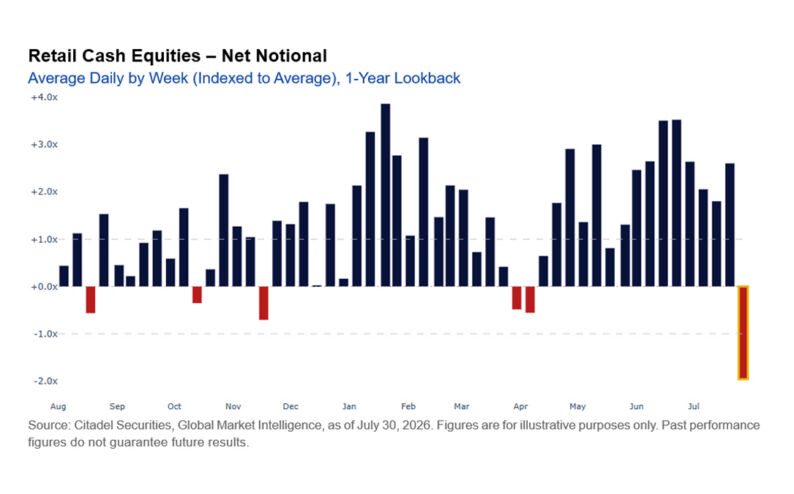
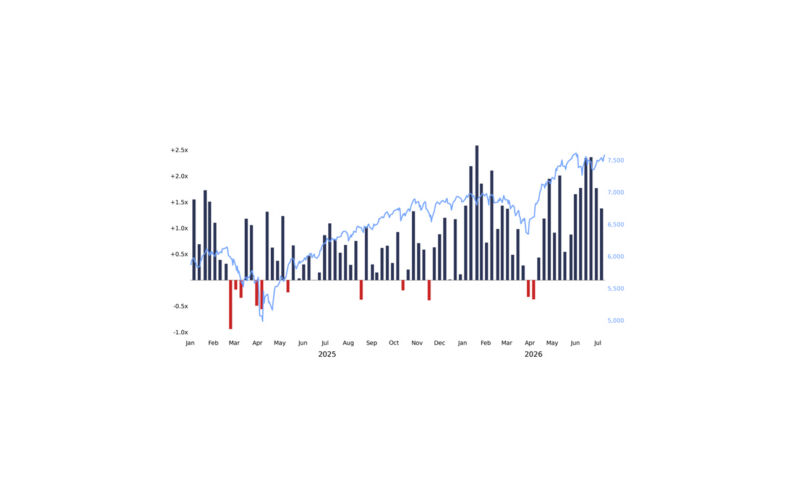
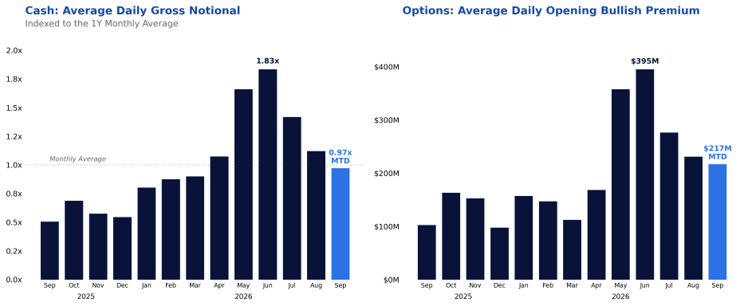
Retail activity has slowed so far this month, which is seasonally typical. At the start of September we highlighted that this is historically the month when retail accumulation fades and dip-buying slows. That has been the case again this year: average daily gross notional is tracking roughly 10% below its 1-year average, while average daily net notional spent in cash equities has fallen below its 1-year average for the first time since April.
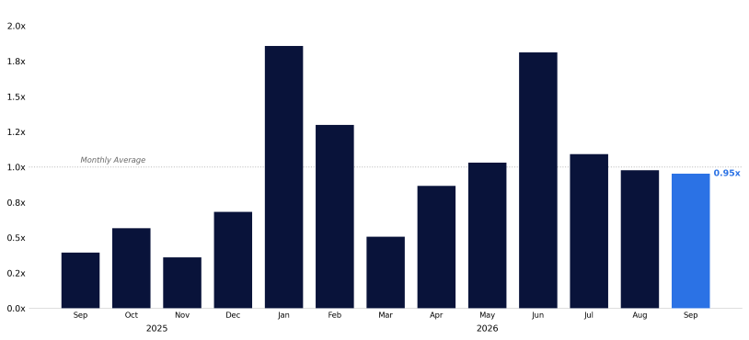
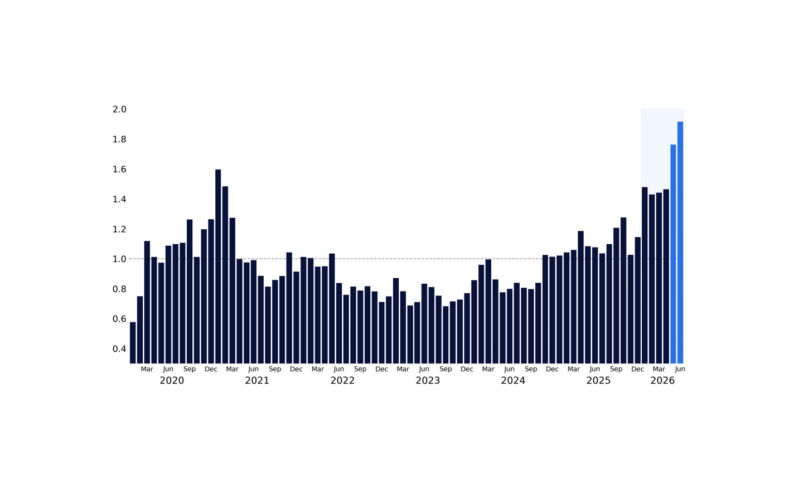
Retail has not capitulated in AI names, it has disengaged. Average daily gross notional in semis flow on our retail platform is tracking 46% below the June peak, while opening bullish options premium is down 45%. Directionally, retail remains 3% better to buy semis through our Call/Put Direction Ratio. This is a participation story, not a liquidation story.
2. Into Month-End, Supply Still Beats Demand
Sentiment has deteriorated sharply, but the near-term technical backdrop is still working against equities. For the remainder of September, several important sources of demand are either fading or already deployed, while the potential sources of supply are increasing.
A. Systematics Still Have Exposure to Sell
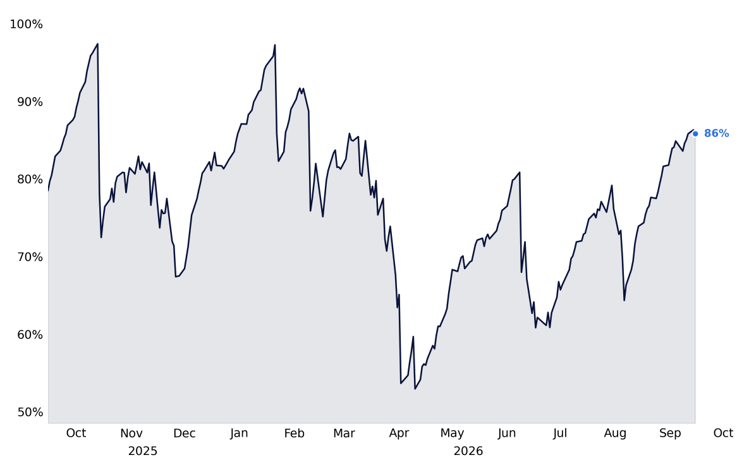
Systematics: there is still potential supply here. Vol-targeting exposure is still elevated, with the modeled 10% vol-target strategy at roughly 86% exposure, the highest since March.
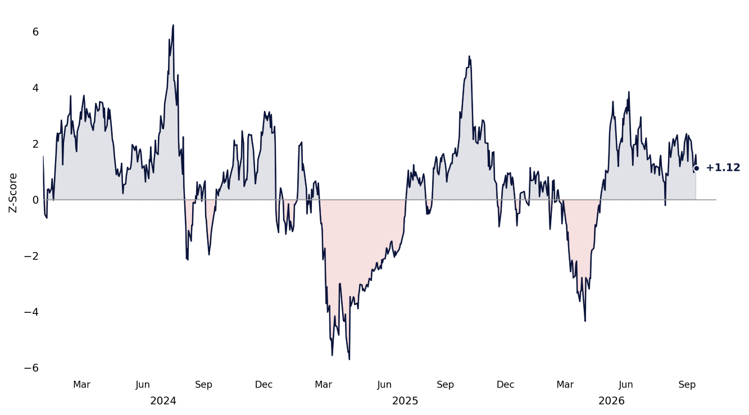
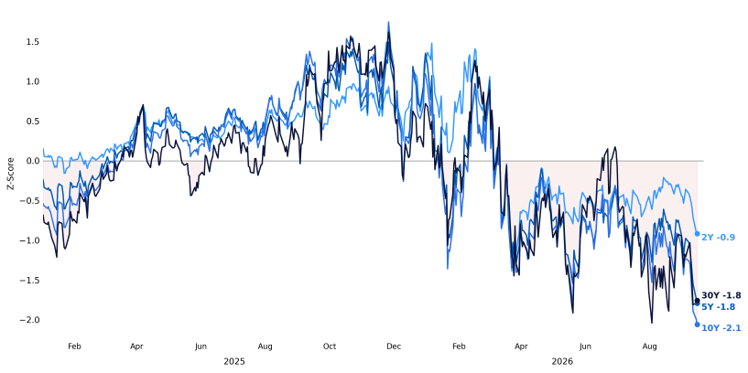
CTAs are still long US equities, albeit less long: our US Equity total z-score has fallen from +2.4 at the end of August to +1.1 today. That is a reduction, not a full unwind, leaving CTAs with room to sell further on additional weakness into quarter-end. At the same time, positioning in US Treasuries remains heavily short across the curve.
B. Quarter-End Creates a Cross-Asset Rebalance
The quarter-end rebalance also starts from an unfavorable cross-asset move. The S&P 500 is still up roughly 1% in Q3, while bonds are down 2.2%, increasing the potential need for pensions to sell equities and buy fixed income into quarter-end.
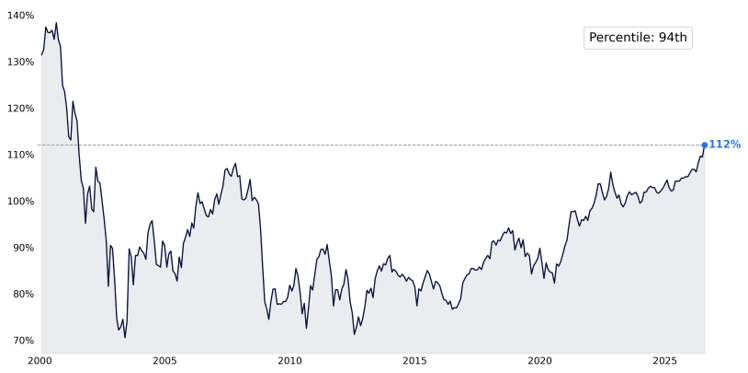
The top 100 US pension plans are approximately 112% funded, their highest funding levels since 2001. Strong funding levels continue to incentivize plans to de-glide and immunize portfolios, creating the potential for mechanical equity selling and fixed income buying into quarter-end.
C. Triple-Witching Expiry Potentially Removes Another Support
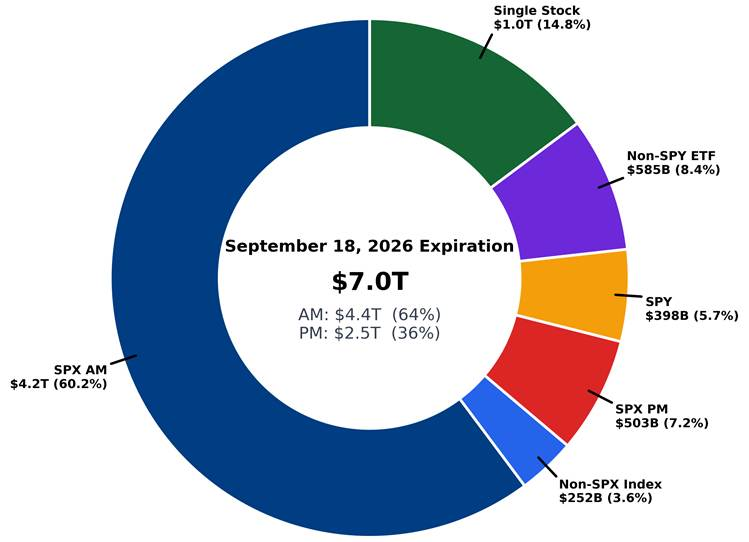
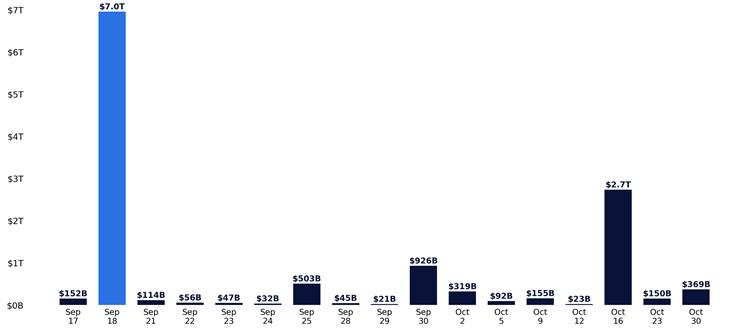
Quarterly options expiry is another major technical event into month-end. Approximately $7T of US equity options exposure expires this Friday, representing roughly 25% of total US options exposure.
That creates another potential reset in the market’s technical backdrop. As these positions expire or roll forward, the positioning that has helped dampen realized moves can change materially, potentially leaving the market more sensitive to underlying flows afterward.
D. The Corporate Bid Goes Dark
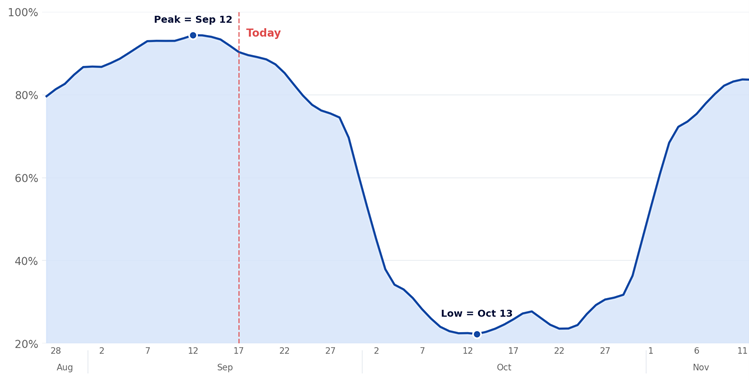
Buybacks are heading into blackout. 10% of S&P 500 weight is in a pre-earnings blackout today. By September 30 that rises to 61%, and the window does not reopen for the majority of the index until November 1. One of the market’s largest structural buyers is stepping aside during exactly the window when the calendar is weakest.
3. September Is Not Done Yet
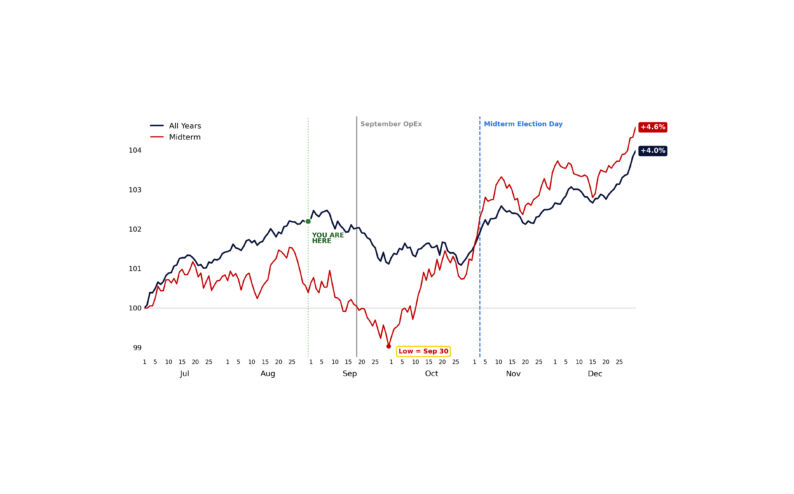
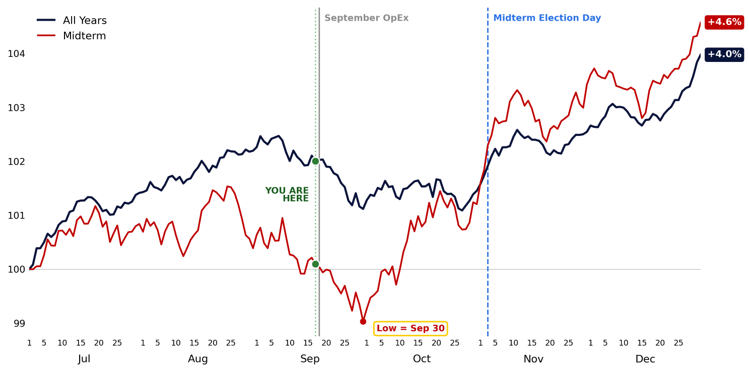
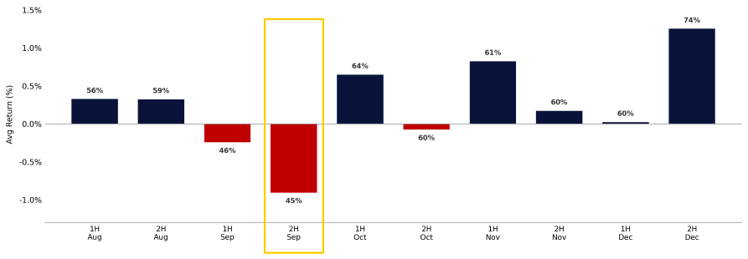
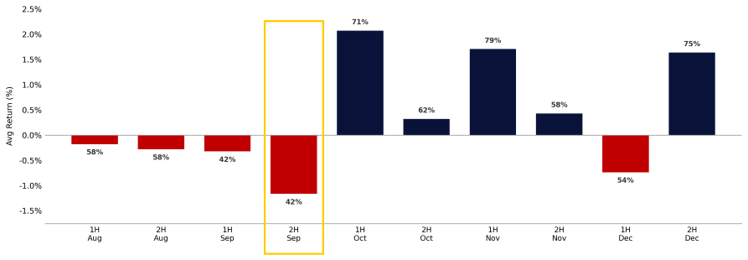
The calendar is now entering the exact window we highlighted earlier this month. Historically, September weakness has been concentrated in the back half of the month, and the pattern has been even more pronounced during midterm years. We continue to think the path into month-end is lower.
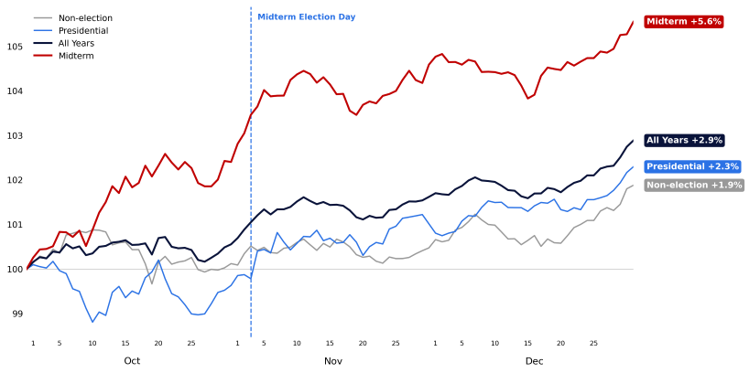
Historically, the average midterm-year path continues to weaken from here into quarter-end. Since 1930, the average path has declined roughly 1.1% between now and September 30, before recovering through October and accelerating into and beyond Election Day. From the September 30 low, the average midterm year has gained 5.6% into year-end.
4. The Setup Changes After September
Where the setup gets more interesting is after quarter-end. The near-term technical headwinds begin to fade in October, and the starting point for positioning looks increasingly different than it did earlier this summer.
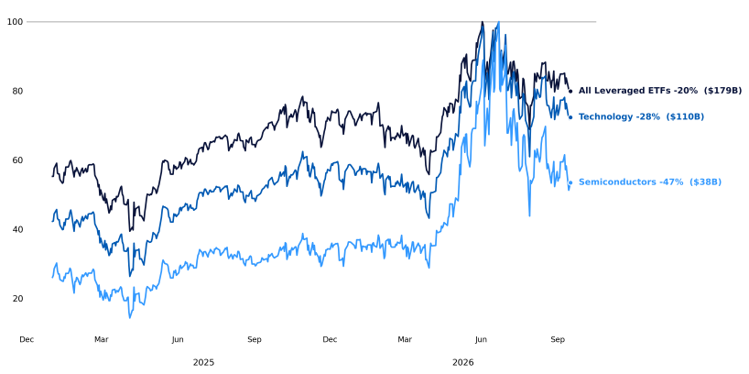
A lot of the excess we wanted to see come out of the AI trade has now come out. Semis vol has round-tripped, leveraged semis AUM is roughly half its June peak, retail participation has fallen sharply, and many equipment and infrastructure names are 30% to 55% below their highs. At the same time, the conversation on the road has flipped remarkably quickly from euphoria to fear.
Three months ago, the risk was that everyone was in the same trade. Increasingly, the risk is that everyone has moved to the same side of the conversation.
This matters for the index. Technology and Communication Services are nearly half of the S&P 500, and it is within Tech where positioning and leverage have cleaned up the most. If that complex catches a bid again, it does not take much to pull the index higher. And if AI leadership broadens again into earnings, the rally can extend well beyond the names that led the first leg.
We will save the full Q4 playbook for the next note, but several pieces are beginning to line up:
- Seasonality flips. In midterm years, Q4 has averaged +5.6% from September 30 versus +2.9% across all years, with the average midterm path turning higher almost immediately after quarter-end.
- Buybacks come back. More than half of S&P 500 weight is back in an open window by November 1 and nearly all of it by November 8, alongside fresh Q3 buyback authorizations.
- Positioning is cleaner. Leverage has come out most aggressively in the same parts of the market where sentiment has deteriorated the most.
- Retail seasonality improves. September has historically been the seasonal low point for retail accumulation.
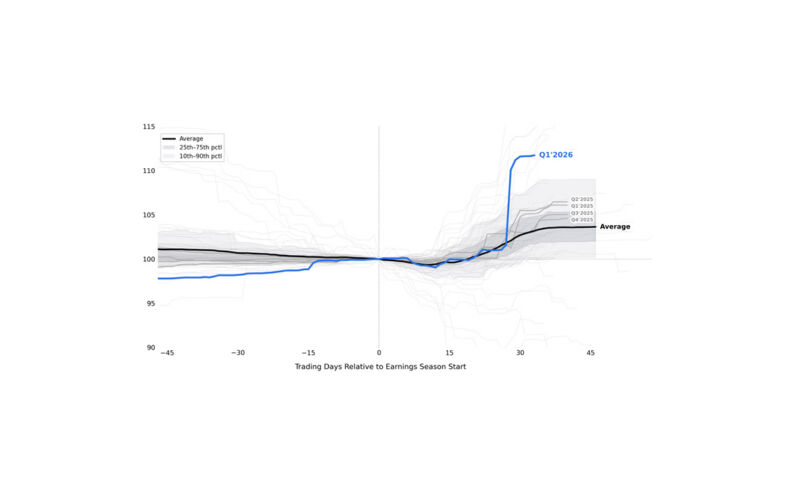
- Earnings return. Q3 reporting begins in mid-October following a Q2 season that delivered roughly 33% EPS growth and the steepest positive revision path since at least 2000.
We are comfortable using further weakness into month-end to add to core longs.
GMI Bottom Line
Our tactical view remains unchanged: we think equities have more downside into month-end. Buybacks are moving into blackout, $7T of options exposure rolls off Friday, systematic positioning remains a potential source of supply, quarter-end rebalancing is unfavorable, and we are entering the weakest part of the midterm-year calendar.
But importantly, we are becoming more constructive, not less, as that weakness develops.
- Now: AI sentiment has turned sharply negative and positioning has been reduced.
- Through September: supply/demand and seasonality still point to downside.
- Into October / Q4: those same September resets begin to work in the other direction, first in Tech and potentially across the broader market into earnings and year-end.
We would use further weakness into month-end to add to core longs. We will be back shortly with our full Q4 playbook and why we think the setup improves materially once we get through September.
Copyright © Citadel Enterprise Americas LLC or one of its affiliates. All rights reserved.
Legal Entities Disseminating this Material: This material is disseminated in the United Kingdom by Citadel Securities (Europe) Limited (“CDGE”) authorized and regulated by the Financial Conduct Authority (“FCA”) (Registered company number: 05462867); in the European Union by Citadel Securities GCS (Ireland) Limited (“CSGI”) and its Paris Branch authorized and regulated by the Central Bank of Ireland (“CBI”) (Registration Number: C173437); in Hong Kong by Citadel Securities (Hong Kong) Limited (“CDHK”) licensed by the Securities and Futures Commission of Hong Kong (“SFC”), in Japan by Citadel Securities Japan Co., Ltd (“CSJC”) registered as a Type 1 financial instruments business operator with the Japan Financial Services Agency (“JFSA”); and in the United States of America by Citadel Securities LLC (“CDRG”) registered with the Securities Exchange Commission (“SEC”), Financial Industry Regulatory Authority (“FINRA”), and Securities Investor Protection Corporation (“SIPC”), Citadel Securities Institutional LLC (“CSIN”) registered with the SEC, FINRA, and SIPC, or Citadel Securities Swap Dealer LLC (“CSSD”) registered with the SEC, Commodities Futures Trading Commission (“CFTC”), and National Futures Association (“NFA”). Unless governing law permits otherwise, you must contact a Citadel Securities entity in your home jurisdiction if you want to use our services in effecting a transaction in any financial instruments or securities, including derivatives.
FOR INSTITUTIONAL USE ONLY; FOR PROFESSIONAL CLIENTS AND ELIGIBLE COUNTERPARTIES ONLY. This material is not intended as and does not constitute investment research. Contents of this material will be strictly limited to non-specific, generic information (i.e. macro events/topics) and are not subject to the Markets in Financial Instruments directive (MiFID II) or FINRA research rules. This material does not constitute an offer, solicitation, invitation, or inducement to purchase, acquire, subscribe to, provide, or sell any financial instrument or otherwise engage in investment activity. Please see additional important disclosures, including disclosures that may be relevant to your country of residence or business at www.citadelsecurities.com/GlobalSalesTrading.