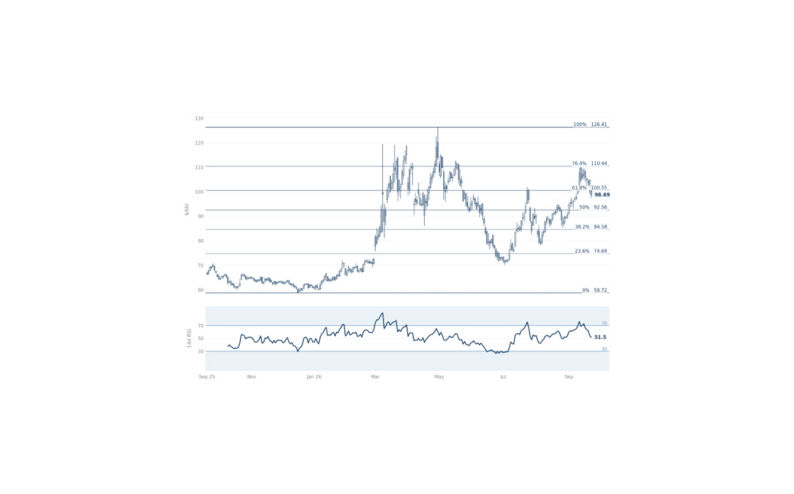
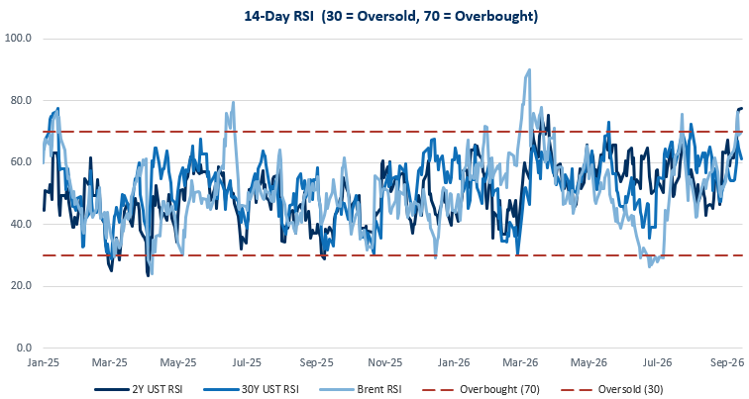
We expect the Federal Reserve to hike in September, December and March-27, returning us to the baseline we established ahead of the June meeting. Whilst Chair Warsh’s communication has been somewhat inconsistent in its timing relative to the chronology of the data, we think the broader Committee remains supportive of tighter policy, and that the Jackson Hole speech, provided it is followed by policy action this week, could represent an important clarification of the Fed’s reaction function. As a result, we think a hike this week could prove a clearing event for both fixed income and risk assets. At the same time, a number of technical and momentum indicators suggest that both energy and front-end fixed income are stretched at current levels, leaving the more convex near-term move more likely to be toward lower energy prices and lower yields across the curve. Thirty-year yields have risen around 15bp since we flipped to constructive on long-end fixed income, and the market has now repriced to an outlook that we think is more hawkish than even our bullish assessment of the underlying economy would imply. That suggests current valuations may be relatively dependent on a further extension of the energy move, and if prices are instead beginning to top out, we see scope for yields to fall despite the strength of the underlying data.
The Fixed Income and Energy Complex Looks Technically Stretched
US 2y, US 30y and Brent Front Future 14d Relative Strength Index
Source: Bloomberg, Citadel Securities, data as of Sep 2026. Figures are for illustrative purposes only. Past performance does not guarantee future returns.
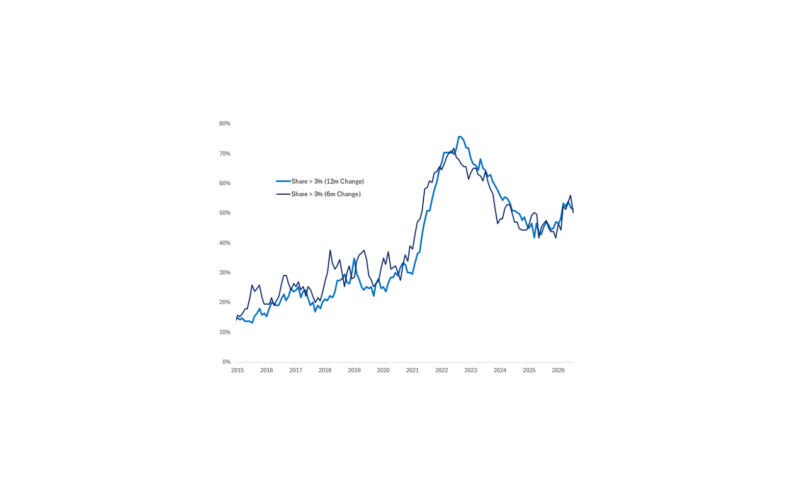
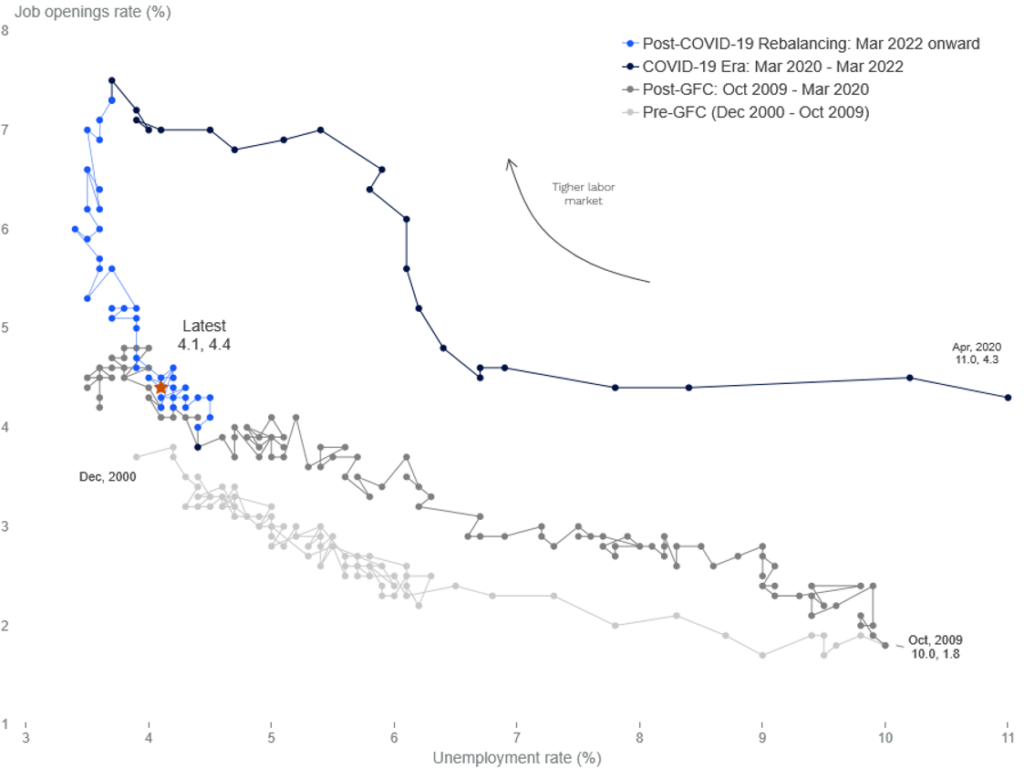
We have maintained a hawkish outlook for most of this year, but the foundations of that view have always been more fundamental and slow-moving than the energy shock alone. Back in February, when markets were still pricing two rate cuts, we set out a high-conviction view that the AI capex cycle would prove inflationary, while our 2026 outlook argued that the US labour market was likely to tighten. Our confidence in those underlying drivers of sticky inflation is higher today than it was at the start of the year for three reasons. First, the labour market has tightened across a broad range of the indicators we track: the unemployment rate has fallen to 4.1%, broad measures of hiring have accelerated, and job postings have stabilised, with a notable reacceleration across AI-exposed sectors. More importantly, some of the leading indicators of wage pressure are beginning to turn, including advertised wages for new vacancies (see chart below) and wage growth in more cyclical parts of the economy, suggesting that a further tightening in labour-market conditions would increasingly represent an upside risk to services inflation.
The Beveridge Curve has Stabilized at a Relatively Tight Equilibrium
United States Beveridge Curve, Unemployment vs Job Opening Rate
Source: Bloomberg, Citadel Securities, data as of Sep 2026. Figures are for illustrative purposes only. Past performance does not guarantee future returns.
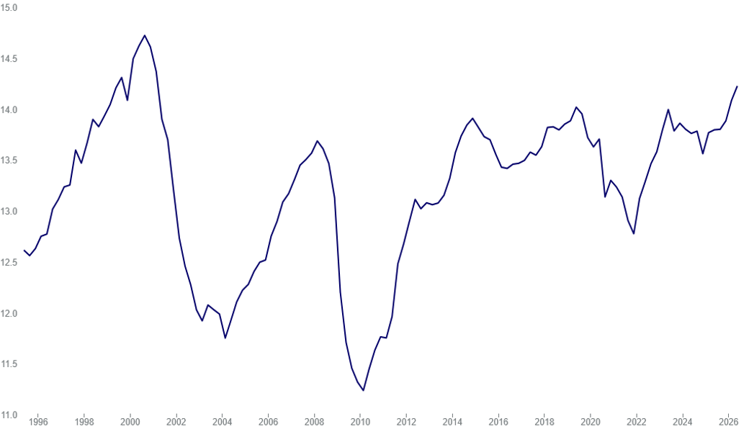
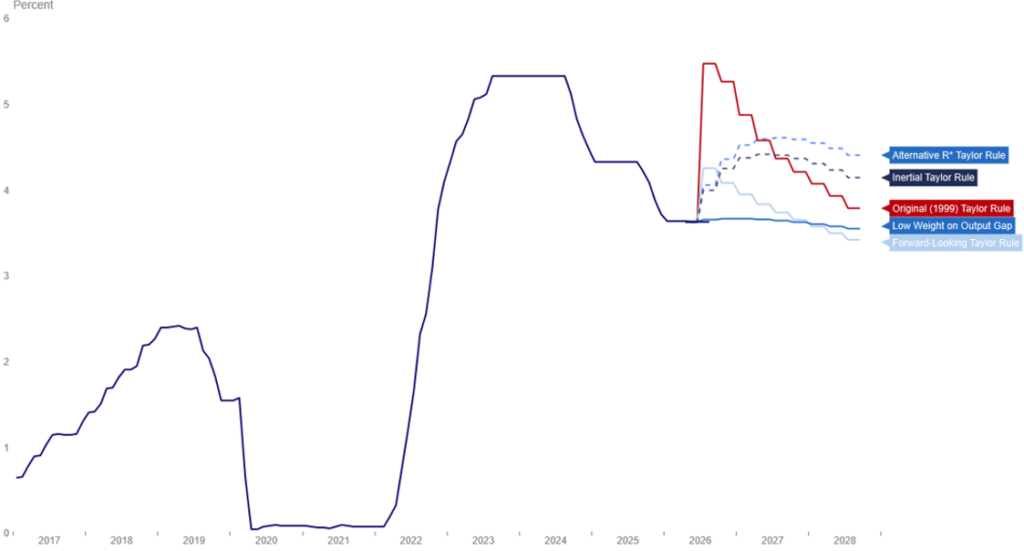
Second, there is growing evidence that the scale of AI investment is beginning to generate price pressure in some of the supply-constrained goods and inputs required to build it. US core-goods inflation remains relatively contained in aggregate, but it is no longer deflationary, with commodities excluding food and energy up 0.7% year-on-year in August and prices for computers, peripherals and smart-home assistants up 8.4% yoy, a notable shift for a category that has historically experienced persistent price declines. Governor Waller has explicitly identified pressure on technology-goods prices from the AI buildout as an upside inflation risk, while the same dynamic is increasingly visible globally: the ECB now expects competitors’ export prices to rise 7.0% in 2026, 2.8pp more than it projected in June, with the upside surprise concentrated in South Korea, Japan, the United States and China as memory-chip and related technology prices have surged. This is directionally consistent with the argument we made in February: when investment approaching $1tn a year is concentrated in a relatively narrow set of physical inputs whose supply cannot adjust at the same speed, some of the adjustment should occur through prices rather than quantities alone. Finally, the global economy has proved remarkably resilient to both the oil shock and the uncertainty emanating from the Iran conflict, which we think may partly reflect the extraordinary capital intensity of the AI cycle and the associated upward pressure on global neutral rates. Global investment as a share of GDP is now back around dot-com highs (see chart below) and, in equilibrium, a sustained increase in desired investment should raise the real rate required to attract the savings necessary to finance it. If we are right on the labour-market, goods-price and investment channels, the modal outcome is therefore one in which the eventual policy destination proves even more hawkish, however the probability attached to that outcome today should evolve with the evidence rather than be discounted in full before the mechanisms themselves have had time to play out. Furthermore – if we plug reasonable forecasts into multiple Taylor Rule specification, which have generally been hawkish relative to the realized policy path in recent years – the implied optimal policy peak is sits at 4.25%, around 25bp below market pricing. Our near-term market lean is consequently rather more nuanced: almost 100bp of tightening is now embedded in the front end even though the slower-moving fundamentals, have not moved quickly enough to justify valuations, with energy accounting for much of the incremental repricing. To the extent that the energy outlook improves, that could leave scope for yields to move lower even as the economy remains strong and the medium-term distribution of policy outcomes remains skewed in a hawkish direction, because current pricing has moved beyond what we think even a relatively hawkish reading of the underlying fundamentals can presently sustain.
US Investment is at its Highest Level Since the Dot Com Boom
US Non-Residential Fixed Investments as % of GDP
Source: Bloomberg, Citadel Securities, data as of Sep 2026. Figures are for illustrative purposes only. Past performance does not guarantee future returns
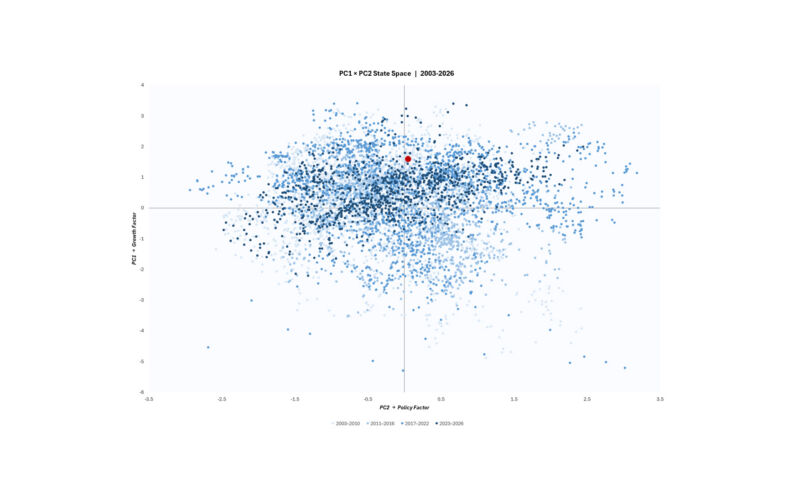
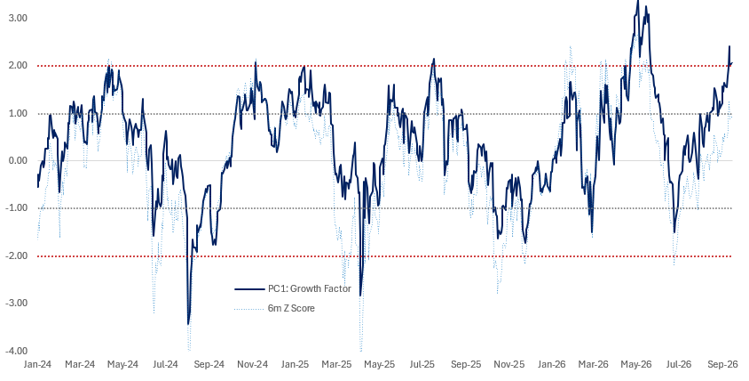
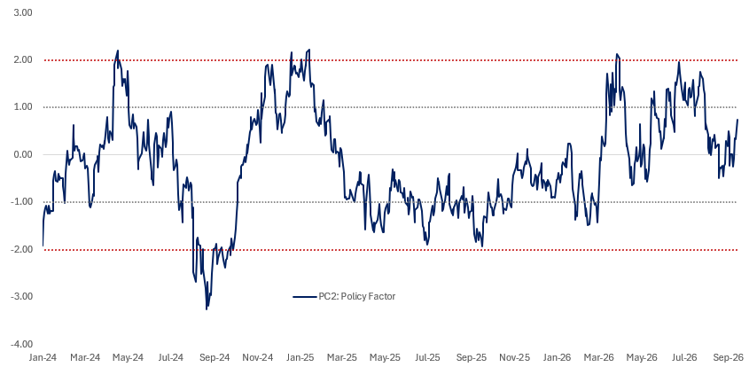
Finally, we note that the cross-asset repricing we have seen across markets shows up as mostly growth-driven in our cross-asset macro framework, with the recent rise in yields being identified predominantly as part of a positive growth shock rather than a hawkish policy shock. Our growth factor is now above +2σ and at one of the more extended levels of the past few years, which suggests that a considerable amount of optimism around the growth impulse, including the extraordinary AI capex cycle, is already embedded in asset prices. The economy remains strong, but expectations have moved further than the underlying level of activity, leaving a progressively higher hurdle for positive surprises and correspondingly greater scope for mean reversion. Historically, when the growth factor has reached similarly elevated levels, mean reversion has tended to come disproportionately through lower yields rather than materially weaker equities. The policy factor in our cross-asset decomposition has tightened but still sits around +1σ, largely because equity-market resilience has led the framework to interpret the recent moves as more consistent with a positive growth shock than a hawkish policy shock. That feels somewhat counter-intuitive in the context of an energy shock, but it also suggests that the current combination of equity and fixed-income valuations may become increasingly difficult to sustain.
Our PCA Growth Factor is Elevated
PC1 Growth Factor and its Z-Score, FCI Decomposition
Source: Bloomberg, Citadel Securities, data as of Sep 2026. Figures are for illustrative purposes only. Past performance does not guarantee future returns.
Our PCA Policy Factor has Tightened Moderately
PC2 Growth Factor, FCI Decomposition
Source: Bloomberg, Citadel Securities, data as of Sep 2026. Figures are for illustrative purposes only. Past performance does not guarantee future returns.
Most Taylor Rules Imply a Similar Policy Path to Market Pricing
Monetary Policy Rules based on CBO Forecasts, Q3 2026
Source: Bloomberg, Citadel Securities, data as of Sep 2026. Figures are for illustrative purposes only. Past performance does not guarantee future returns.
Copyright © Citadel Enterprise Americas LLC or one of its affiliates. All rights reserved.
Legal Entities Disseminating this Material: This material is disseminated in the United Kingdom by Citadel Securities (Europe) Limited (“CDGE”) authorized and regulated by the Financial Conduct Authority (“FCA”) (Registered company number: 05462867); in the European Union by Citadel Securities GCS (Ireland) Limited (“CSGI”) and its Paris Branch authorized and regulated by the Central Bank of Ireland (“CBI”) (Registration Number: C173437); in Hong Kong by Citadel Securities (Hong Kong) Limited (“CDHK”) licensed by the Securities and Futures Commission of Hong Kong (“SFC”), in Japan by Citadel Securities Japan Co., Ltd (“CSJC”) registered as a Type 1 financial instruments business operator with the Japan Financial Services Agency (“JFSA”); and in the United States of America by Citadel Securities LLC (“CDRG”) registered with the Securities Exchange Commission (“SEC”), Financial Industry Regulatory Authority (“FINRA”), and Securities Investor Protection Corporation (“SIPC”), Citadel Securities Institutional LLC (“CSIN”) registered with the SEC, FINRA, and SIPC, or Citadel Securities Swap Dealer LLC (“CSSD”) registered with the SEC, Commodities Futures Trading Commission (“CFTC”), and National Futures Association (“NFA”). Unless governing law permits otherwise, you must contact a Citadel Securities entity in your home jurisdiction if you want to use our services in effecting a transaction in any financial instruments or securities, including derivatives.
FOR INSTITUTIONAL USE ONLY; FOR PROFESSIONAL CLIENTS AND ELIGIBLE COUNTERPARTIES ONLY. This material is not intended as and does not constitute investment research. Contents of this material will be strictly limited to non-specific, generic information (i.e. macro events/topics) and are not subject to the Markets in Financial Instruments directive (MiFID II) or FINRA research rules. This material does not constitute an offer, solicitation, invitation, or inducement to purchase, acquire, subscribe to, provide, or sell any financial instrument or otherwise engage in investment activity. Please see additional important disclosures, including disclosures that may be relevant to your country of residence or business at www.citadelsecurities.com/GlobalSalesTrading.