We are turning more constructive on US equities into Q4.
September delivered much of the reset we wanted to see. Positioning and leverage came down. Retail activity cooled. Systematics sold. Valuations compressed. The market enters Q4 from a cleaner starting point, with considerably more capacity to rebuild exposure.
Now the setup begins to change. Earnings return to the center of the conversation. Corporate buyback windows begin to reopen. Retail has historically re-engaged in October. Systematic positioning is now below neutral.
There is still plenty of stress beneath the surface. The S&P 500 sits near all-time highs while the average stock has struggled. But that divergence highlights one of the most important features of this market: the stock market is not the economy, and increasingly, the S&P 500 is not the average stock.
We are not expecting a straight line higher. October could still bring volatility and a better entry point. But positioning is cleaner, valuations are lower, earnings are returning, and several of the market’s largest buyers have considerably more capacity to participate.
September was the reset. Q4 is the reload.

1. The S&P 500 is Not the Average Stock
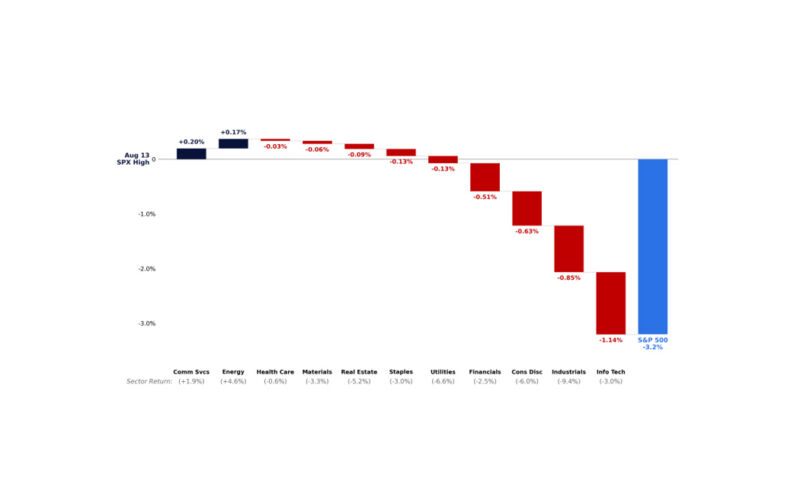
The S&P 500 is only ~2% below its all-time high, even as weakness has spread across the market.
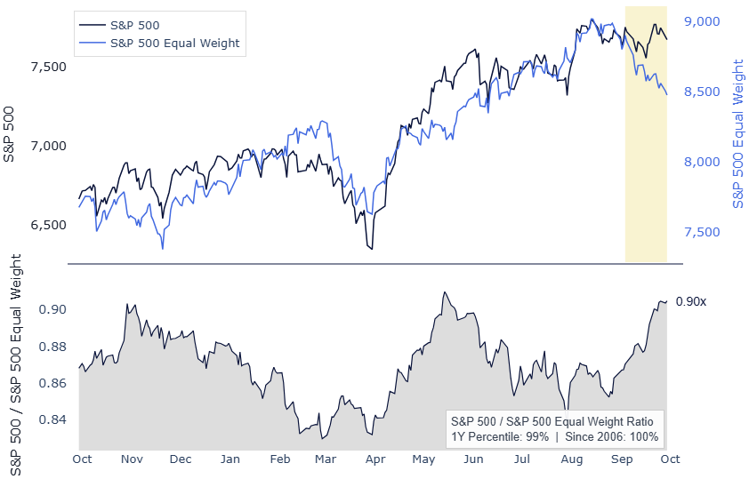
The S&P 500 gained 2% in Q3, while the S&P 500 Equal Weight fell 2%, the Russell 2000 fell 7%, and Semis fell 11%. The Mag 7, meanwhile, gained 11%.
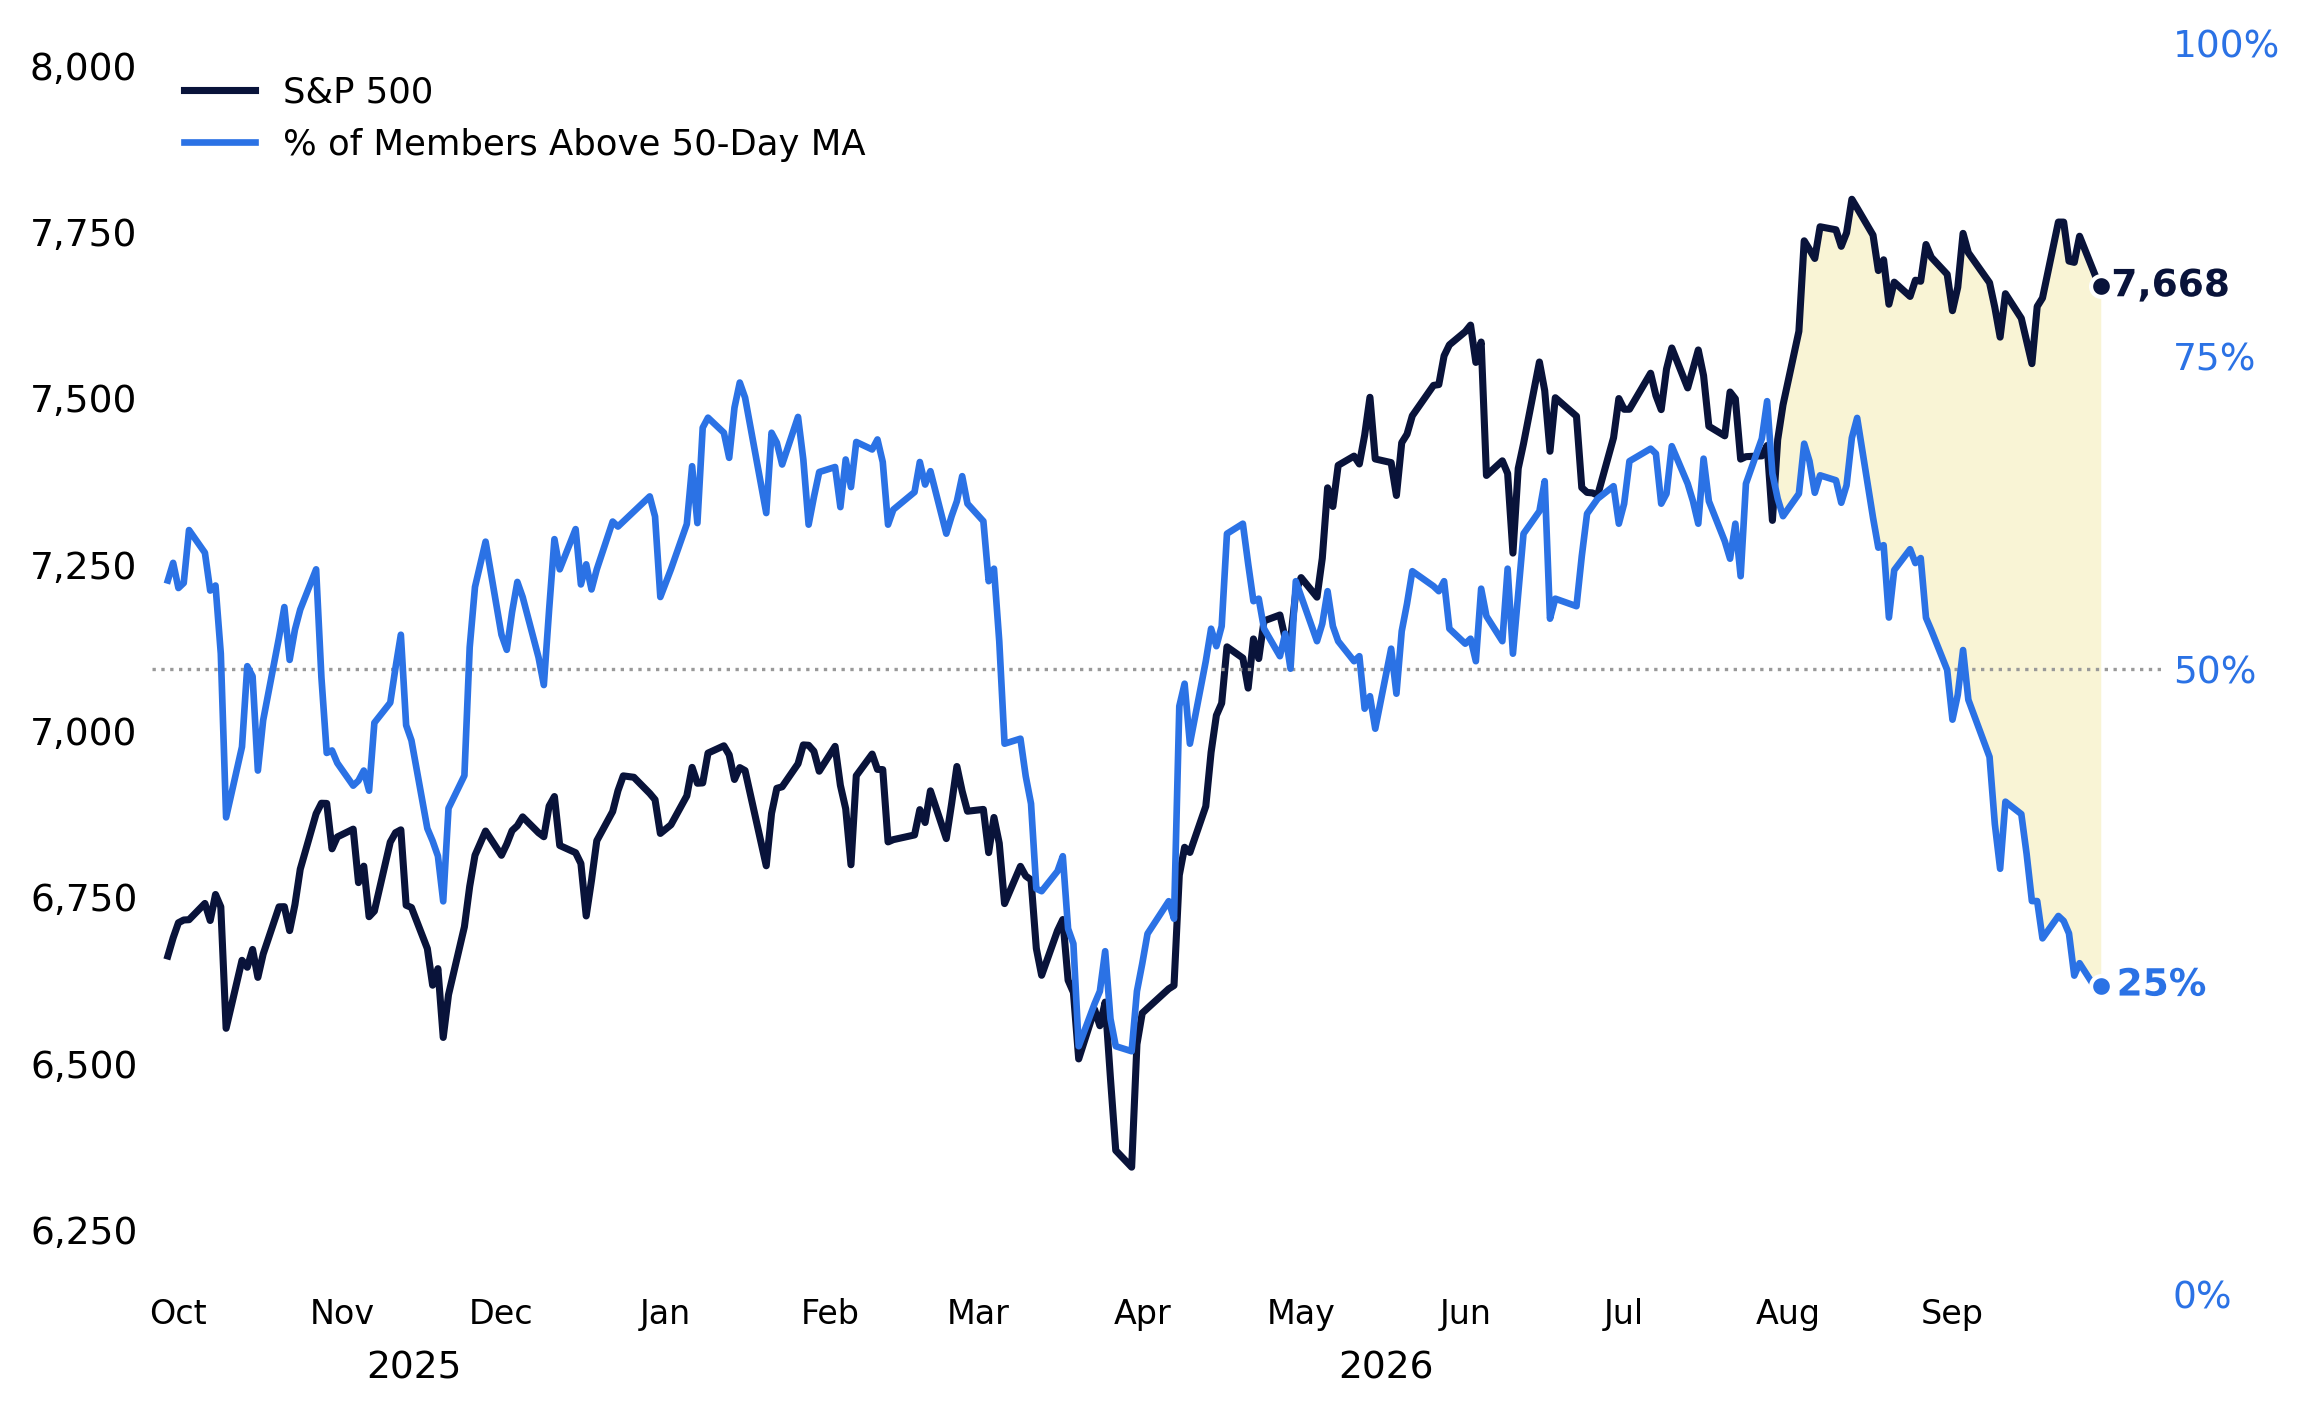
Just 25% of S&P 500 constituents are currently trading above their 50-day moving average.
The S&P 500 / Equal Weight ratio has moved back toward the highest levels of the past several years, as the largest companies continue to drive an outsized share of the index’s returns.
Here is the statistic that best captures the divergence:
MSFT, NVDA, AAPL and META alone contributed roughly 300 points to the S&P 500 in Q3, or more than 200% of the index’s entire gain. The rest of the index collectively detracted roughly 150 points.
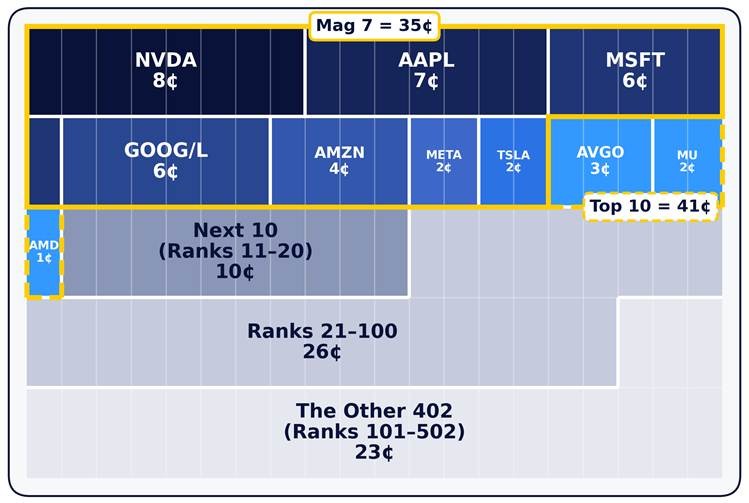
For every $1 allocated to the S&P 500 Index:
- 41¢ goes to the top 10 companies.
- 35¢ goes to the Mag 7 alone.
- 19¢ goes to Semiconductors.
- NVDA alone receives roughly 8¢, more than the smallest 256 companies combined.
This concentration matters even more when ETF flows are running at a record pace.
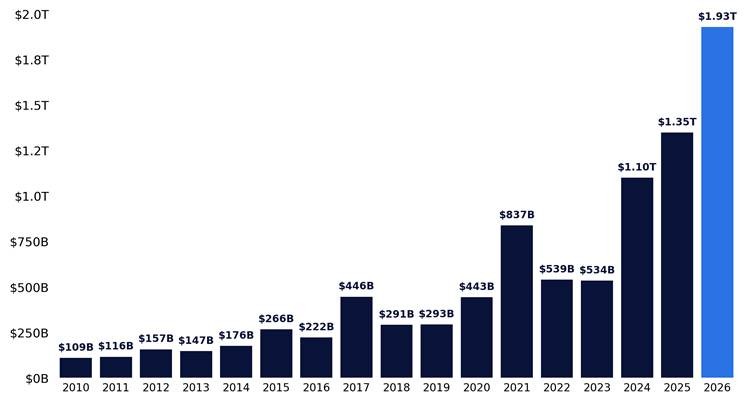
US ETF inflows have reached $1.9 trillion YTD, already 43% ahead of last year’s record pace.
Q3 alone brought $771 billion of ETF inflows, the largest quarter on record.
Historically, Q4 has been the strongest part of the calendar for ETF flows and model-based rebalancing.
None of this means the weakness underneath the index does not matter. It does. But the hurdle for the S&P 500 is very different from the hurdle for the average stock.
When 10 companies represent roughly 40% of the index, four stocks can contribute more than 100% of a quarter’s return, and ETF inflows are running at a record pace, the S&P 500 can continue to work without broad participation. This concentration has been particularly visible during the recent global bond selloff, as the largest index weights have shown remarkably little sensitivity to the move higher in yields.
That is the key distinction: the average stock can struggle while the S&P 500 continues to move higher.
2. Back to Fundamentals
Earnings are about to move back to the center of the conversation, with estimates still moving higher and valuations meaningfully lower.
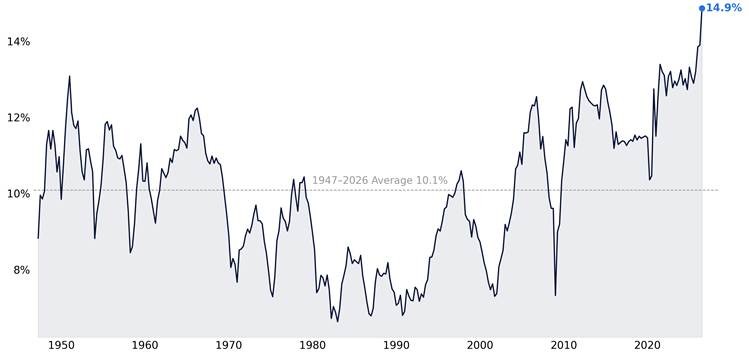
US corporate profits rose 22.8% year-over-year in Q2 to a record $4.83 trillion, the largest annual increase since Q4 2021. Profit growth has now accelerated for four consecutive quarters, while nominal GDP grew 6.6% over the same year.
Corporate profits now represent 14.9% of GDP, the highest share on record going back to 1947, and well above the 10.1% long-term average.
That strength is showing up again heading into Q3 earnings.
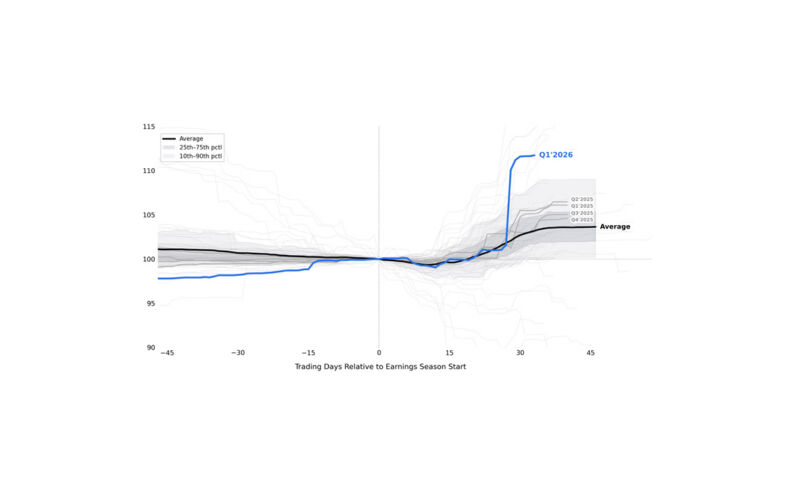
S&P 500 Q3 EPS estimates have increased 2.2% over the past two months, versus a median 1.9% decline over the same pre-earnings window since 2000. Only a quarter of earnings seasons have seen estimates rise at all. This is also the fifth consecutive quarter of pre-season upgrades.
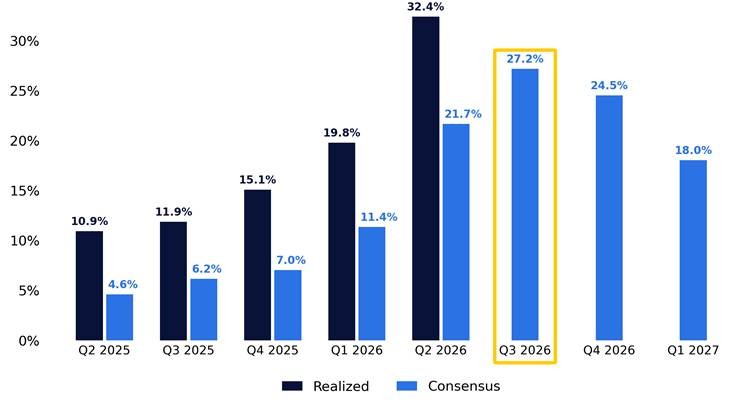
Consensus now calls for 27% year-over-year EPS growth in Q3. That follows 20% growth in Q1 versus an 11% bar and 32% in Q2 versus a 22% bar, adjusting for one-offs.
The story in 2026 has not been a low bar. Expectations have moved higher, and companies have continued to clear them by a wide margin.
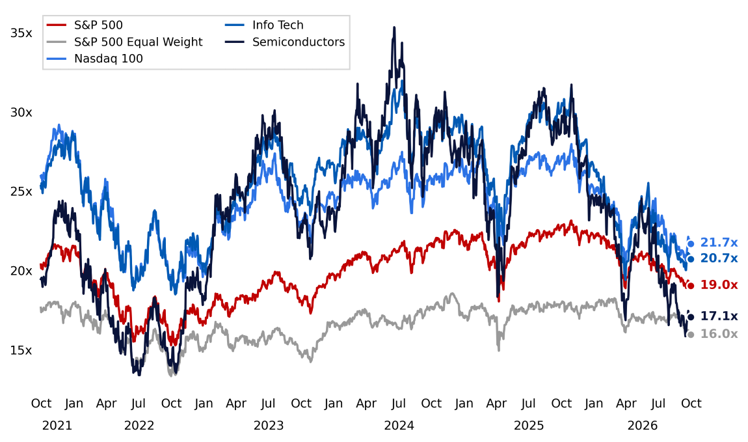
The earnings bar has moved higher. Valuations have moved lower.
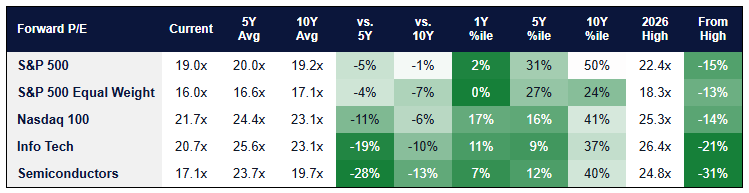
The S&P 500 trades at 19.0x forward earnings, 15% below its 2026 high and essentially in line with its 10-year average. The reset has been considerably larger across the growth complex:
- Nasdaq 100: 21.7x, down 14% from its 2026 high.
- Information Technology: 20.7x, down 21%.
- Semiconductors: 17.1x, down 31% and now trading below the S&P 500.
- S&P 500 Equal Weight: 16.0x, down 13%.
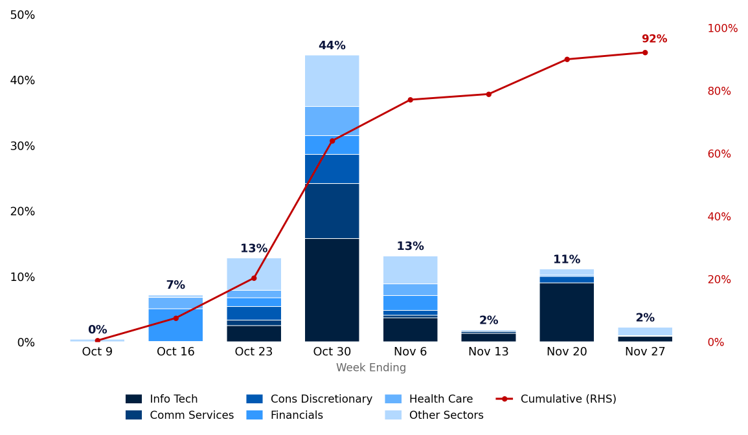
The Super Bowl of Q3 earnings comes in the final week of October, when roughly 44% of the S&P 500 and 38% of the Nasdaq 100 report. By the end of that week, nearly two-thirds of the S&P 500 will have reported, rising to 92% by late November.
3. Back to a Stock Picker’s Market
The market is moving from macro back to micro. Oil, rates, and geopolitics dominated the conversation in September. Earnings and company-specific fundamentals are about to take back the calendar.
More than half of the S&P 500 will report earnings in a two-week window, bringing company-specific catalysts back to the center of the tape just as single-stock volatility and realized dispersion have reset from their summer extremes.
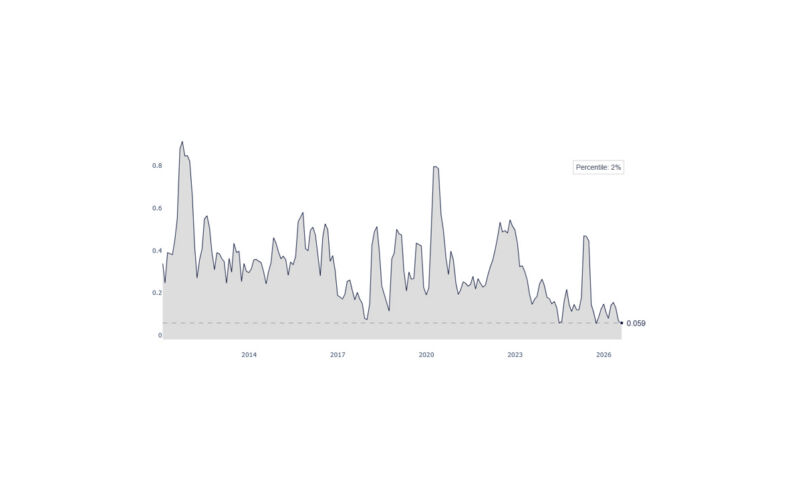
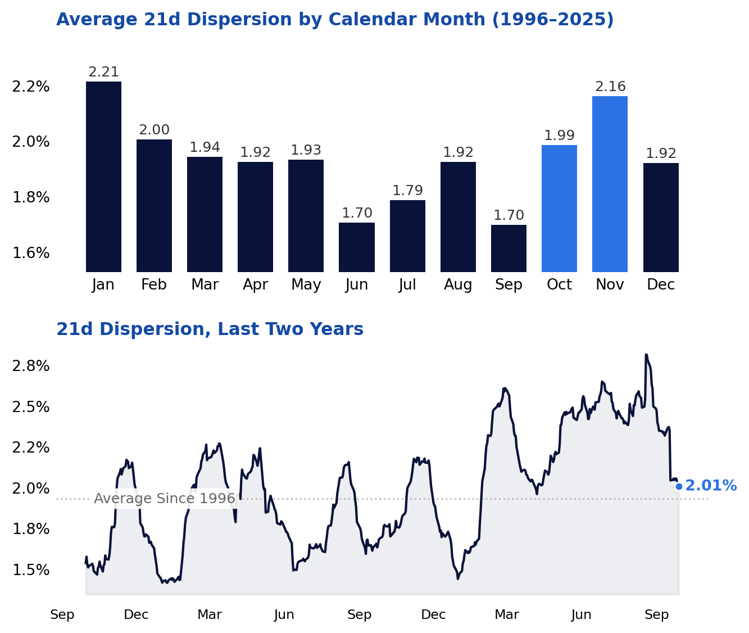
The average S&P 500 constituent now trades at roughly 33% one-month implied volatility versus just 12% for the index. The spread between the two is back around its one-year average after reaching historically elevated levels in July.
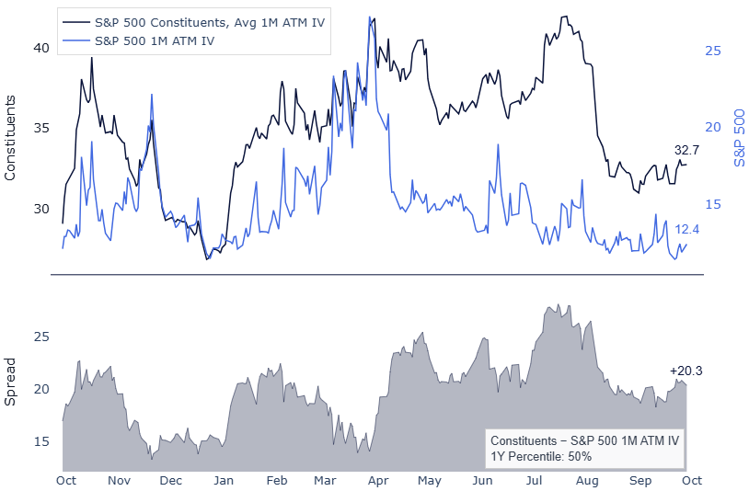
Realized dispersion has followed a similar path, falling from nearly 2.8% in August to roughly 2.0% today, almost exactly in line with its long-term average.
September has also historically been the low point for dispersion before levels begin to pick back up through October and November alongside earnings and year-end flows. That is the opportunity. Index volatility has normalized, but the opportunity set underneath the index remains considerably richer.
After a year dominated by macro shocks, AI narratives, and powerful rotations, earnings now put individual companies back in control of the next move. Q4 should increasingly be about what you own, not simply whether you own the index.
4. The Buyers Come Back
This is the part of the Q4 setup that matters most to us.
Several of the market’s largest marginal buyers pulled back through September. They now enter Q4 with considerably more room to add.
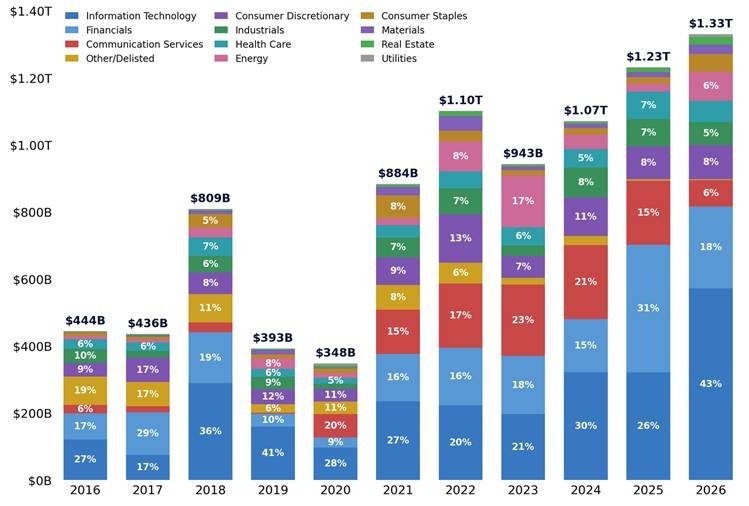
Corporates are still largely in their Q3 earnings blackout, but the buyback window begins to reopen on October 15. From there, the corporate bid should build through earnings season and accelerate into November, historically the strongest month of the year for corporate buyback executions.
US corporates have authorized $1.3 trillion of buybacks through September 29, the largest amount on record at this point in the year and 8% ahead of 2025’s record pace.
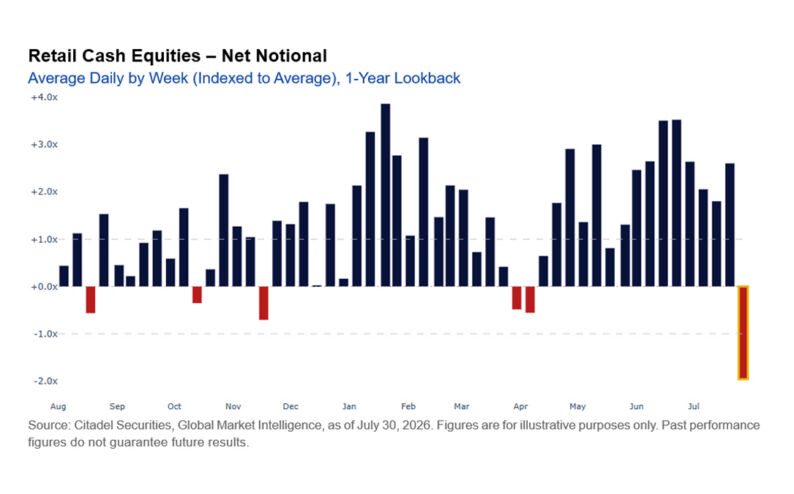
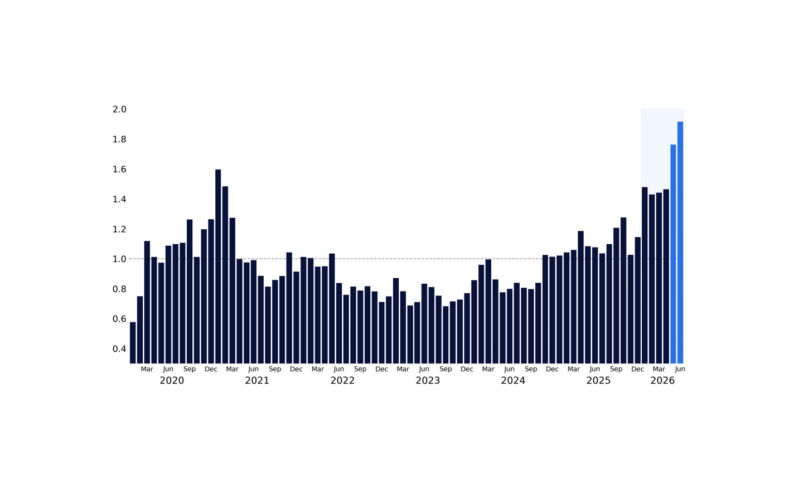
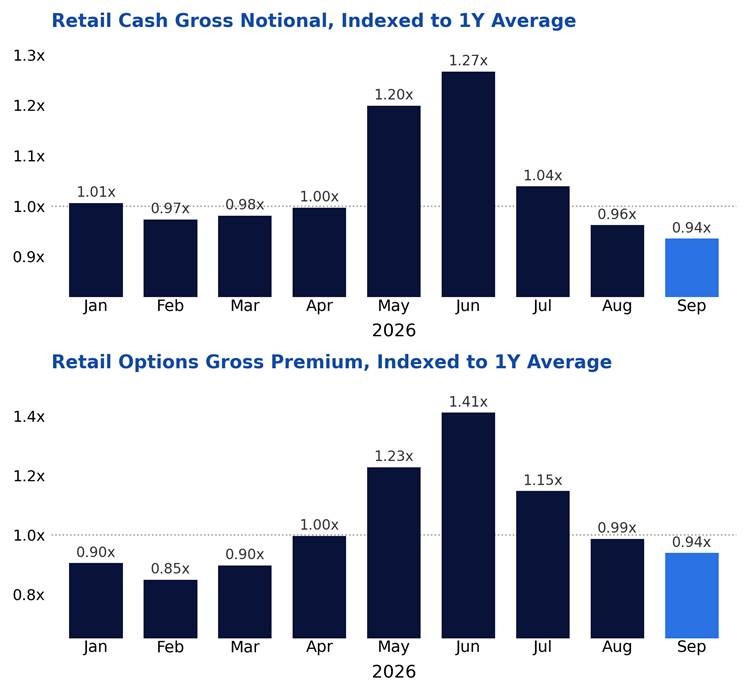
Retail: Activity reset sharply from the summer highs. September cash turnover fell to 0.94x its trailing one-year average, the lowest level of 2026, while retail options premium also fell to 0.94x after reaching 1.41x in June. Cash activity is now 26% below the June peak, while options premium is roughly one-third lower.
That slowdown has historically tended to reverse in October. Cash activity has increased from September to October in each of the last four years, by an average of ~8%, while options activity has risen in each of the last three, by an average of ~15%.
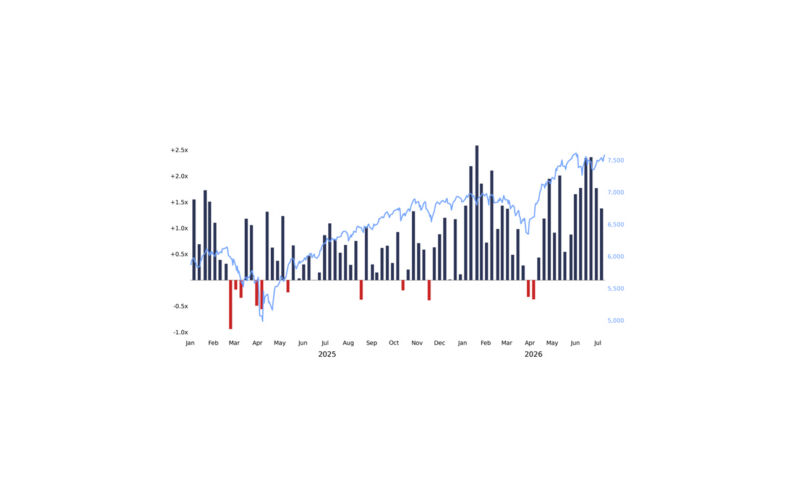
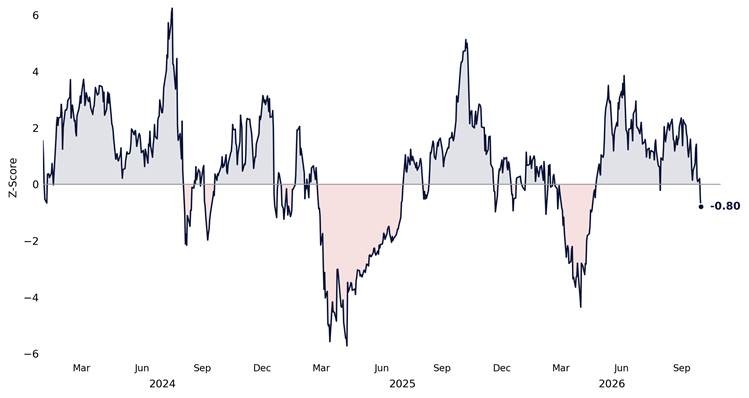
Systematics: They have already sold. US equity CTA positioning moved from +2.35 standard deviations at the end of August to -0.80 today, a more than 3-sigma swing in one month. Positioning is now in the bottom fifth of its range since 2024 and below neutral for the first time since the April rebuild.
The flow asymmetry has flipped.
Corporates have record authorized capital waiting for open windows. Retail has reset from the summer highs. CTAs have moved from crowded long to below neutral.
Several of the equity market’s largest buyers enter Q4 with significant capacity to add exposure. If equities stabilize and trends improve, the marginal buyer increasingly lives higher into year-end.
5. The Calendar Flips
The seasonal backdrop is turning from a headwind into a tailwind.
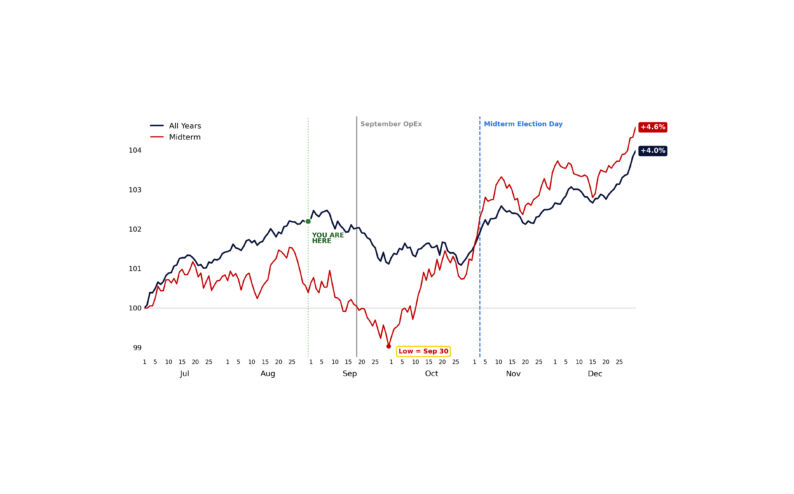
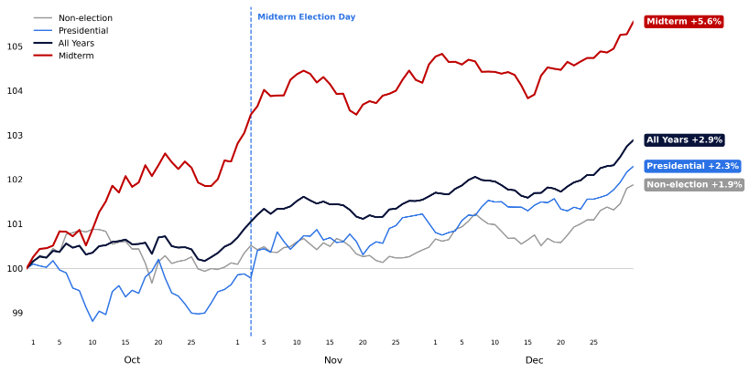
Since 1930, the S&P 500 has gained an average of 5.6% in Q4 during midterm years, nearly twice the 2.9% average across all years.
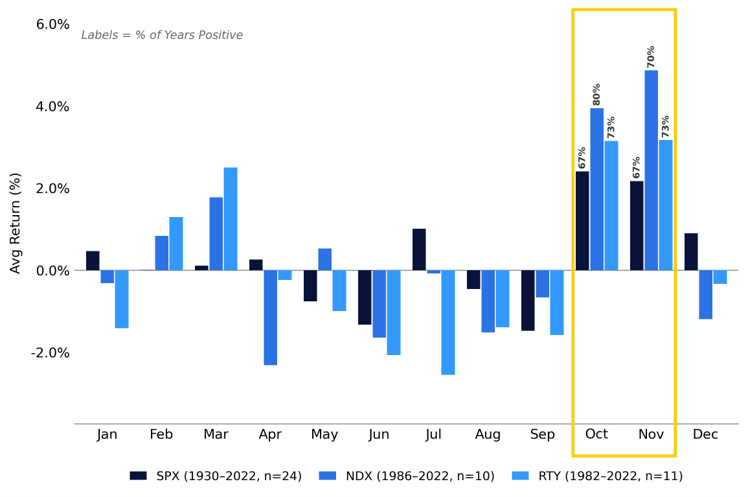
October and November have historically been the two strongest months of the midterm calendar.
Average returns during midterm years:
- S&P 500: October +2.4%, November +2.2%.
- Nasdaq 100: October +3.9%, November +4.9%.
- Russell 2000: October +3.1%, November +3.2%.
But the path matters.
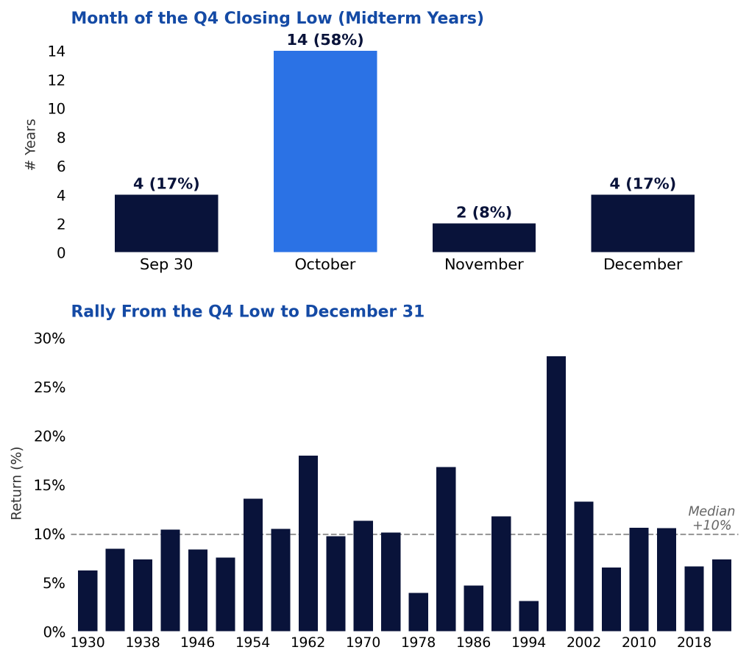
The Q4 low has been set in October in 14 of 24 midterm years since 1930, or 58% of the sample. From that Q4 low, the median rally into year-end has been +10%.
That is an important distinction. A constructive Q4 setup does not necessarily mean a clean start to October. Historically, October has often provided the volatility and the entry point before the stronger part of the year-end move.
That is how we are thinking about the next several weeks. We are constructive into Q4, but we are not expecting a straight line higher.
If October gives us weakness, history suggests that may be part of the Q4 opportunity rather than the end of it.
GMI Bottom Line
We are turning more constructive on US equities into Q4.
September delivered much of the reset we wanted to see. Leverage came down. Retail cooled. CTA positioning moved below neutral. Valuations compressed. The market enters Q4 cleaner, less crowded, and with more capacity to rebuild exposure.
Now the setup turns. Earnings move back to the center of the calendar. Corporate buyback windows begin to reopen. Retail has room to re-engage. CTAs have meaningful exposure to rebuild. And the calendar becomes considerably more favorable.
September took leverage and positioning out. Q4 brings earnings, catalysts, and buyers back in.
We are not expecting a straight line higher. October has often been where the Q4 low is set during midterm years, so there may still be some work to do. But we increasingly view weakness early in the quarter as an opportunity rather than a reason to step away.
We would use that weakness to add to core longs, with a preference for single names where positioning has reset and earnings can drive the next move.
September was the reset. Q4 is the reload.
Copyright © Citadel Enterprise Americas LLC or one of its affiliates. All rights reserved.
Legal Entities Disseminating this Material: This material is disseminated in the United Kingdom by Citadel Securities (Europe) Limited (“CDGE”) authorized and regulated by the Financial Conduct Authority (“FCA”) (Registered company number: 05462867); in the European Union by Citadel Securities GCS (Ireland) Limited (“CSGI”) and its Paris Branch authorized and regulated by the Central Bank of Ireland (“CBI”) (Registration Number: C173437); in Hong Kong by Citadel Securities (Hong Kong) Limited (“CDHK”) licensed by the Securities and Futures Commission of Hong Kong (“SFC”), in Japan by Citadel Securities Japan Co., Ltd (“CSJC”) registered as a Type 1 financial instruments business operator with the Japan Financial Services Agency (“JFSA”); and in the United States of America by Citadel Securities LLC (“CDRG”) registered with the Securities Exchange Commission (“SEC”), Financial Industry Regulatory Authority (“FINRA”), and Securities Investor Protection Corporation (“SIPC”), Citadel Securities Institutional LLC (“CSIN”) registered with the SEC, FINRA, and SIPC, or Citadel Securities Swap Dealer LLC (“CSSD”) registered with the SEC, Commodities Futures Trading Commission (“CFTC”), and National Futures Association (“NFA”). Unless governing law permits otherwise, you must contact a Citadel Securities entity in your home jurisdiction if you want to use our services in effecting a transaction in any financial instruments or securities, including derivatives.
FOR INSTITUTIONAL USE ONLY; FOR PROFESSIONAL CLIENTS AND ELIGIBLE COUNTERPARTIES ONLY. This material is not intended as and does not constitute investment research. Contents of this material will be strictly limited to non-specific, generic information (i.e. macro events/topics) and are not subject to the Markets in Financial Instruments directive (MiFID II) or FINRA research rules. This material does not constitute an offer, solicitation, invitation, or inducement to purchase, acquire, subscribe to, provide, or sell any financial instrument or otherwise engage in investment activity. Please see additional important disclosures, including disclosures that may be relevant to your country of residence or business at www.citadelsecurities.com/GlobalSalesTrading.