Positioning Has Normalized. Fundamentals Matter Again.
I wasn’t planning to send an update today, but after receiving a number of client questions over the weekend regarding market risk, I thought it would be helpful to share our latest thinking more broadly.
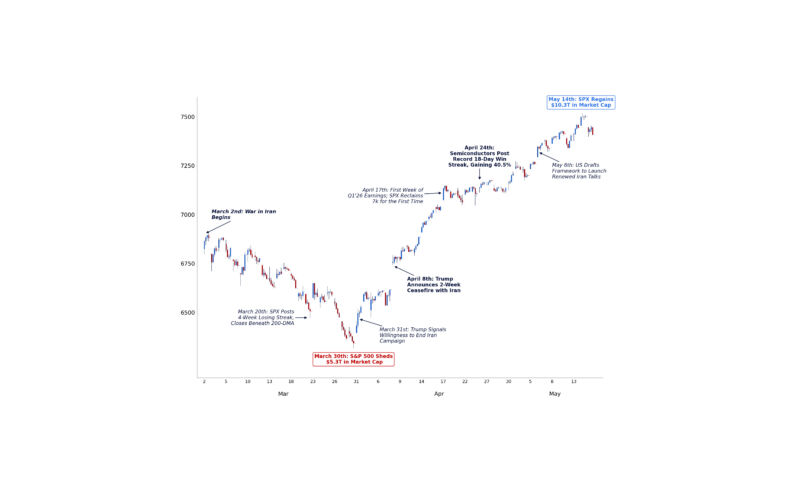
It has also been one of the most technically challenging trading environments we have navigated in recent years. Sharp rotations, elevated single-stock volatility, rapidly changing market leadership, and significant deleveraging created an exceptionally difficult backdrop for investors across the marketplace.
Today, we believe much of the global technical reset is behind us. Importantly, the reset occurred through rotation, deleveraging, and stronger fundamentals, not through a deterioration in the macroeconomic backdrop.
The excesses that defined the early summer have largely been unwound. Retail investors reduced risk, leverage normalized, market concentration declined, and many of the market’s largest technical headwinds have begun to fade. As a result, we believe investors can increasingly spend less time focused on positioning and more time focused on fundamentals. Position sizes and risk budgets are likely to rebuild gradually, supporting a lower volatility grind higher rather than the type of V-shaped recovery experienced earlier this year.
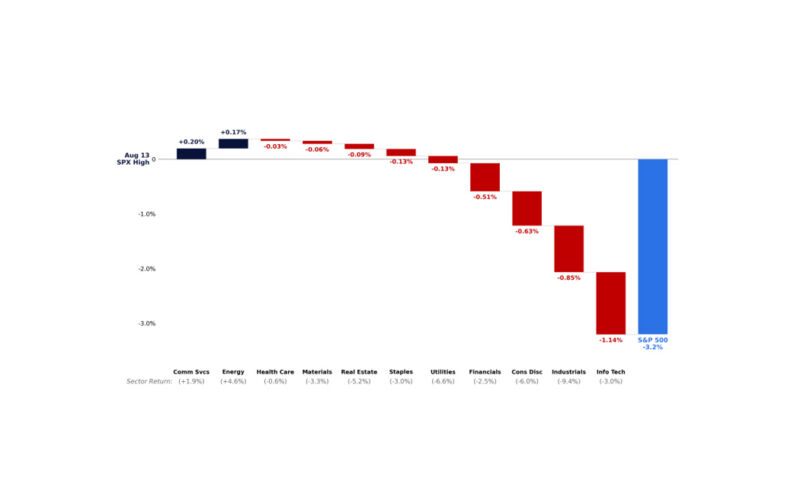
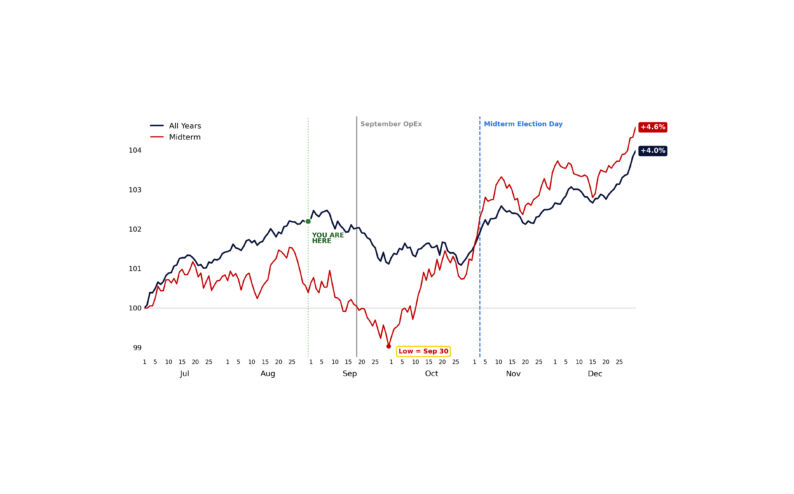
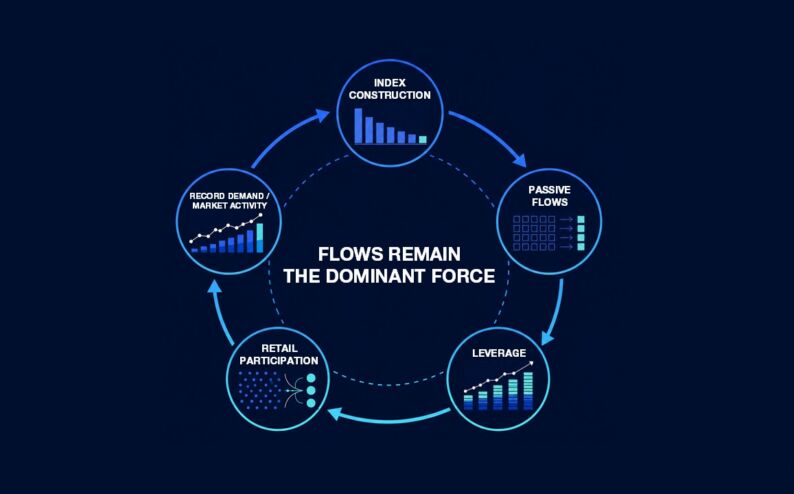
The long-term structural themes driving this market, including retail participation, passive ownership, corporate demand, and the continued evolution of market structure, remain firmly intact. What has changed is the technical backdrop. In our view, July likely pulled forward much of the typical August weakness. Despite the recent volatility, the S&P 500 sits just 150 bps below all-time highs, while the average equal-weighted stock is within roughly 1% of its own high.
July did not change the structural bull market. It reset it.

I. Retail Behavior Shifted Meaningfully
The defining feature of July was not lower retail participation; it was a meaningful shift in retail behavior.
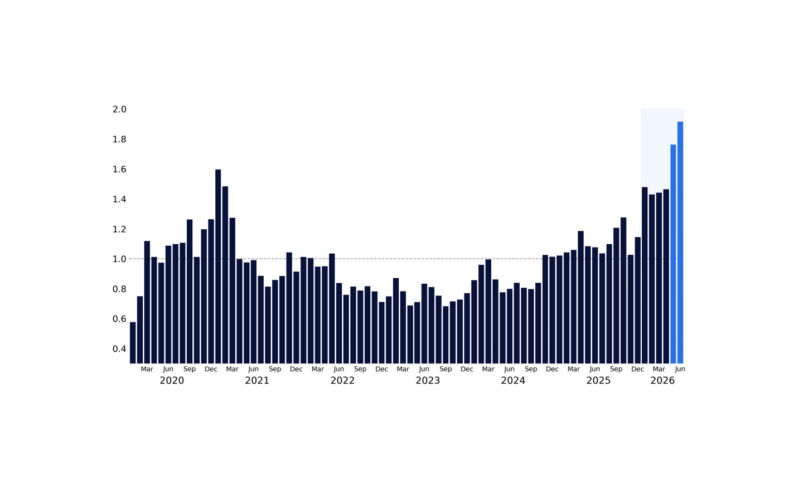
Following the record retail activity observed during May and June, trading activity moderated during July. Average daily retail cash equity volumes declined roughly 20% from June’s record highs, but activity remained exceptionally elevated, on pace to rank as the 4th most active month in our platform’s history and still above the levels observed during January’s rally.
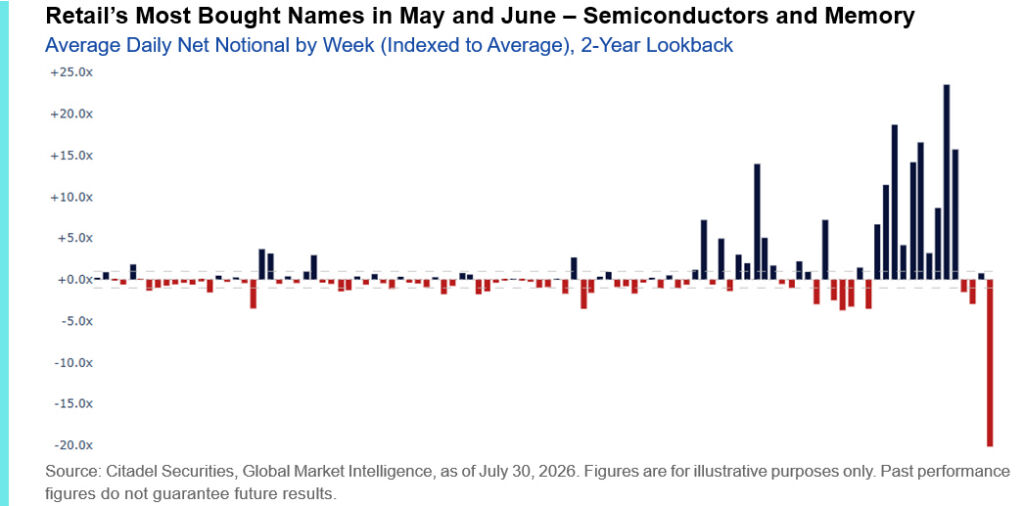
While volumes normalized from the extremes of the prior two months, retail investor behavior changed materially over the course of July. As many of retail’s highest-conviction AI positions continued to weaken, investors increasingly shifted from buying weakness to reducing exposure. That transition accelerated into the final week of the month, culminating in what is now on pace to be the largest week of retail equity selling since 2022.
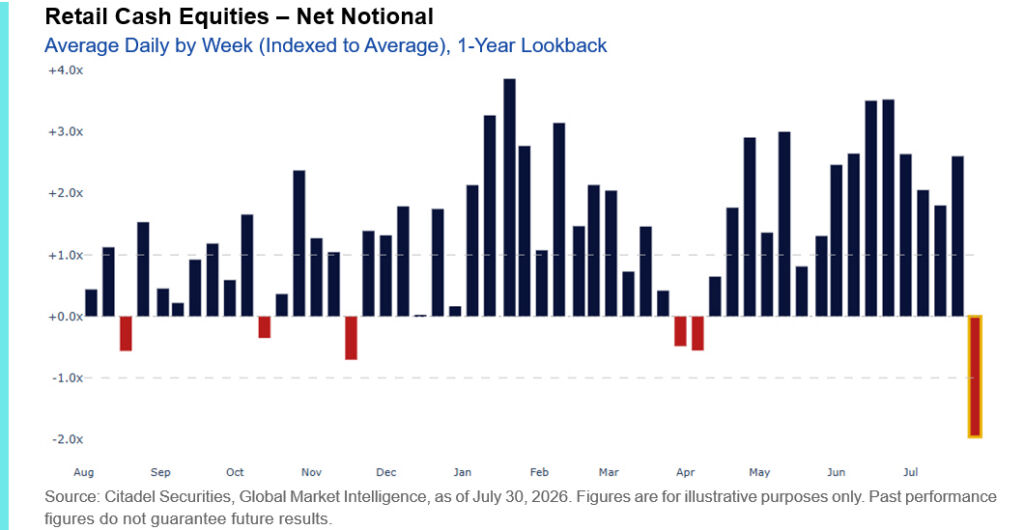
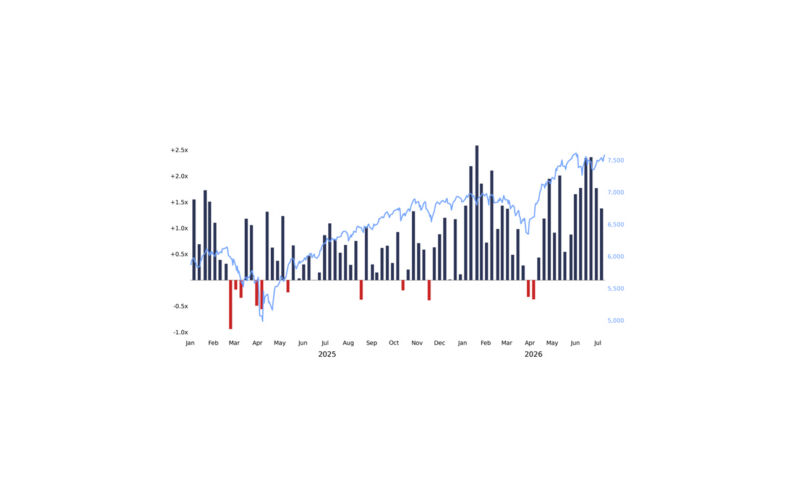
Retail investors have been net sellers every day this week. Four consecutive sessions of net outflows marked the longest selling streak this year, with average daily net notional running nearly 2x larger than the last comparable episode in November 2025.
The selling was most pronounced in Technology, where investors sold more notional this week than during any other week in our dataset (since January 2019), exceeding the previous record by more than 80%. Two of the three largest retail Tech sell days ever observed on our platform occurred this week alone.
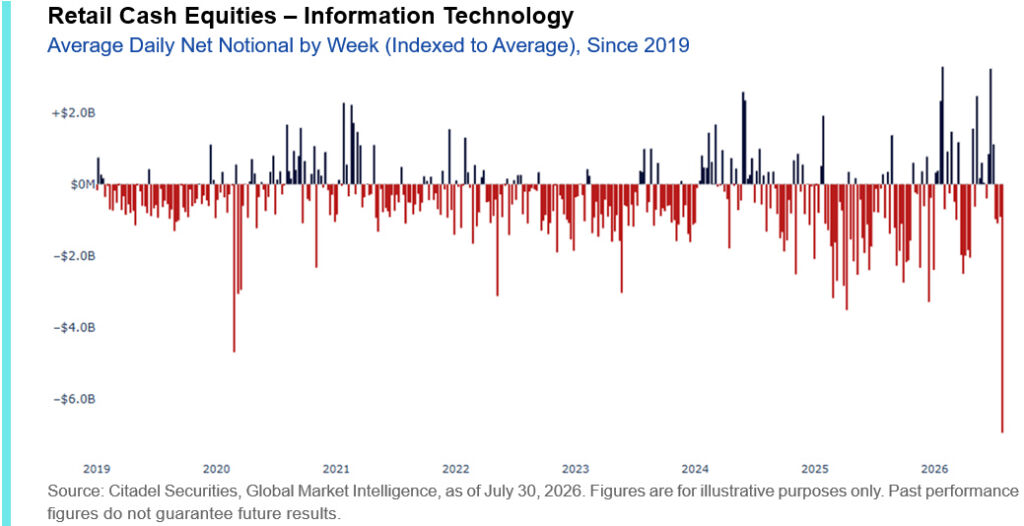
Within Technology, selling was overwhelmingly concentrated in the semiconductor and memory names that retail accumulated most aggressively during May and June. Average daily net selling across these stocks exceeded the previous record by more than 5x.
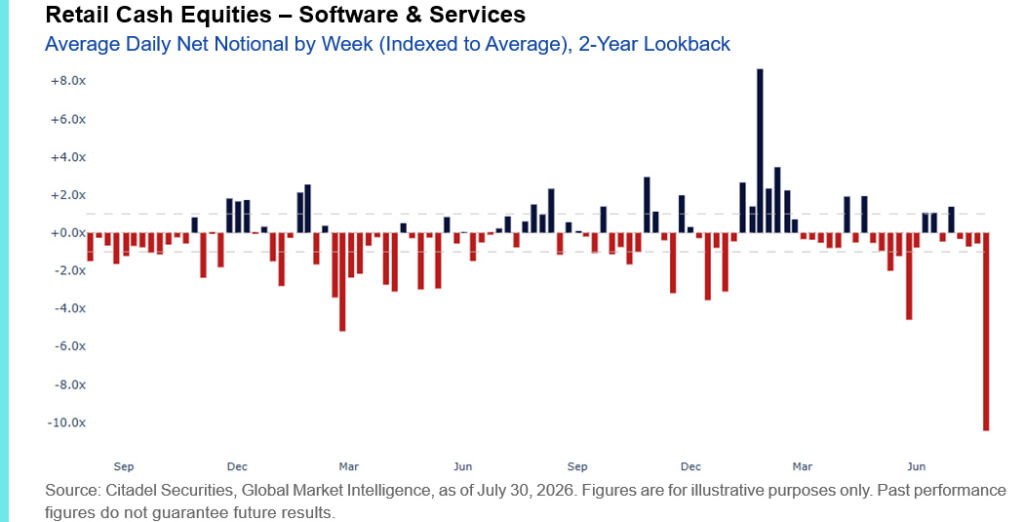
On Thursday’s bounce, retail continued to sell – more typical behavior given retail’s historical tendency to buy dips and sell rallies. Software drove the outflows, recording the largest one-day retail liquidation in the sector ever observed on our platform. Average daily net selling in software this week is now more than 2x larger than the previous weekly record.
II. Leverage has Moderated
Retail selling did more than reduce positioning. It accelerated one of the fastest deleveraging episodes of the year. July’s deleveraging removed many of those excesses, leaving positioning considerably cleaner than it was at the start of the month.
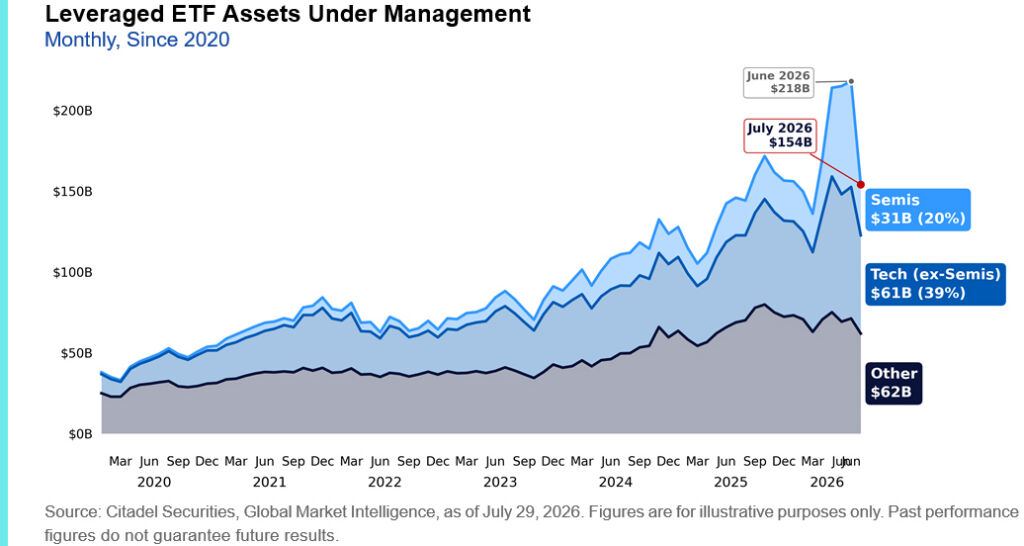
Leveraged ETF assets have declined more than $60 billion from their June peak, removing one of the largest sources of incremental leverage that had fueled the first-half rally. The largest reductions have occurred across the market’s most crowded themes, with Technology leveraged ETF assets down approximately 40% and Semiconductor assets down nearly 55% over the past month.
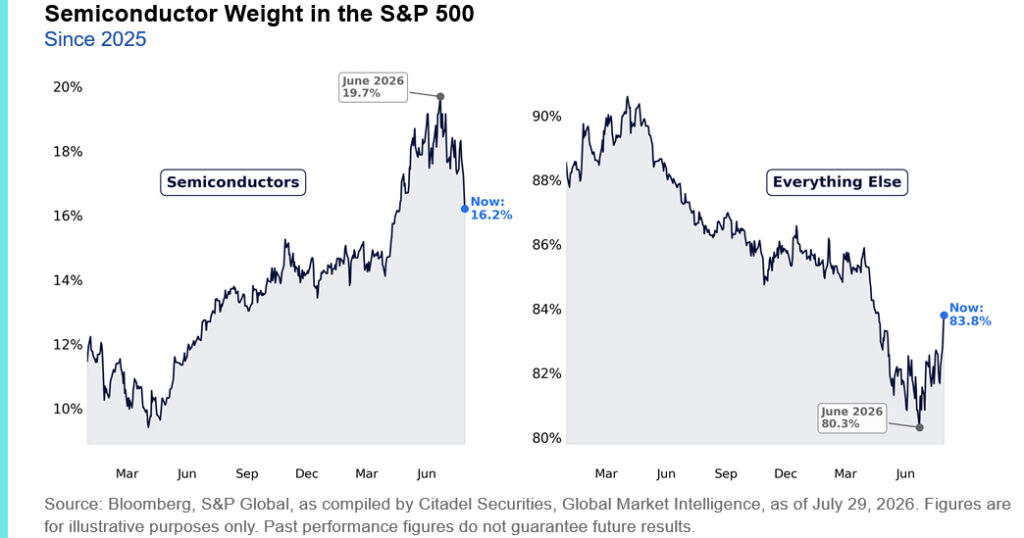
The reduction in leverage coincided with a meaningful decline in market concentration. Semiconductor companies in the S&P 500 have collectively lost roughly $1.5 trillion in market capitalization, reducing the industry’s weight in the S&P 500 from nearly 20% to 16%. Broad indices did an excellent job to mask material volatility under the hood, with the average stock near records.
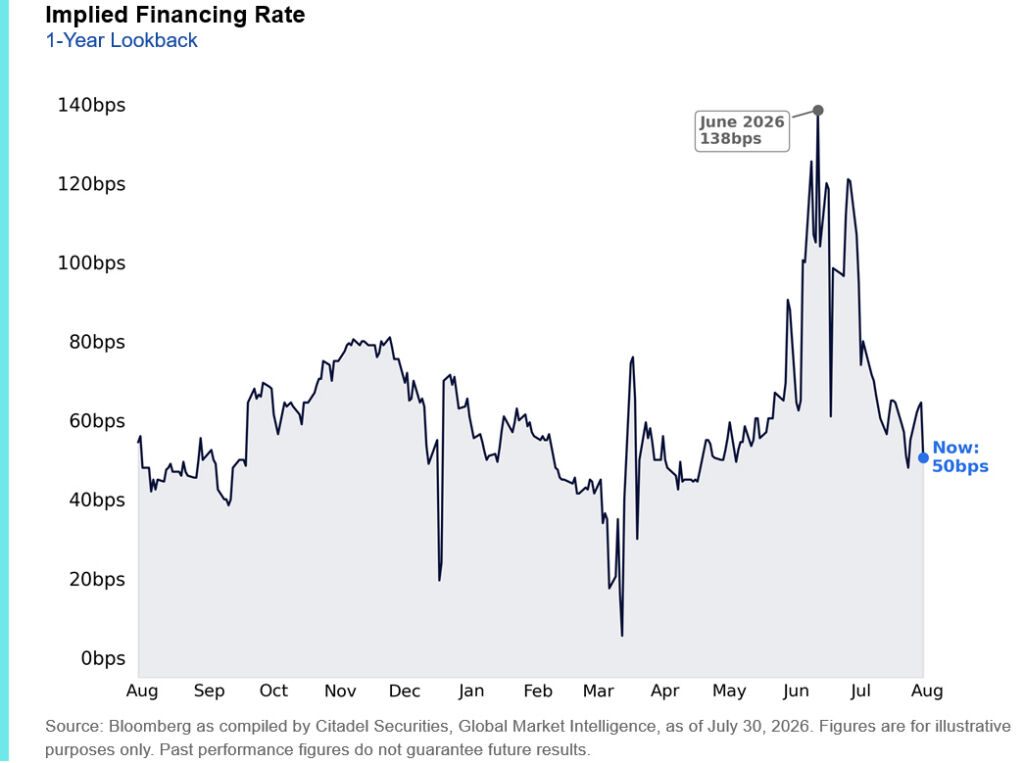
The deleveraging has also been evident in funding markets. One-month equity financing spreads have compressed from 138bps above SOFR at their peak to approximately 50bps today, suggesting leverage demand has normalized materially.
III. The Volatility Backdrop is Evolving
As leverage normalized, another important shift occurred beneath the surface: the volatility regime began to change.
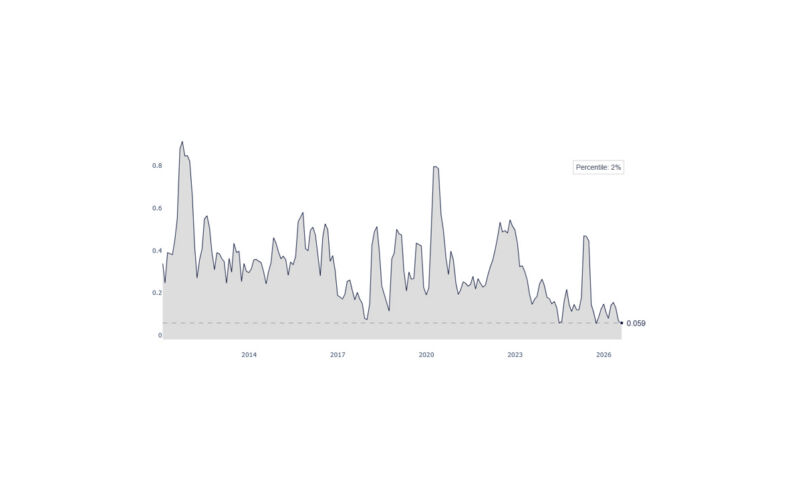
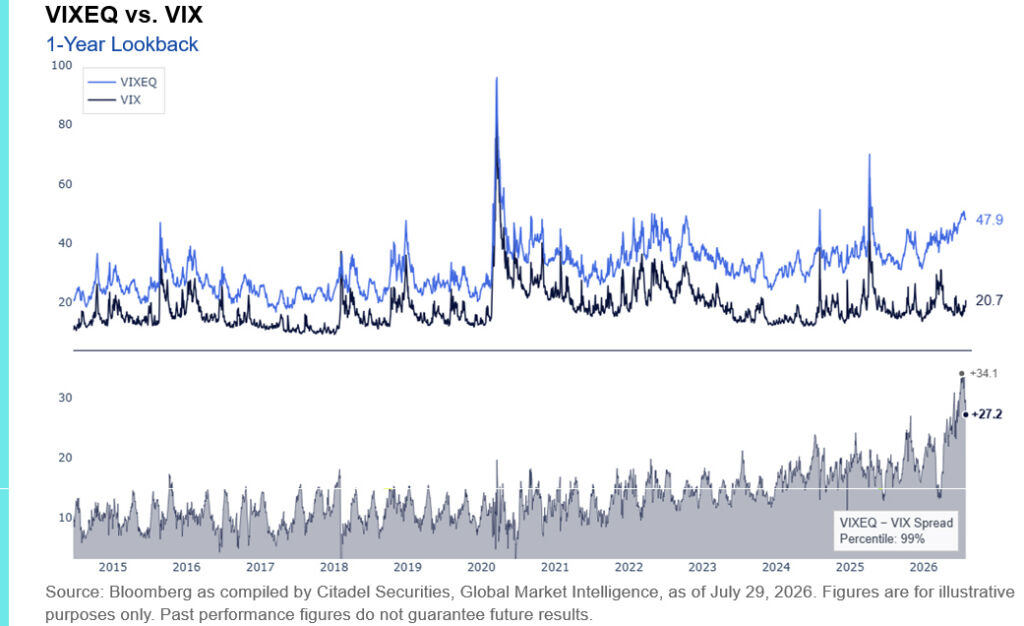
Hedging individual stocks and sectors became unusually expensive as single-name volatility remained elevated, while historically low implied correlations and persistent sector rotations suppressed index-level volatility. The result was an unusually wide gap between single-stock and benchmark volatility that only began to narrow during this week’s broad-based selloff.
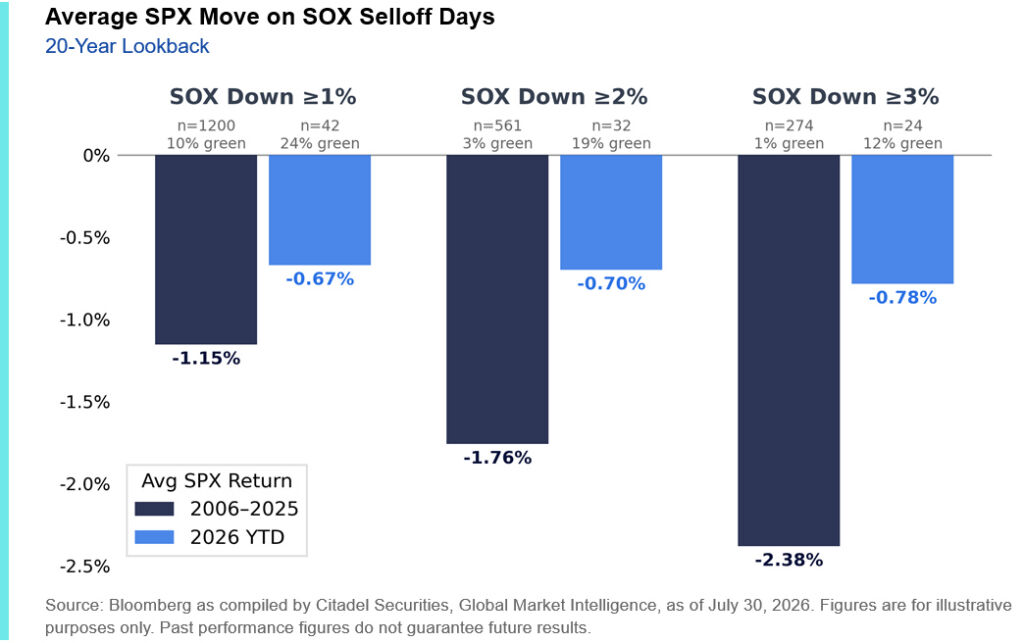
Semiconductor weakness was frequently offset by strength elsewhere in Tech, leaving the S&P 500 unusually resilient despite some of the largest semiconductor drawdowns in years. On days when the SOX Index fell more than 3%, SPX declined only 0.8% on average this year versus 2.4% over the last 20 years, while Software has actually been positive on average – the first such occurrence since at least 2001.
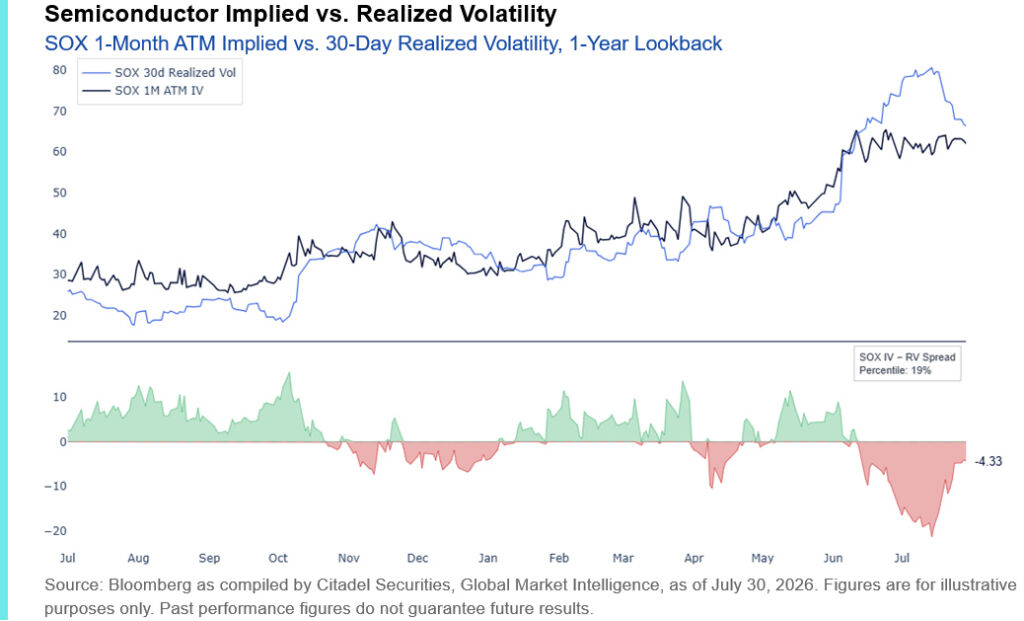
One of the final areas still requiring normalization is semiconductor implied volatility. While implied volatility traded at a historically wide premium to realized volatility throughout June and much of July, that relationship has begun to normalize over the past several weeks. We continue to expect additional compression, which should improve liquidity, reduce hedging costs, and remove one of the remaining technical overhangs for equity markets.
IV. Fundamentals Are Back in Control
With positioning materially cleaner, investors can once again focus on fundamentals rather than flows. Meanwhile, the earnings backdrop continues to strengthen.
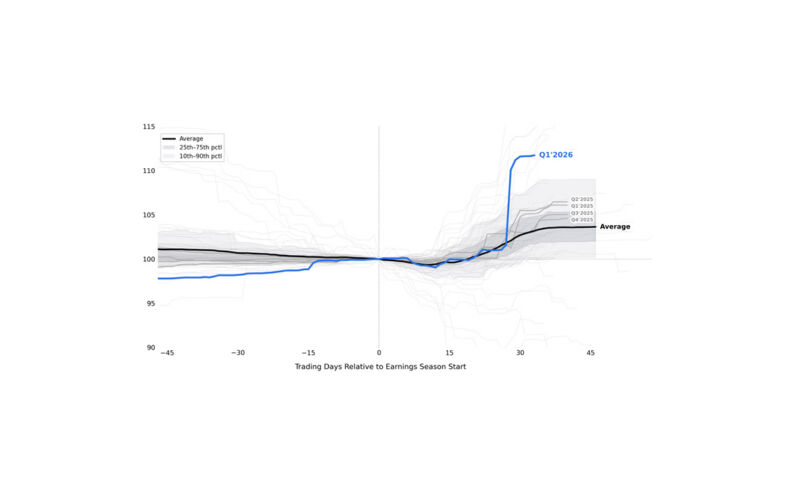
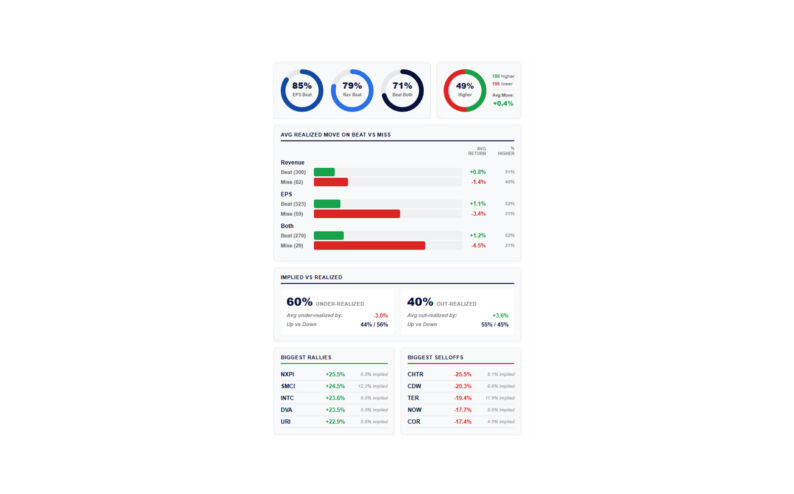
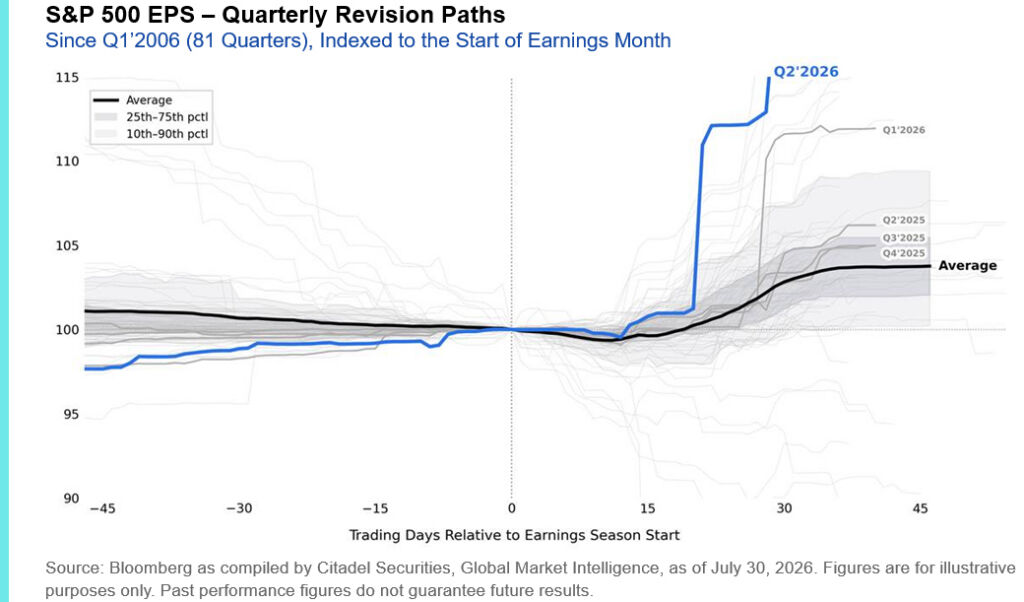
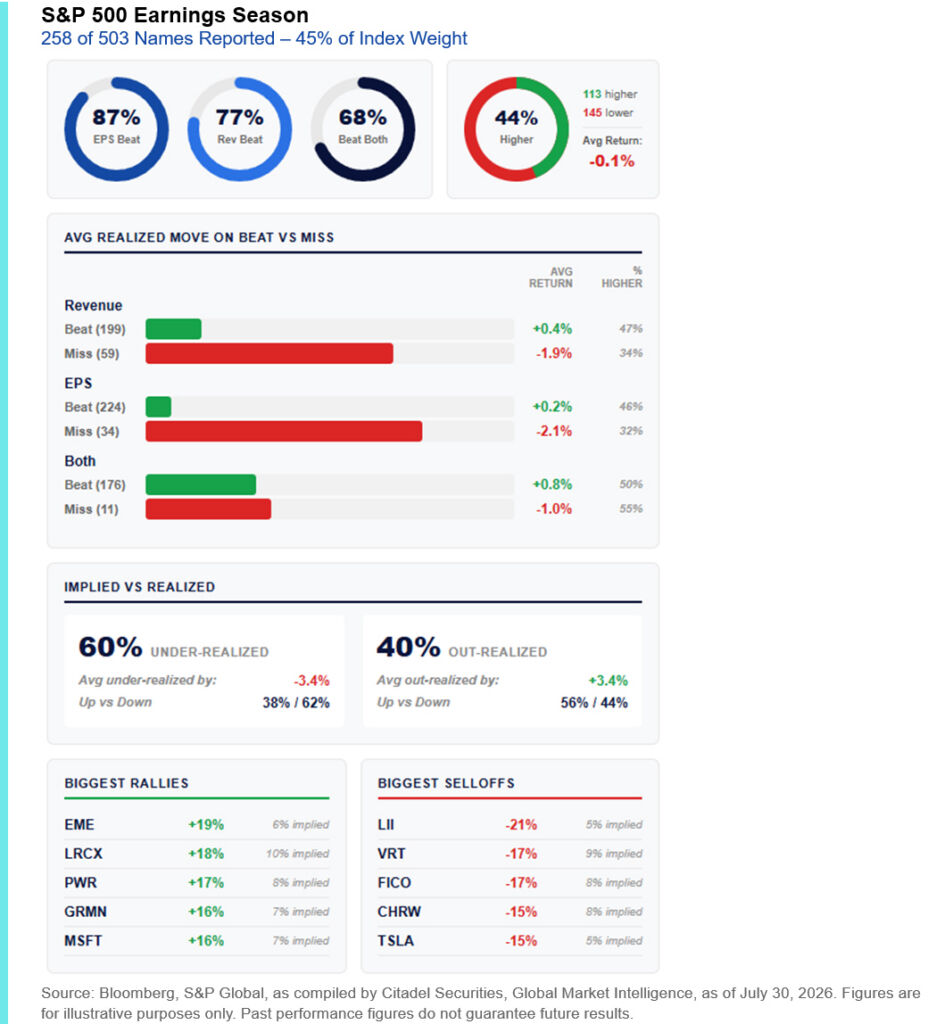
Entering earnings season, expectations were exceptionally high. Companies have continued to exceed those already elevated expectations. Consensus expectations for second-quarter S&P 500 earnings growth have increased from 22.4% at the start of the reporting season to approximately 45% today, marking one of the strongest earnings seasons outside of major post-recession recoveries.
The defining characteristic of the season has not been an unusually high beat rate or an elevated percentage of companies exceeding implied moves. Instead, companies have consistently delivered results well above already-elevated expectations, producing one of the steepest earnings revision paths on record.
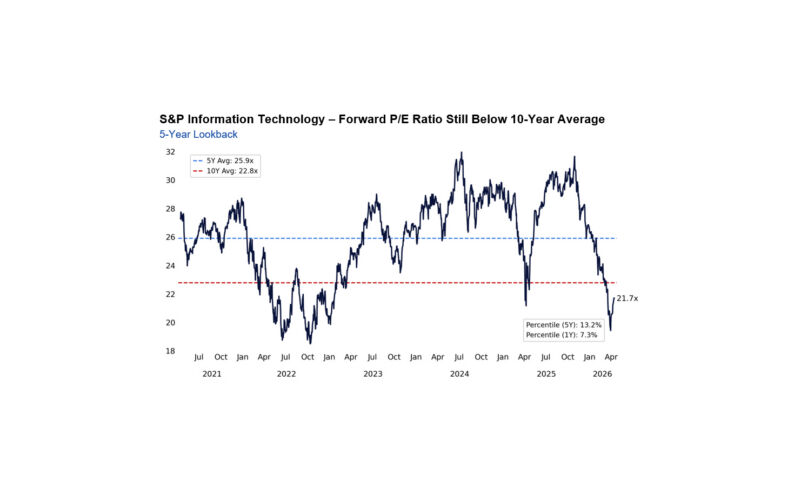
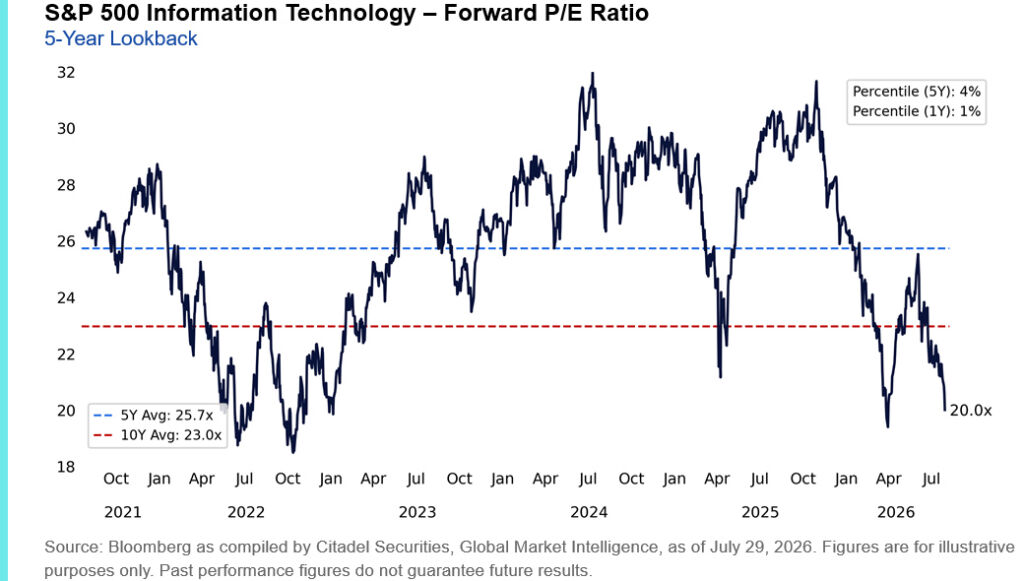
Stronger fundamentals have not been accompanied by multiple expansion. Instead, stronger earnings have coincided with a meaningful compression in valuations. Following July’s selloff, the S&P Information Technology sector now trades at roughly 20x forward earnings, near one-year valuation lows (1st percentile) and well below its 10-year average of 23x.
The market has now moved through the heaviest portion of the summer catalyst calendar, including the FOMC decision and most hyperscaler capex updates. While approximately 40% of the S&P 500 by market capitalization has yet to report – including many semiconductor companies – the results to date have been exceptionally strong.
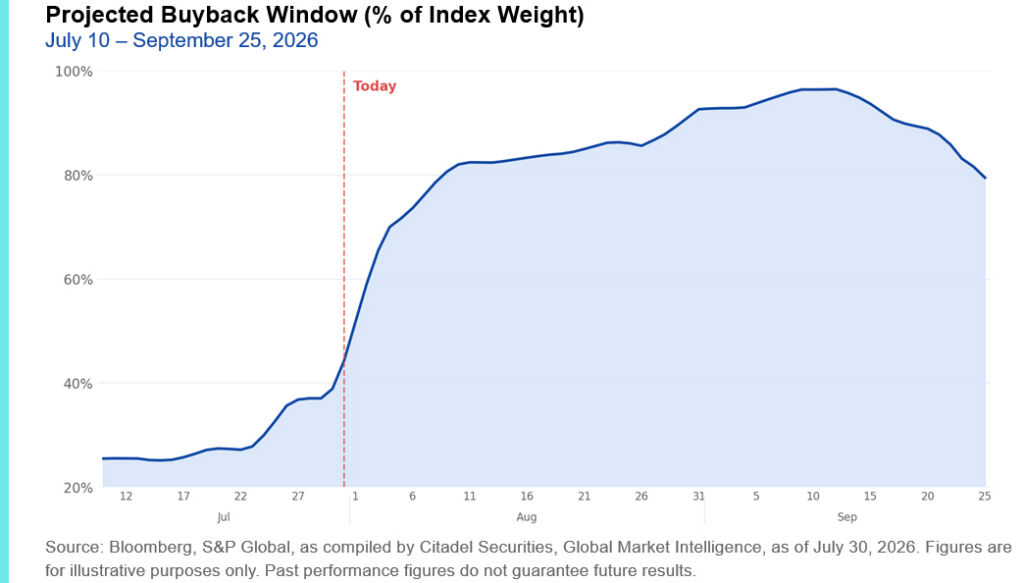
At the same time, one of July’s largest flow-of-funds headwinds is set to reverse. Today, we estimate that only ~45% of the S&P 500 by weight is eligible to repurchase shares. That figure is expected to increase to 75% by the end of next week and nearly 85% by mid-August as earnings blackout windows expire. Corporate demand is now set to reaccelerate precisely as positioning has become materially cleaner, creating one of the most supportive supply-demand backdrops since early summer. August is typically one of the busiest months of the year for corporate buyback executions.
GMI BOTTOM LINE
One month ago, we argued that markets needed a meaningful technical reset before we could become more constructive on U.S. equities. We believe that reset has now largely occurred. Retail investors have meaningfully reduced risk, leverage has normalized, funding conditions have improved, market concentration has declined, and many of the technical excesses that defined early summer have now been unwound. At the same time, earnings continue to surprise to the upside, valuations have become more attractive, and corporate buyback demand is set to accelerate as earnings blackout windows expire.
For the first time in several months, we believe investors can spend less time focused on positioning and more time focused on fundamentals. Markets are transitioning from a flow-driven environment back to one increasingly dictated by earnings, corporate demand, and the macroeconomic backdrop. We remain constructive on the medium-term outlook because the structural pillars of this bull market, including record retail participation, passive ownership, and corporate demand for equities, remain firmly intact.
The technical reset we have been waiting for has largely occurred. July did not change the structural bull market. It reset it.

Copyright © Citadel Enterprise Americas LLC or one of its affiliates. All rights reserved.
Legal Entities Disseminating this Material: This material is disseminated in the United Kingdom by Citadel Securities (Europe) Limited (“CDGE”) authorized and regulated by the Financial Conduct Authority (“FCA”) (Registered company number: 05462867); in the European Union by Citadel Securities GCS (Ireland) Limited (“CSGI”) and its Paris Branch authorized and regulated by the Central Bank of Ireland (“CBI”) (Registration Number: C173437); in Hong Kong by Citadel Securities (Hong Kong) Limited (“CDHK”) licensed by the Securities and Futures Commission of Hong Kong (“SFC”), in Japan by Citadel Securities Japan Co., Ltd (“CSJC”) registered as a Type 1 financial instruments business operator with the Japan Financial Services Agency (“JFSA”); and in the United States of America by Citadel Securities LLC (“CDRG”) registered with the Securities Exchange Commission (“SEC”), Financial Industry Regulatory Authority (“FINRA”), and Securities Investor Protection Corporation (“SIPC”), Citadel Securities Institutional LLC (“CSIN”) registered with the SEC, FINRA, and SIPC, or Citadel Securities Swap Dealer LLC (“CSSD”) registered with the SEC, Commodities Futures Trading Commission (“CFTC”), and National Futures Association (“NFA”). Unless governing law permits otherwise, you must contact a Citadel Securities entity in your home jurisdiction if you want to use our services in effecting a transaction in any financial instruments or securities, including derivatives.
FOR INSTITUTIONAL USE ONLY; FOR PROFESSIONAL CLIENTS AND ELIGIBLE COUNTERPARTIES ONLY. This material is not intended as and does not constitute investment research. Contents of this material will be strictly limited to non-specific, generic information (i.e. macro events/topics) and are not subject to the Markets in Financial Instruments directive (MiFID II) or FINRA research rules. This material does not constitute an offer, solicitation, invitation, or inducement to purchase, acquire, subscribe to, provide, or sell any financial instrument or otherwise engage in investment activity. Please see additional important disclosures, including disclosures that may be relevant to your country of residence or business at www.citadelsecurities.com/GlobalSalesTrading.