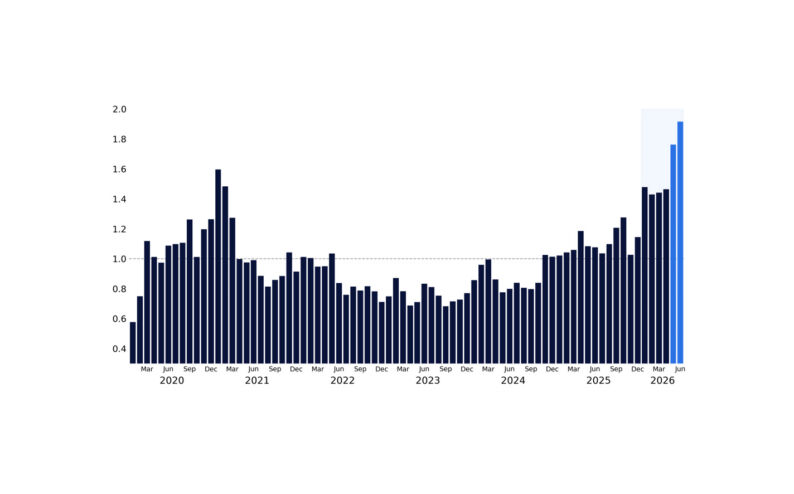
The election is over and markets are breathing a sigh of relief, with S&P 500 futures now 260bps and Nasdaq 100 futures 350bps off their overnight lows.
This sets the stage for investors to rebuild equity exposure into year-end.
October brought a significant reset across Technology and the AI complex, but remarkably little broad-based selling. While the Nasdaq 100 declined nearly 10% over the past month, the equal-weight S&P 500 advanced nearly 5%, with investors rotating into other parts of the market rather than indiscriminately reducing equity exposure.
The underlying demand picture has also changed. Retail has bought US equities for 22 consecutive sessions, corporate buyback windows are reopening, and CTA positioning has fallen to -3.3 standard deviations, leaving considerable room for systematic buying as markets recover. Meanwhile, earnings continue to beat elevated expectations, while valuations across semiconductors and AI infrastructure have compressed sharply.
We believe the combination of light positioning, returning corporate demand, persistent retail buying, and historically favorable post-midterm seasonality creates a compelling setup for US equities into year-end. With the election behind us and volatility potentially normalizing, there is considerable capacity for investors to rebuild risk.

1. The Buyers are Coming Back
Retail: Twenty-Two Sessions of Buying into a Falling Tape.
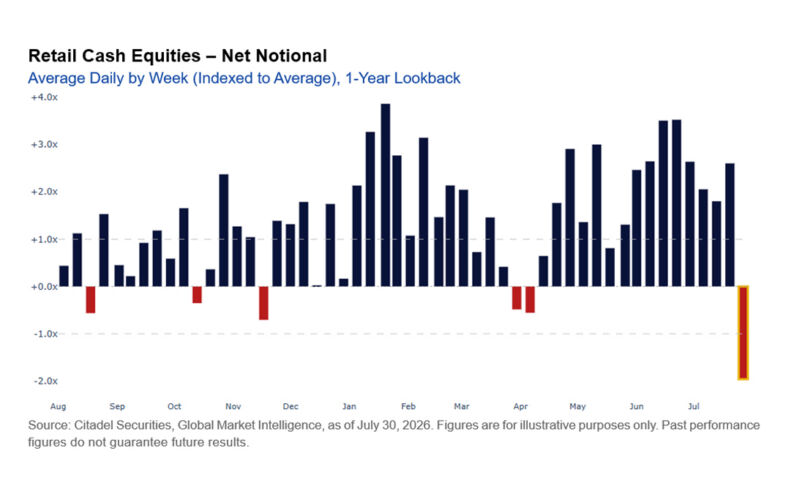
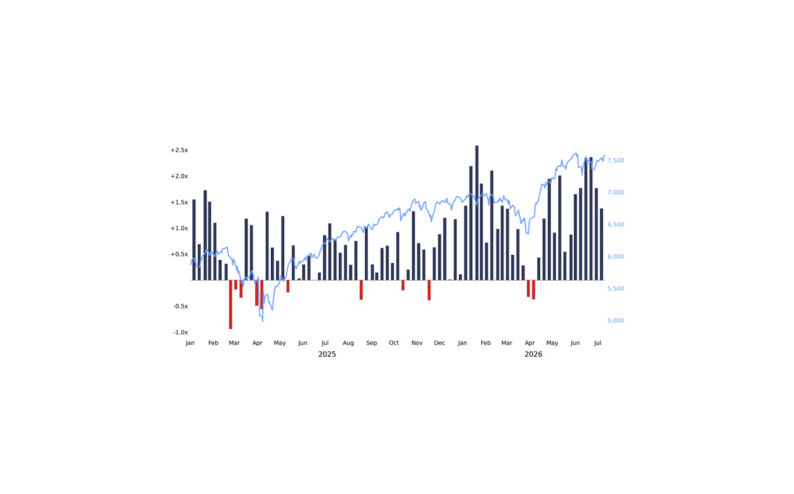
Retail has been a net buyer of US cash equities on our platform for 22 consecutive sessions since October 5, accumulating nearly $33B in the sixth-longest and fifth-largest buying streak since 2017. Buying has averaged $1.5B per session, 1.4x the trailing-year average, as the S&P has fallen 2.0% over the same period. Of the 12 previous buying streaks lasting at least 15 sessions, the S&P advanced during 10, with a median gain of 2.2%. None occurred alongside a larger market decline.
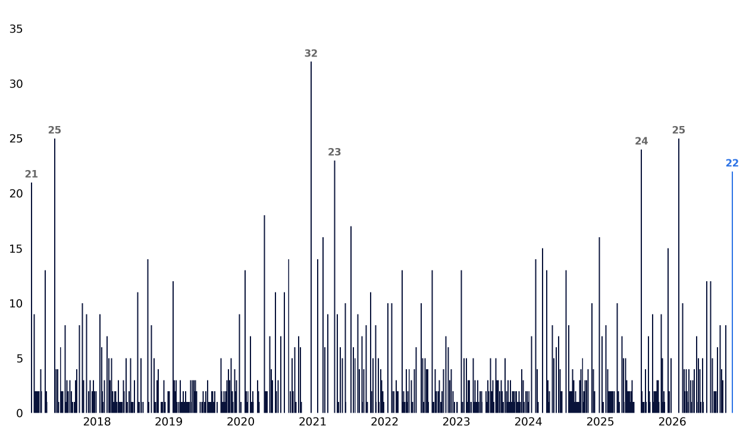
Cash flow was concentrated in ETFs, but the single-name rotation favored semis and the AI build-out over recent winners and defensives. Year-to-date net equity buying has reached a record $251B, surpassing the previous full year high of $241B in 2021 and running 134% ahead of the same point last year.
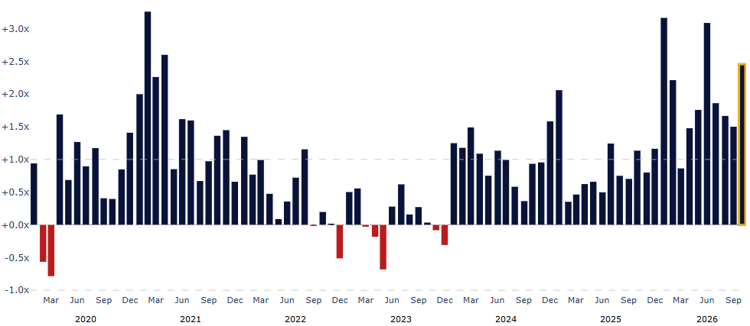
Retail options activity has reflected a similar shift, with investors increasingly favoring index products and buying into weakness across Technology. October was the busiest October on record for our retail options platform, with index and ETF products accounting for nearly 60% of activity. Retail continued to buy dips in the broader market, trading 7% better to buy on S&P 500 down days while remaining roughly flat on up days.
Within more thematic activity, the rotation once again toward Semiconductors has been particularly pronounced. Activity ran 15% above its trailing-year average, with the sector accounting for nearly 40% of single-stock premium, roughly double its share a year ago.
Corporate Buybacks: The Blackout Window Reopens
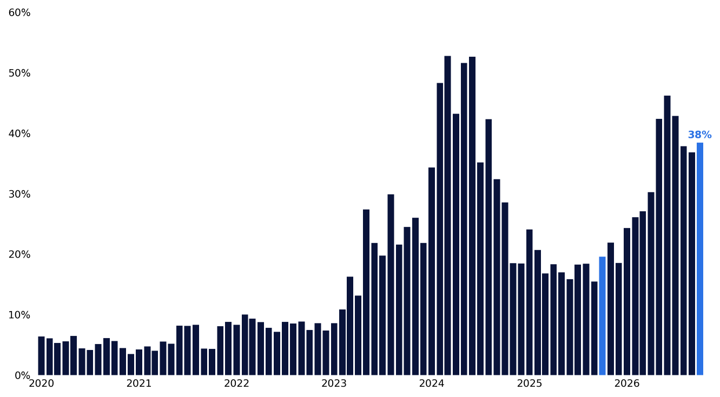
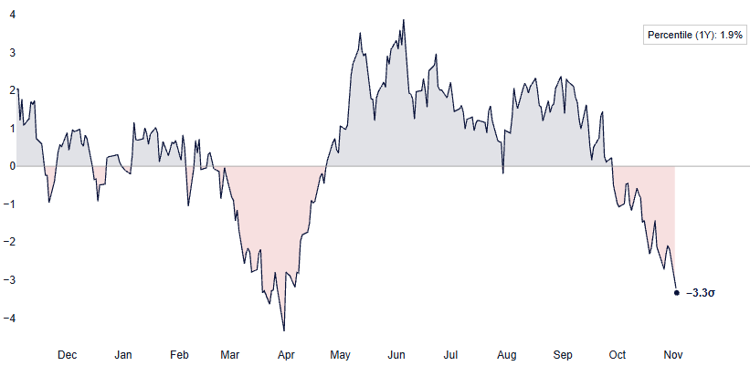
Corporate repurchases are also set to return as Q3 earnings-related blackout windows expire. Less than a quarter of S&P 500 index weight was eligible to repurchase shares in mid-October, compared with approximately two-thirds by Election Day and an expected 85% by November 9. The reopening comes against a record year for buyback authorizations, with companies announcing $1.5T of new repurchase programs through November 2, already exceeding the previous full-year record set in 2025.
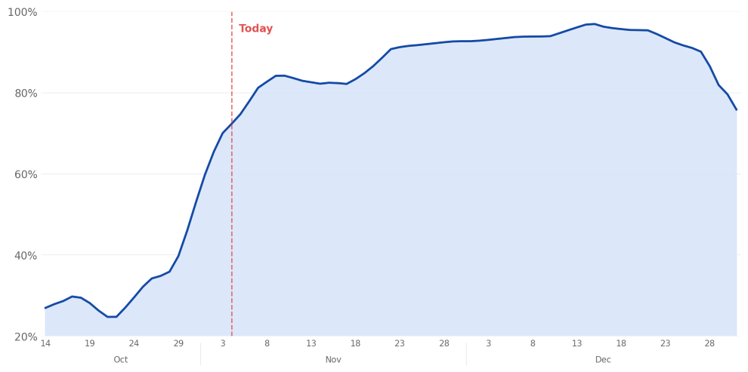
October alone saw $166B of new buyback authorizations, more than twice its historical average, with 30 programs of at least $1B announced since our October update. The recent pickup has also extended beyond Technology, broadening the potential base of corporate demand as repurchase windows reopen heading into year-end.
CTAs: From Long to -3.3σ
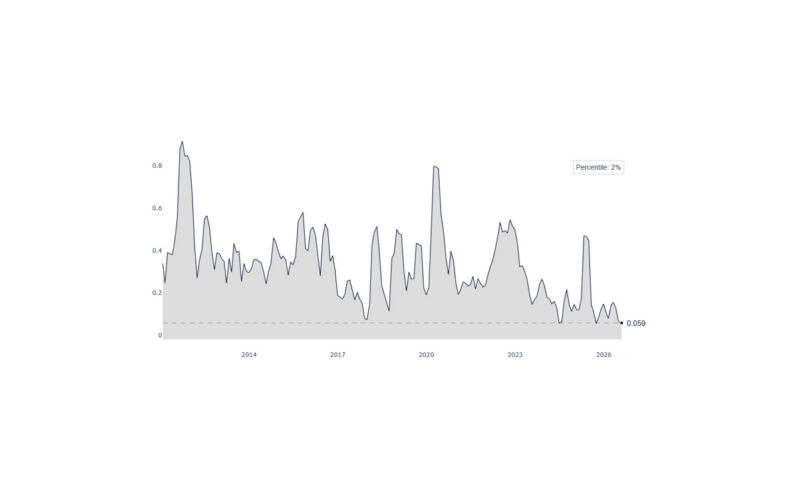
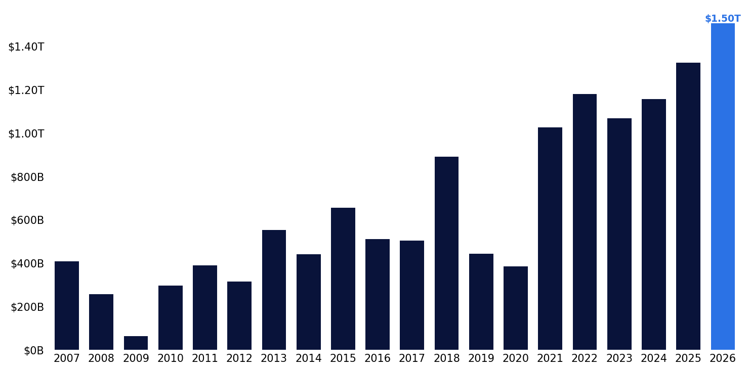
Our CTA model estimates aggregate US equity positioning at -3.3 standard deviations, in the sub-2nd percentile of its one-year range, in the 10th percentile of its history since 2018, and the lowest since March 31. Positioning has fallen from +1.7σ three months ago to -1.0σ one month ago, with CTAs now short for 26 consecutive sessions.
A sustained recovery through key technical levels could prompt trend-following strategies to rebuild equity exposure, adding another potential source of demand alongside retail accumulation and corporate repurchases.
2. Earnings Are Beating. Multiples Are Falling.
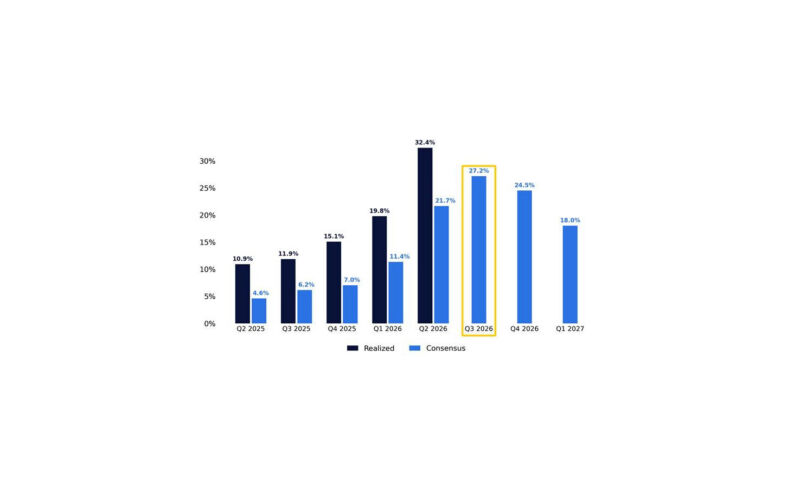
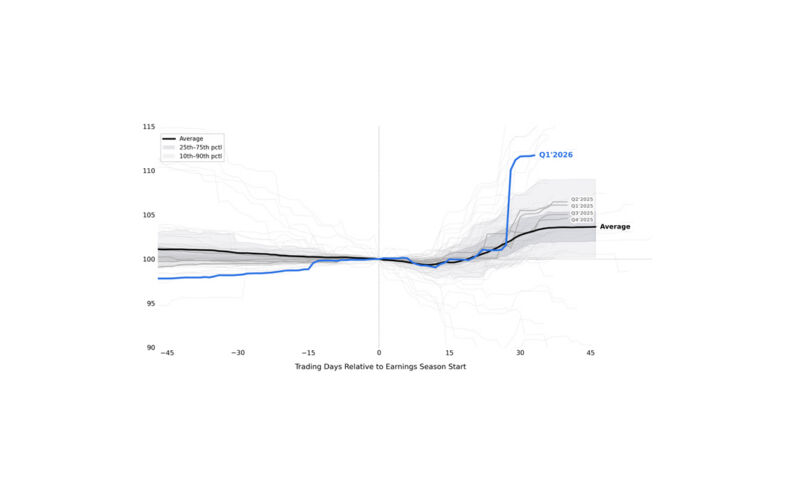
Corporate earnings have continued to exceed expectations despite entering Q3 reporting season against one of the highest bars in more than a decade. Consensus expectations called for 27% YoY S&P 500 EPS growth, with estimates having been revised higher heading into earnings. Through the first 304 reporters, representing 65% of index weight, 83% of companies have beaten EPS estimates, compared with a historical average of ~75%. This ranks among the ten strongest reporting seasons at a comparable stage since 2005.
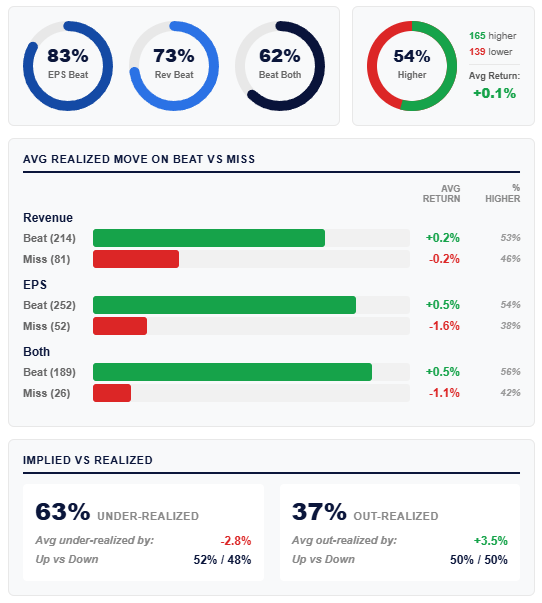
Despite the strength in reported earnings, investors have been considerably less willing to reward companies for beating expectations. The index-weighted average earnings-day move has been −1.2%, the 2nd worst in 87 reporting seasons since 2005. The reaction has been particularly pronounced across Technology and Communication Services, where more than 90% of companies have beaten EPS estimates, yet only 35% and 18%, respectively, have traded higher following their reports.
The repricing has been most aggressive across the areas of the market experiencing the strongest earnings revisions. Since June 30, forward EPS estimates have risen 32% for Memory, 31% for AI Infrastructure, and 30% for Semiconductors. Over the same period, forward valuation multiples have contracted 50%, 36% and 35%, respectively. Nearly every company in these groups has seen earnings expectations improve, yet all 20 S&P 500 semiconductor constituents have experienced multiple compression. The trend has continued since our October update, with semiconductor estimates rising another 3% while valuations declined a further 7%.
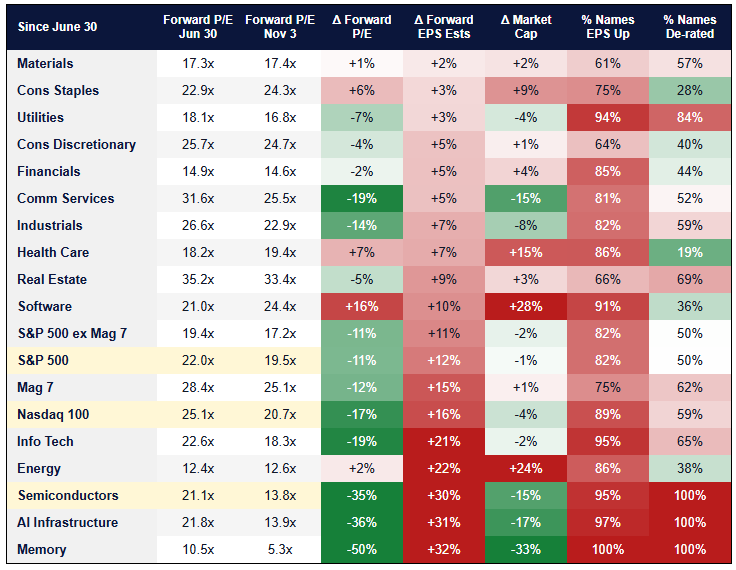
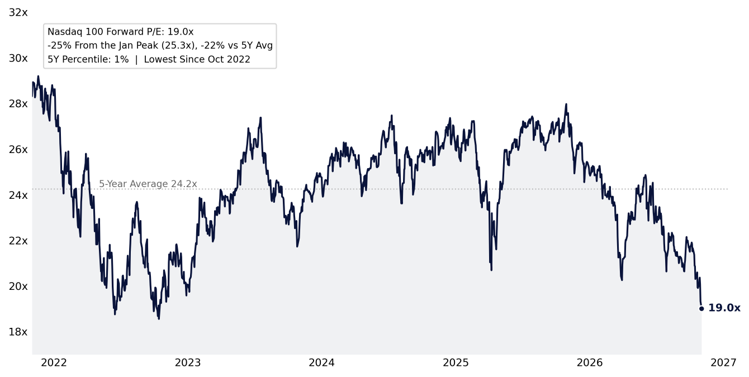
The compression has been particularly pronounced in the Nasdaq 100, which now trades at 19.1x forward earnings, its lowest multiple since October 2022 and 24% below its January peak. Despite a 14% increase in forward earnings since June, the multiple has contracted 19%. Relative to the S&P 500, the Nasdaq now costs just a 5% premium, the smallest since January 2017 and well below its ten-year average of ~20%. Information Technology itself trades at 18.2x, its lowest multiple since March 2020.
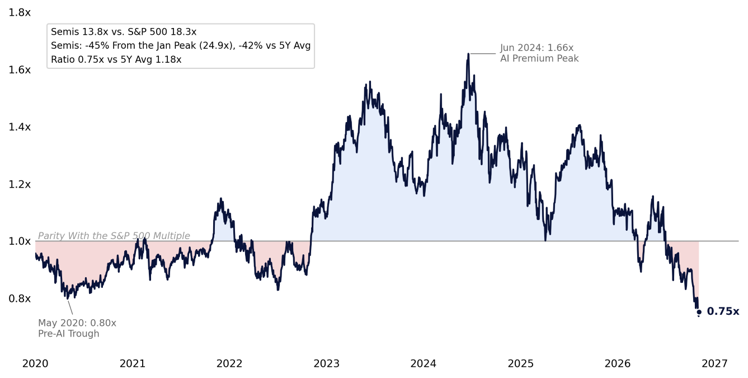
Semiconductors have seen an even sharper reset. The S&P 500 semiconductors now trade at 13.8x forward earnings, 45% below the January peak and the lowest since July 2022.
Relative to the S&P 500, Semiconductors trade at a 25% discount, the widest since December 2018, having commanded a 66% premium at the height of the AI trade in June 2024. This is despite forward earnings estimates rising 30% since June, with the sector expected to account for nearly half of the S&P 500’s Q3 EPS growth despite representing less than one-fifth of index weight. With valuations having compressed substantially faster than earnings expectations, even a modest recovery in sentiment toward Technology (and Semiconductors in particular) could have a meaningful impact on the broader index.
3. Broadening Beneath the Surface
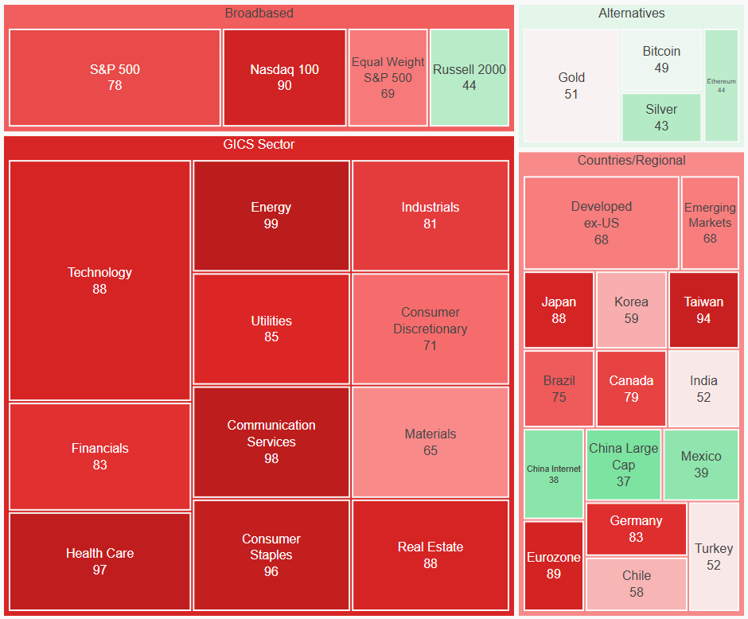
One of the more unusual features of the recent market weakness has been the extraordinary divergence between the largest index constituents and the broader market. Over the 20 sessions through November 2, the equal-weight S&P 500 gained more than 4% while the Nasdaq 100 declined nearly 10%, a 14% divergence ranking in the 99th percentile of all 20-session windows since 1990. The only wider rotations occurred during the dot-com era, while just four comparable episodes have taken place alongside a flat or declining market.
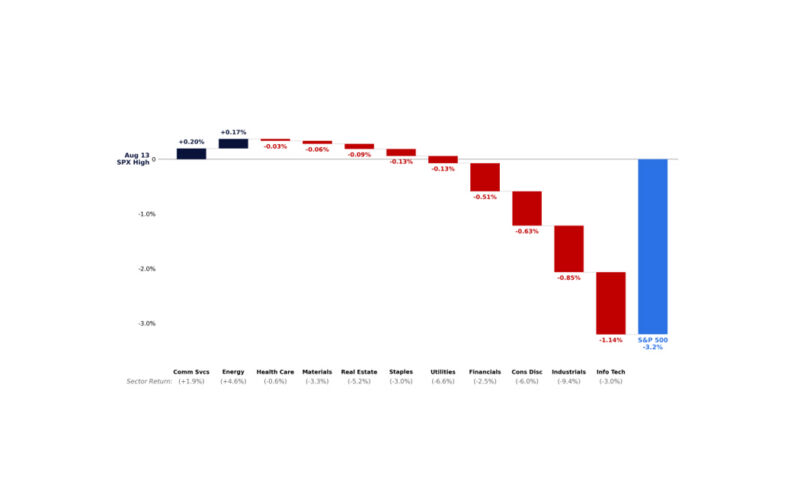
Despite a more than a 20% decline in semiconductor equities, most S&P 500 constituents have moved higher, with particularly strong performance across Staples, Utilities, Health Care, and Energy. Rather than the broad-based liquidation typically associated with a Technology drawdown of this magnitude, investors have largely rotated into other parts of the market.
Breadth has been equally remarkable: a median 53% of S&P 500 constituents advanced on the index’s down days over the period, compared with just 31% historically. The most extreme example came on October 29, when 406 of 503 constituents advanced despite SPY declining 38bps, the broadest positive breadth on a down day in our point-in-time history.
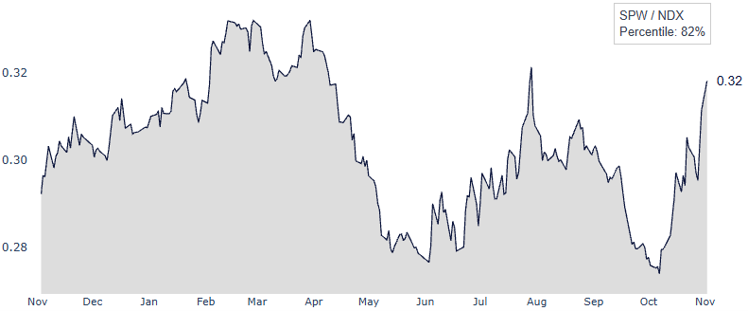
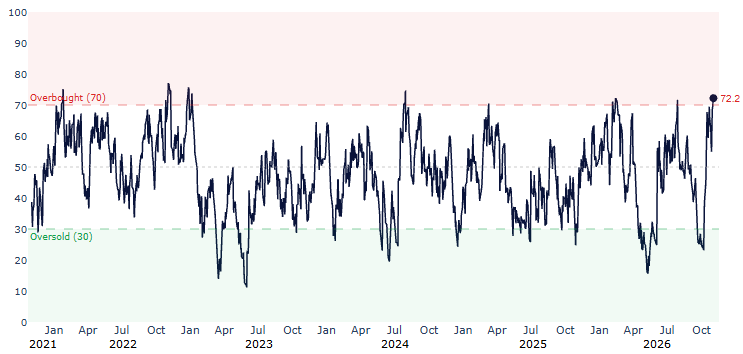
The reversal in leadership has also been usually quick. As recently as October 7, SPW vs. NDX had reached its lowest level since April 2000 before reversing sharply through the remainder of the month, now sitting in the 82nd percentile of its 1-year range. The RSI of SPW vs. NDX is now the most overbought it has been in more than 2 years, and a level only reached 20 times in the last two decades.
That distinction matters for the cap-weighted index. The ten largest S&P 500 companies still account for 37% of index weight, the Mag 7 for 33%, and NVDA alone for more than 235 of the smallest names in the index. The top ten’s share has fallen roughly 2.5 points since late September, but concentration remains historically high. In Q3, the ten largest names contributed 3.4 points of the S&P 500’s 2.3% gain, while the other constituents detracted 1.2 points. October was the reverse: broad participation was not enough to offset weakness in the largest stocks.
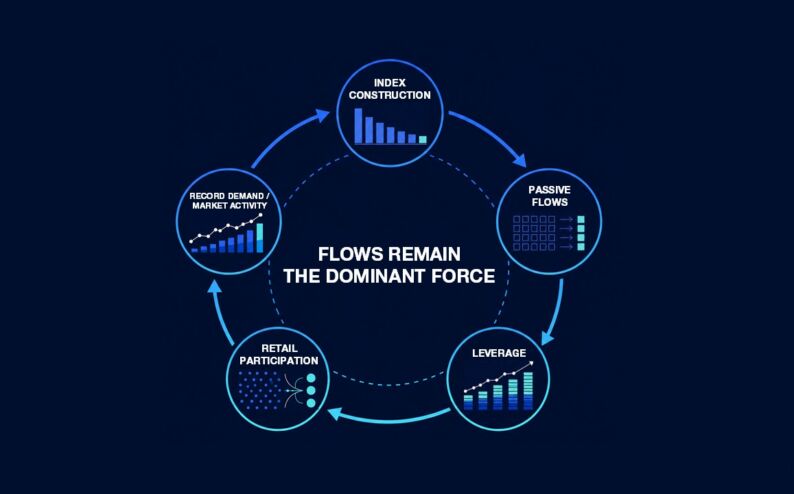
The same concentration can work in the other direction. With the average stock holding up and valuations across semiconductors and AI infrastructure substantially lower, renewed buying in the largest technology names would have an outsized effect on the benchmark. Passive index inflows would add to that demand, with 37 cents of every dollar allocated to the S&P 500 going to its ten largest constituents.
4. Positioning and the November Setup
The recent drawdown has been accompanied by a significant repricing in volatility, despite the absence of broad-based selling across US equities. One-month implied volatility is now elevated across nearly every major sector, with Energy, Communication Services, Consumer Staples, and Health Care all trading above the 95th percentile of their trailing-year ranges. The S&P 500 and Nasdaq 100 are also trading at the 83rd and 96th percentiles, respectively, even as realized volatility in the broader market has remained relatively contained.
The VIX rose above 21 against S&P 500 one-month realized volatility below 11, alongside a meaningful steepening in index skew, with SPY one-month put/call skew now in the 73rd percentile of the past year. With implied volatility elevated relative to realized moves, a decline in volatility following the election and earnings season could allow volatility-targeting and other risk-managed strategies to rebuild equity exposure. This would add another potential source of demand alongside reopening corporate buyback windows and historically light systematic positioning.
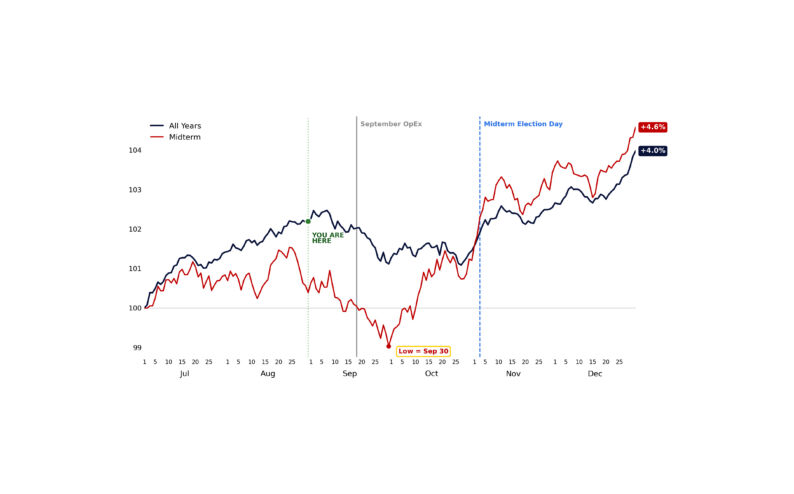
The historical post-midterm setup is also particularly favorable. Since 1950, the S&P 500 has been higher six and twelve months after every midterm election, with a median twelve-month gain of 14.5%.
The fourth quarter of midterm years has historically been the strongest of the presidential cycle, with the S&P 500 averaging a 5.6% gain versus 2.9% across all years. November has been particularly strong, averaging +2.2% in midterm years, with the first half of the month positive nearly 80% of the time. The strength has been even more pronounced in Technology, with the Nasdaq 100 averaging nearly 5% in November and outperforming the S&P 500 in all post-midterm 12-month periods since 2002, by an average of roughly 10 percentage points.
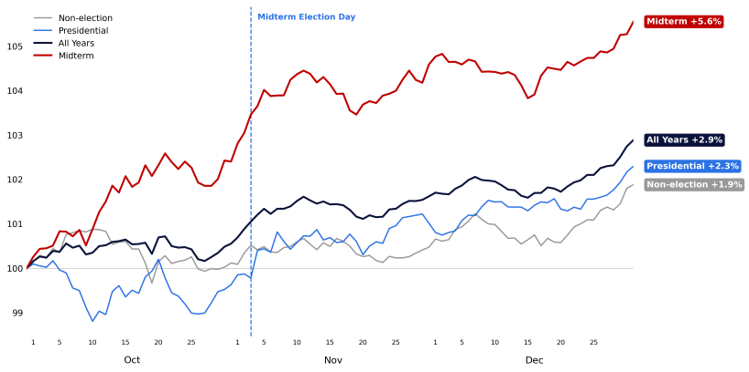
This year’s market has entered the post-election period well behind its typical midterm-year seasonal path. The S&P 500 was lower from the end of September heading into the vote, compared with an average gain of approximately 3.5% by Election Day in previous midterm years. Historically, the fourth-quarter low has been established in October in 14 of 24 midterm years, followed by a median rally of nearly 10% into year-end.
GMI Bottom Line
The election is behind us, earnings remain strong, positioning has reset, and the calendar is turning more favorable. With uncertainty fading and several of the market’s largest buyers returning, we believe the path of least resistance for U.S. equities is higher into year-end.
Copyright © Citadel Enterprise Americas LLC or one of its affiliates. All rights reserved.
Legal Entities Disseminating this Material: This material is disseminated in the United Kingdom by Citadel Securities (Europe) Limited (“CDGE”) authorized and regulated by the Financial Conduct Authority (“FCA”) (Registered company number: 05462867); in the European Union by Citadel Securities GCS (Ireland) Limited (“CSGI”) and its Paris Branch authorized and regulated by the Central Bank of Ireland (“CBI”) (Registration Number: C173437); in Hong Kong by Citadel Securities (Hong Kong) Limited (“CDHK”) licensed by the Securities and Futures Commission of Hong Kong (“SFC”), in Japan by Citadel Securities Japan Co., Ltd (“CSJC”) registered as a Type 1 financial instruments business operator with the Japan Financial Services Agency (“JFSA”); and in the United States of America by Citadel Securities LLC (“CDRG”) registered with the Securities Exchange Commission (“SEC”), Financial Industry Regulatory Authority (“FINRA”), and Securities Investor Protection Corporation (“SIPC”), Citadel Securities Institutional LLC (“CSIN”) registered with the SEC, FINRA, and SIPC, or Citadel Securities Swap Dealer LLC (“CSSD”) registered with the SEC, Commodities Futures Trading Commission (“CFTC”), and National Futures Association (“NFA”). Unless governing law permits otherwise, you must contact a Citadel Securities entity in your home jurisdiction if you want to use our services in effecting a transaction in any financial instruments or securities, including derivatives.
FOR INSTITUTIONAL USE ONLY; FOR PROFESSIONAL CLIENTS AND ELIGIBLE COUNTERPARTIES ONLY. This material is not intended as and does not constitute investment research. Contents of this material will be strictly limited to non-specific, generic information (i.e. macro events/topics) and are not subject to the Markets in Financial Instruments directive (MiFID II) or FINRA research rules. This material does not constitute an offer, solicitation, invitation, or inducement to purchase, acquire, subscribe to, provide, or sell any financial instrument or otherwise engage in investment activity. Please see additional important disclosures, including disclosures that may be relevant to your country of residence or business at www.citadelsecurities.com/GlobalSalesTrading.