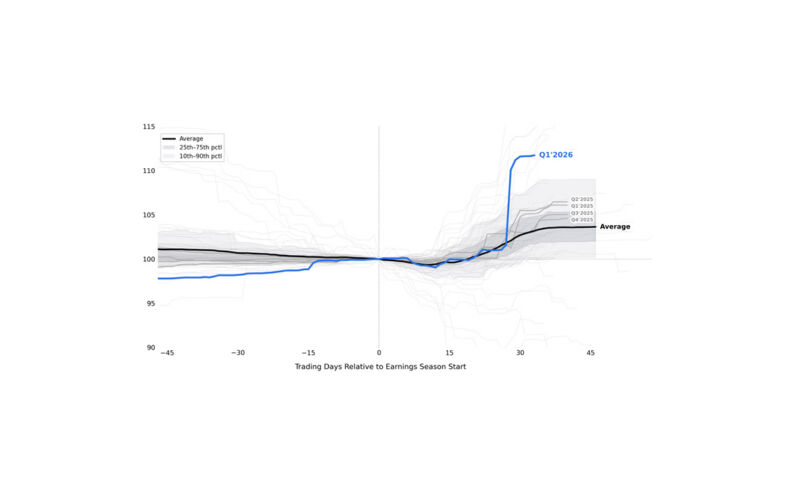
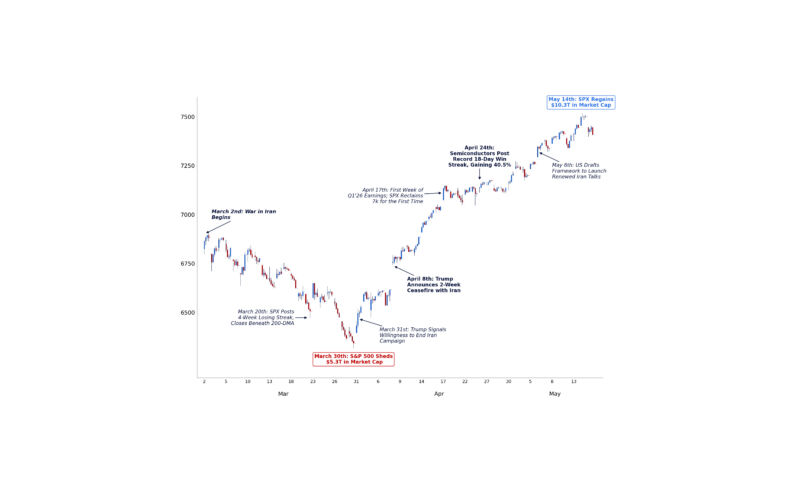
We remain constructive on US equities into Q4, but the next several weeks will be a much more meaningful test of the fundamental backdrop.
In our last note, October: The Q4 Reload, we focused on the reset in valuations and positioning, and the potential return of several of the market’s largest buyers. Since then, retail buying has accelerated despite below-average volumes, equal weight has begun to recover from extreme relative lows, and single-stock volatility has continued to outperform an increasingly quiet index.
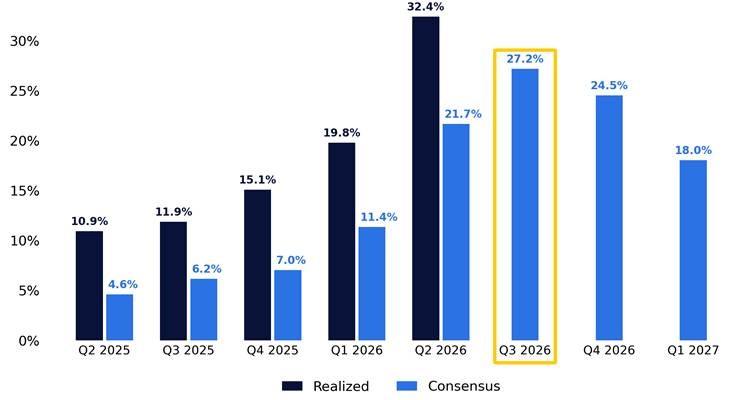
The fundamental backdrop remains strong. Consensus entered Q3 reporting looking for ~27% YoY S&P 500 EPS growth, with earnings expectations continuing to improve even as valuations across much of the growth complex have compressed.
After months dominated by macro headlines, positioning adjustments, and shifting AI narratives, earnings are returning to the center of the conversation. And with valuations reset, investor demand beginning to recover, and market leadership showing early signs of change, the setup heading into this reporting season looks considerably different than it did just a few months ago.

1. Back to Earnings
The earnings bar has remained exceptionally high, even after a difficult September for equities. Consensus is looking for ~27% YoY S&P 500 EPS growth in Q3, the third-highest expectation heading into a reporting season since 2010, behind only the two pandemic-recovery quarters.
Companies have continued to deliver against elevated expectations. Realized earnings growth has exceeded the pre-season consensus in 19 of the last 20 quarters, including by roughly 10 points in each of the last two. Q2’s EPS beat rate reached 88%, the highest outside the 2020-2021 recovery.
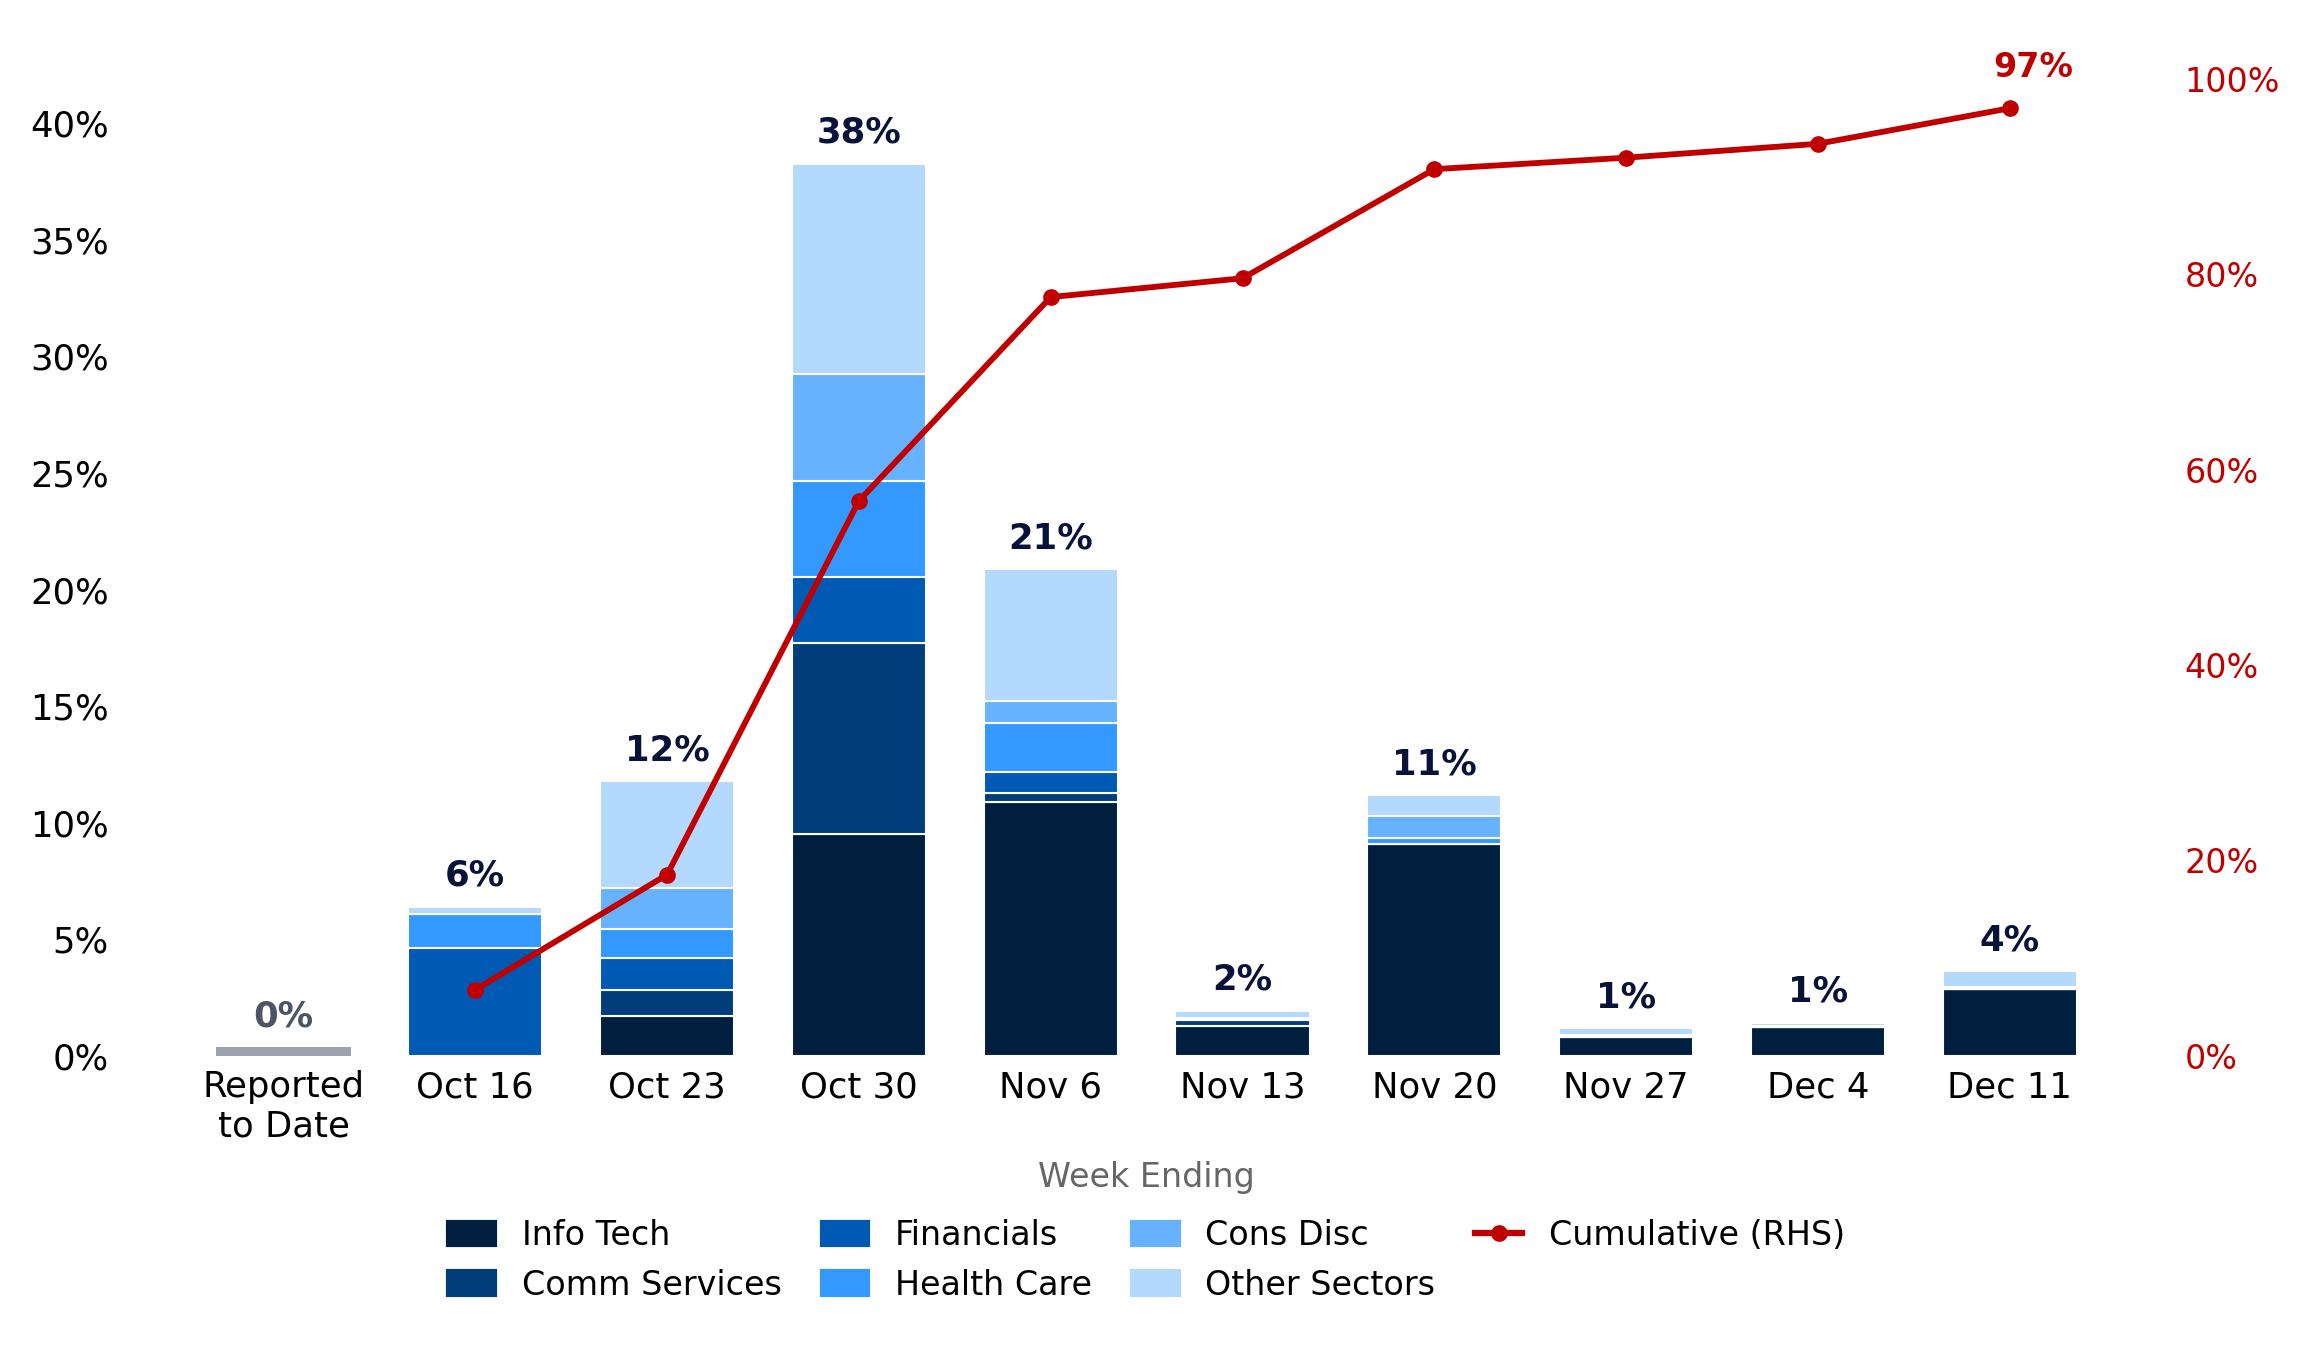
The bulk of Q3 reporting is still ahead, and the calendar is unusually concentrated. Roughly 47% of S&P 500 index weight and one-third of expected earnings growth will report during the five sessions from October 28 through November 3.
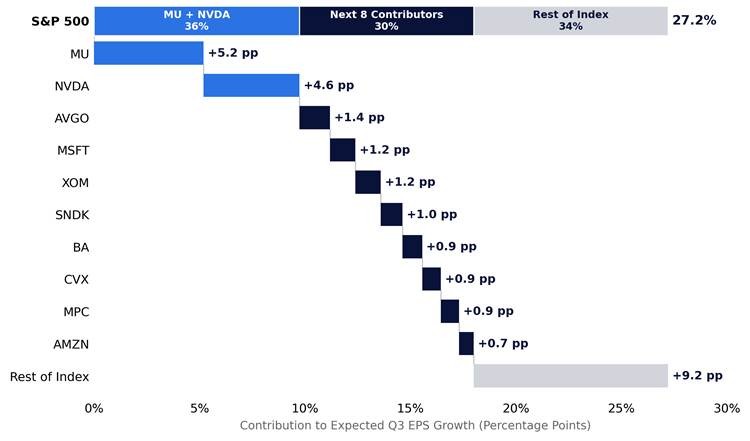
Our latest earnings work also highlights how much of the expected growth is coming from a relatively small group of companies, particularly across Memory, Semiconductors, and Energy:
- MU and NVDA alone account for 36% of expected S&P 500 earnings growth
- The ten largest contributors represent roughly two-thirds of expected growth
- Excluding those ten companies, expected earnings growth falls to ~11%
- The smallest 300 S&P 500 companies by market cap are expected to grow earnings ~5%
Despite that concentration, roughly 74% of S&P 500 companies are expected to deliver positive YoY earnings growth, above the 66% median since 2021.
Earnings expectations have continued to move higher despite the recent weakness in equities. Aggregate S&P 500 estimates rose 1.6% between July 1 and the start of reporting, the second-strongest pre-season revision in five years, behind only Q2 2026. On our index-level series, Q3 also marks the fifth consecutive quarter of pre-season earnings upgrades.
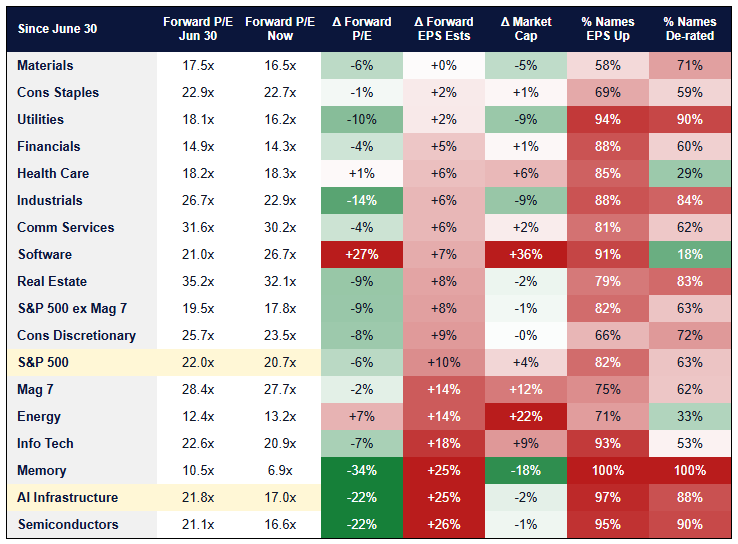
The divergence between forward earnings expectations and valuations has been particularly pronounced across Semiconductors, Memory, and AI infrastructure. Since the end of June, forward earnings expectations have risen sharply even as valuation multiples have compressed:
- Memory: Forward 12-month EPS estimates +25%, forward P/E -34%.
- AI Infrastructure: Forward 12-month EPS estimates +25%, forward P/E -22%.
- S&P 500: Forward 12-month EPS estimates +10%, forward P/E -6%.
Corporate guidance has also remained exceptionally strong. Over the past four quarters, S&P 500 companies have raised guidance nearly three times for every cut. Outside the 2009-2010 and 2020-2021 recoveries, this is the most supportive stretch of corporate guidance in 20 years of data.
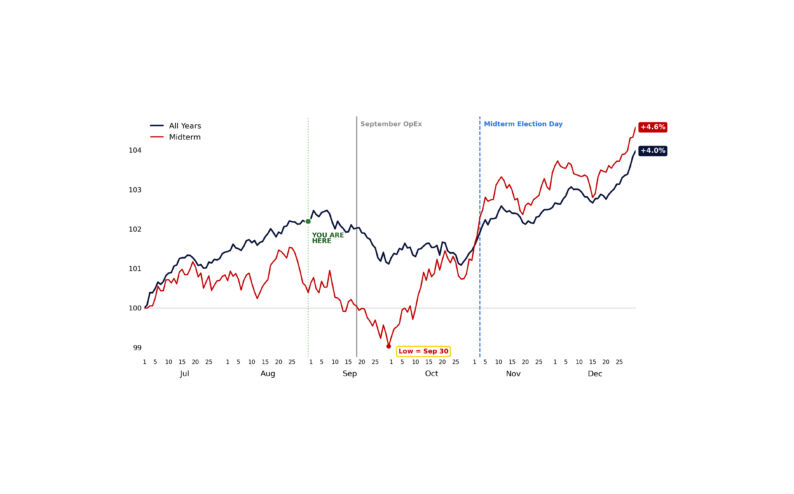
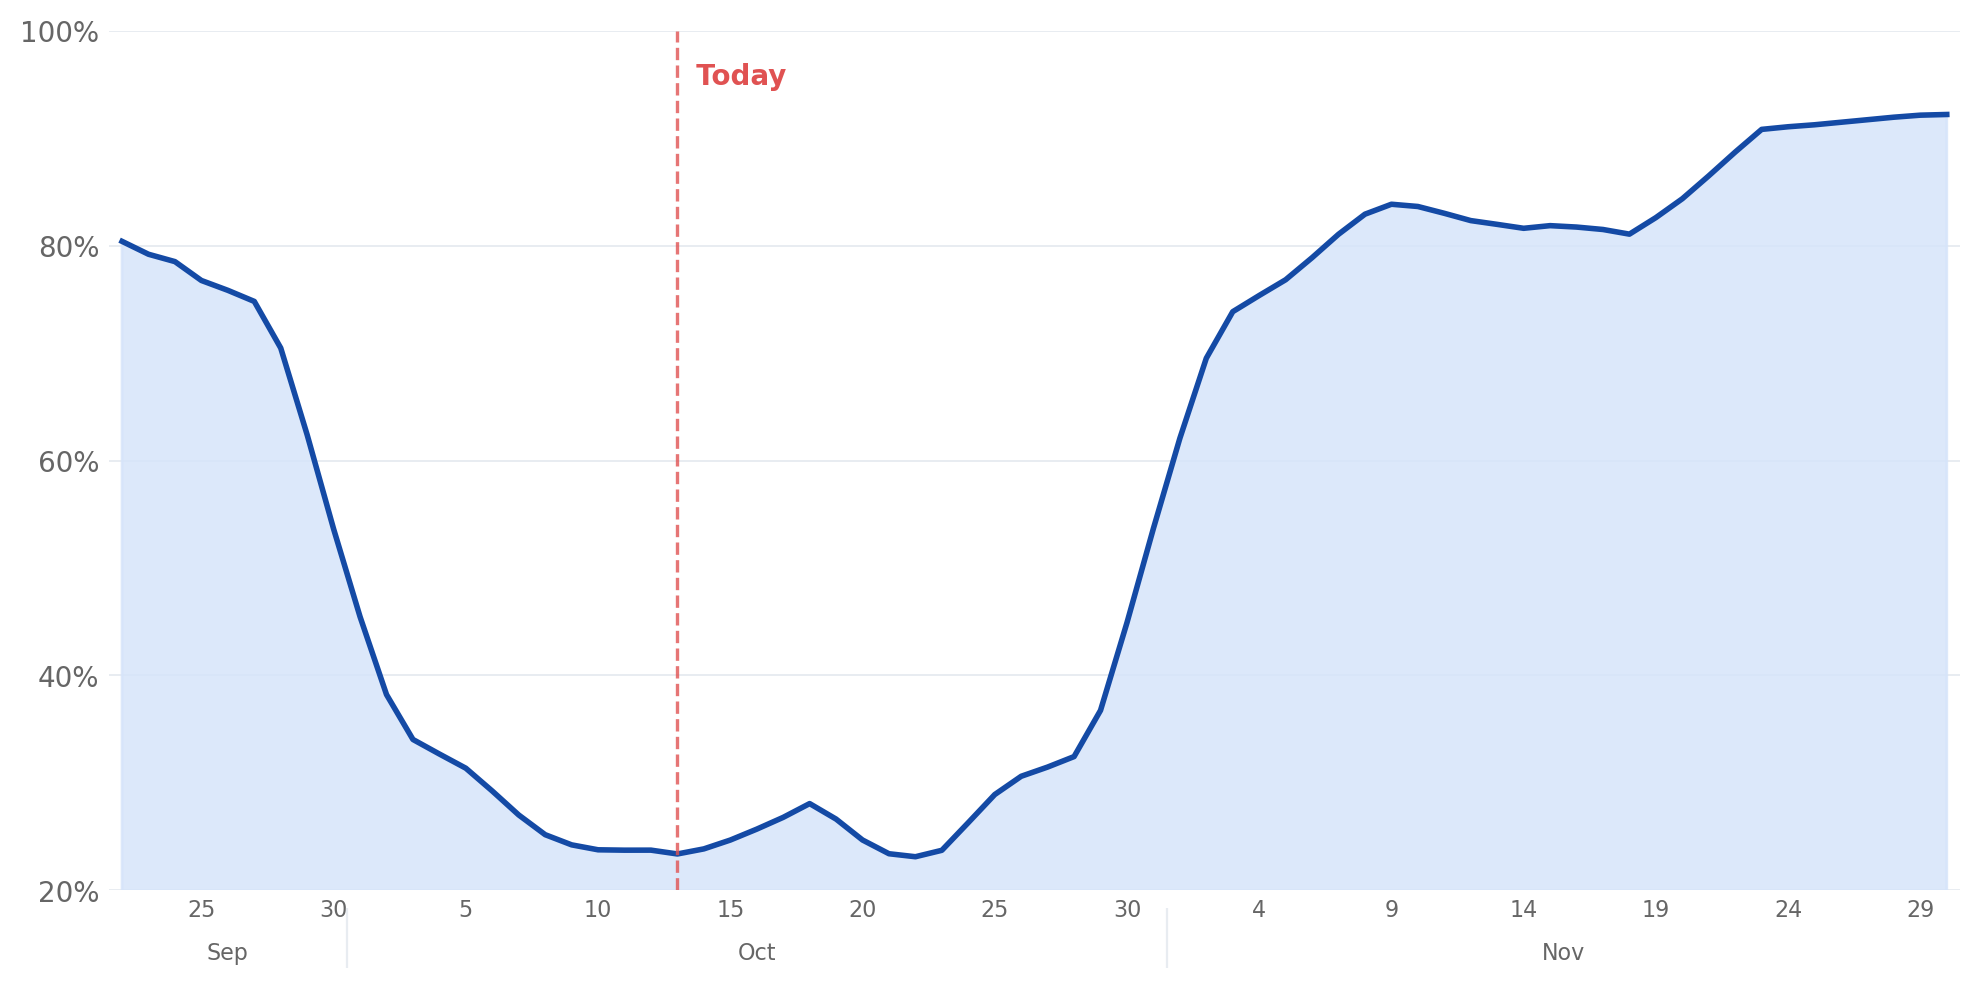
The corporate bid is also approaching an important turning point. We are currently in peak earnings blackout, with just 24% of S&P 500 index weight outside repurchase blackout windows. That figure rises to ~55% by month-end, ~75% by November 3 (Midterm Election Day), and ~85% by November 9, as companies report earnings and trading windows reopen.
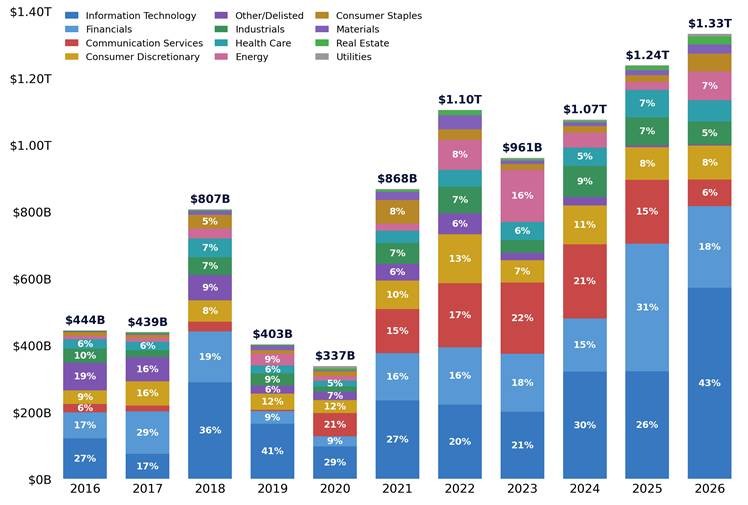
US corporates have already announced a record $1.3 trillion of share repurchase authorizations YTD, 8% ahead of last year’s record pace. Technology alone accounts for $573 billion, or 43% of the total.
2. Early Signs of Rotation
One of the more notable developments over the last several sessions has been the improvement in equal-weight performance relative to the largest index constituents. After a quarter dominated by a handful of mega-cap stocks, we are beginning to see some of that relative performance reverse, with participation improving across a much broader group of sectors.
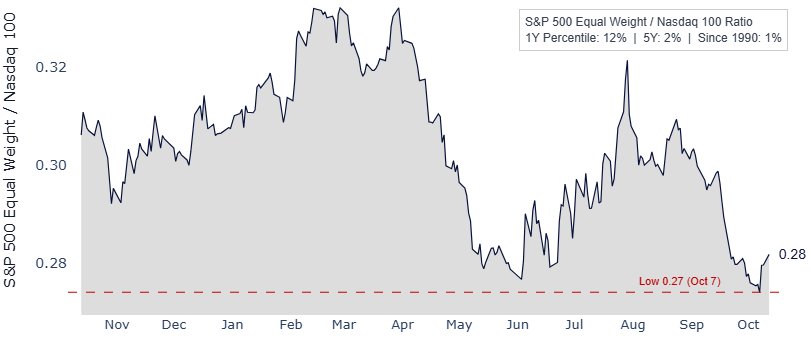
The S&P 500 Equal Weight / Nasdaq 100 ratio reached its lowest level since April 2000 on October 7, following nearly 9% relative underperformance since mid-August.
The reversal is still early, but notable. Equal weight has outperformed the Nasdaq 100 by 2.8% over the last three sessions, a 95th-percentile move since 1990. Despite that bounce, the ratio remains in just the 2nd percentile of its five-year range.
Participation has similarly started to improve beneath the surface. Since the Equal Weight / Nasdaq 100 ratio bottomed on October 7, 76% of S&P 500 constituents have outperformed the index. The improvement has been broad across defensives (+2.2%), rate-sensitive sectors (+2.0%), and cyclicals (+1.6%). Technology has been the notable laggard, with just 42% of constituents higher.
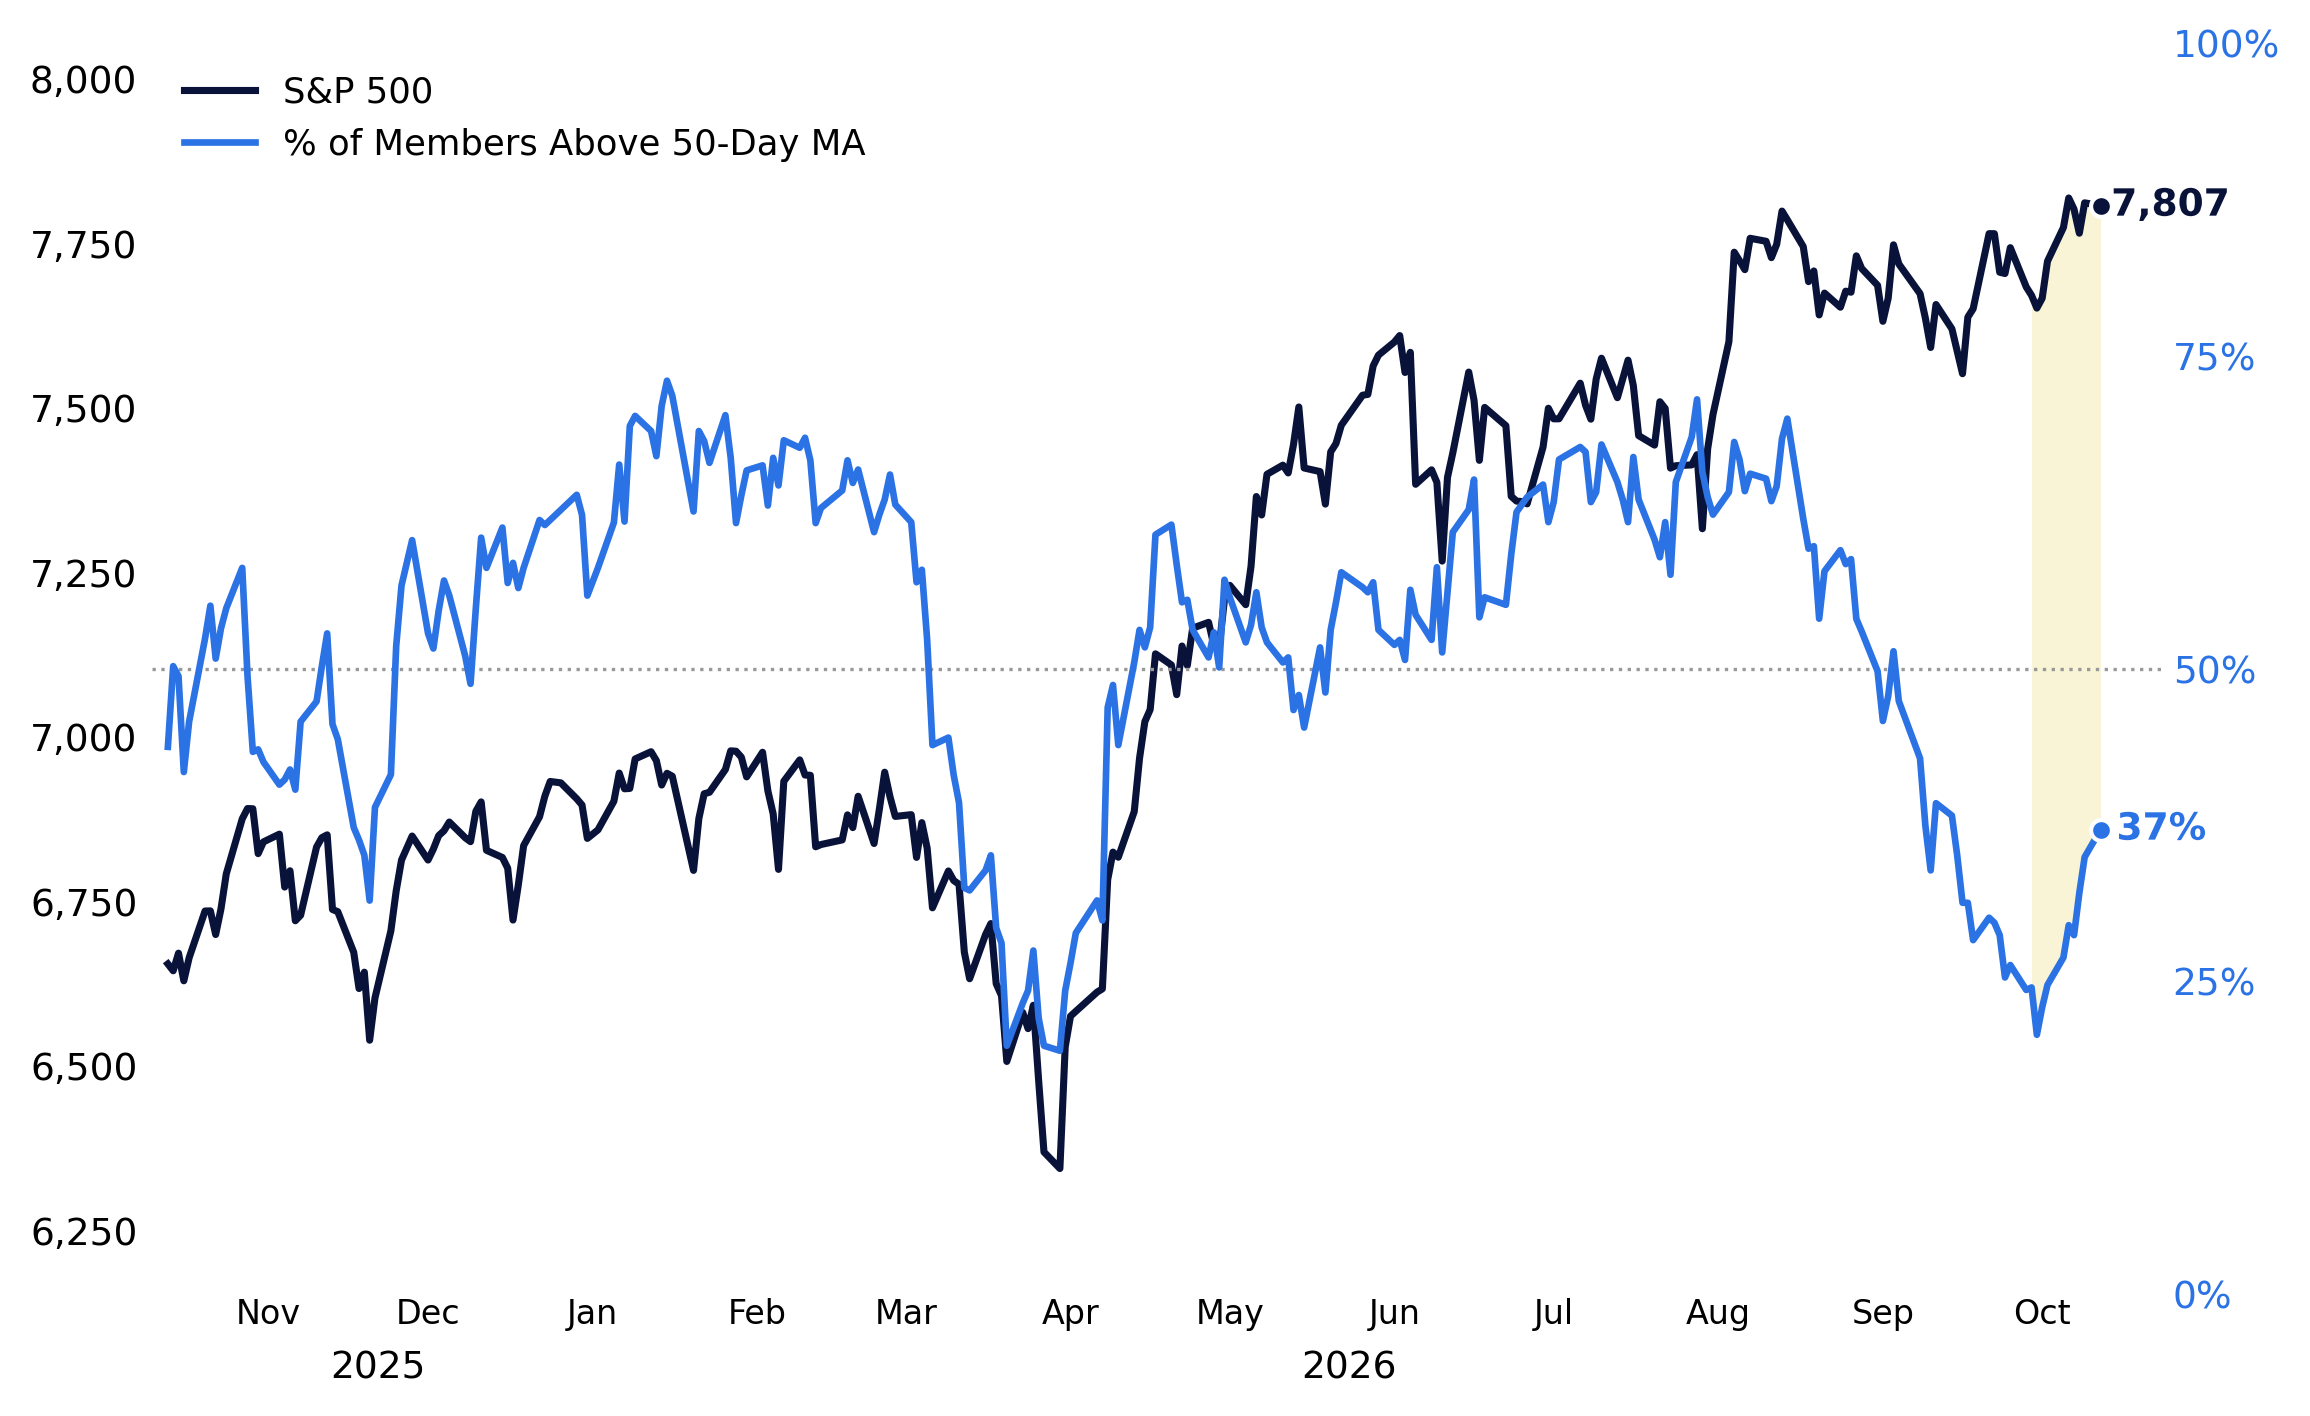
Breadth has also improved since our last update. The share of S&P 500 constituents trading above their 50-day moving average has risen from 25% to 37%, although that remains in just the 16th percentile vs. the past year.
Historically, fewer than half of similar rebounds from extreme relative-performance lows have led to continued equal-weight outperformance over the following month. But after months of increasingly concentrated index performance, the recent improvement in participation is encouraging, particularly as earnings begin to test a much broader group of companies.
3. Retail Buying Returns
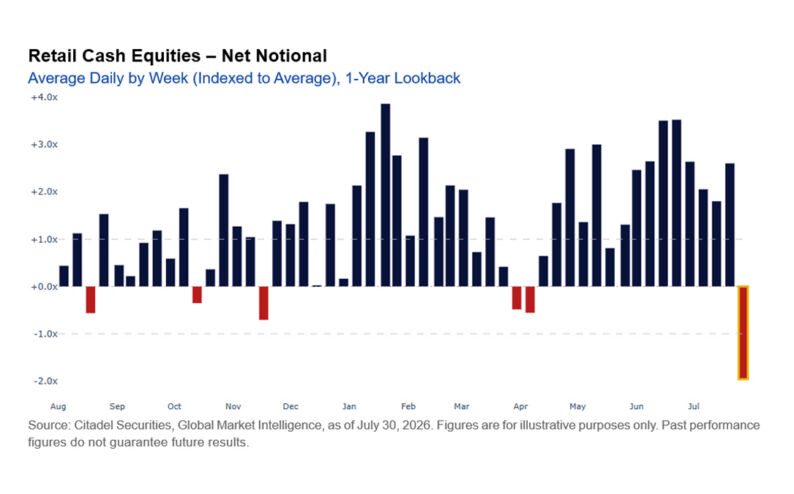
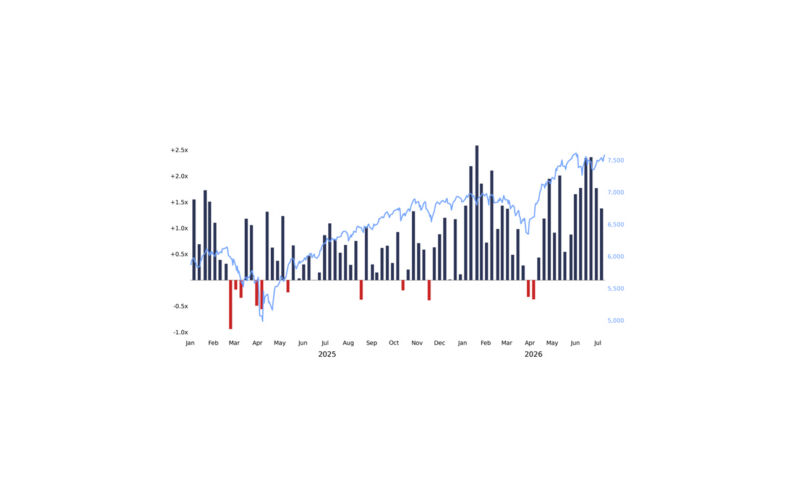
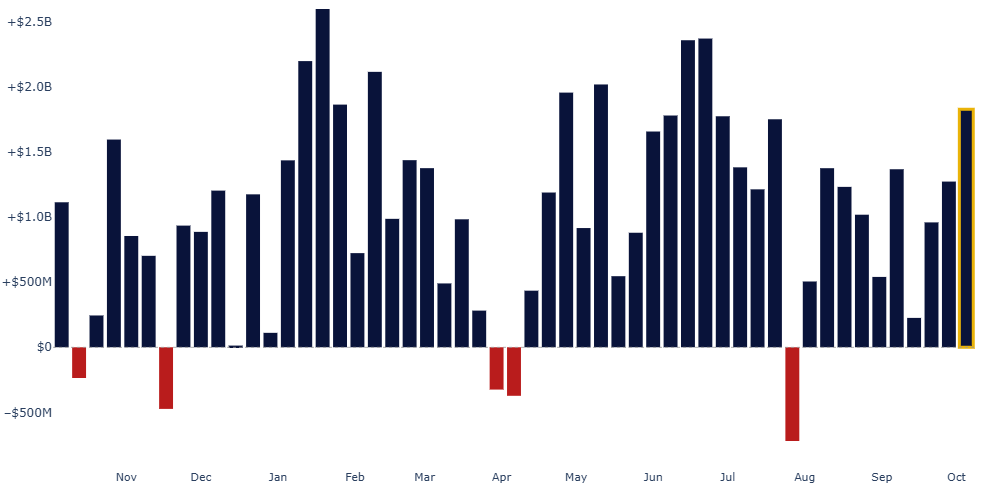
Retail buying is picking up again, even as overall trading activity remains below average. Last week, retail net bought $9.1 billion of US equities on our platform, the largest weekly net buying in 15 weeks (since late June) and the ninth-largest week over the past year.
The increase has been driven by stronger directional conviction rather than elevated volumes. Retail was 2.7% better to buy last week, a 90th-percentile reading for weekly directional skew, while gross trading activity remained in just the 42nd percentile of the past year. Weekly net buying has now increased for three consecutive weeks, from $4.8 billion to $6.4 billion and $9.1 billion.
Buying has been heavily concentrated in ETFs and the AI complex. Across themes:
- Semiconductors: $2.6 billion net bought, the third-largest week of the past year (96th percentile). At the current pace, October is on track to be the largest month of net buying on our platform, running at 3x the 1Y average.
- AI Infrastructure: $2.4 billion net bought, the fourth-largest week of the past year (94th percentile).
- Neoclouds: $700 million net bought, the largest weekly accumulation we have observed in the group.
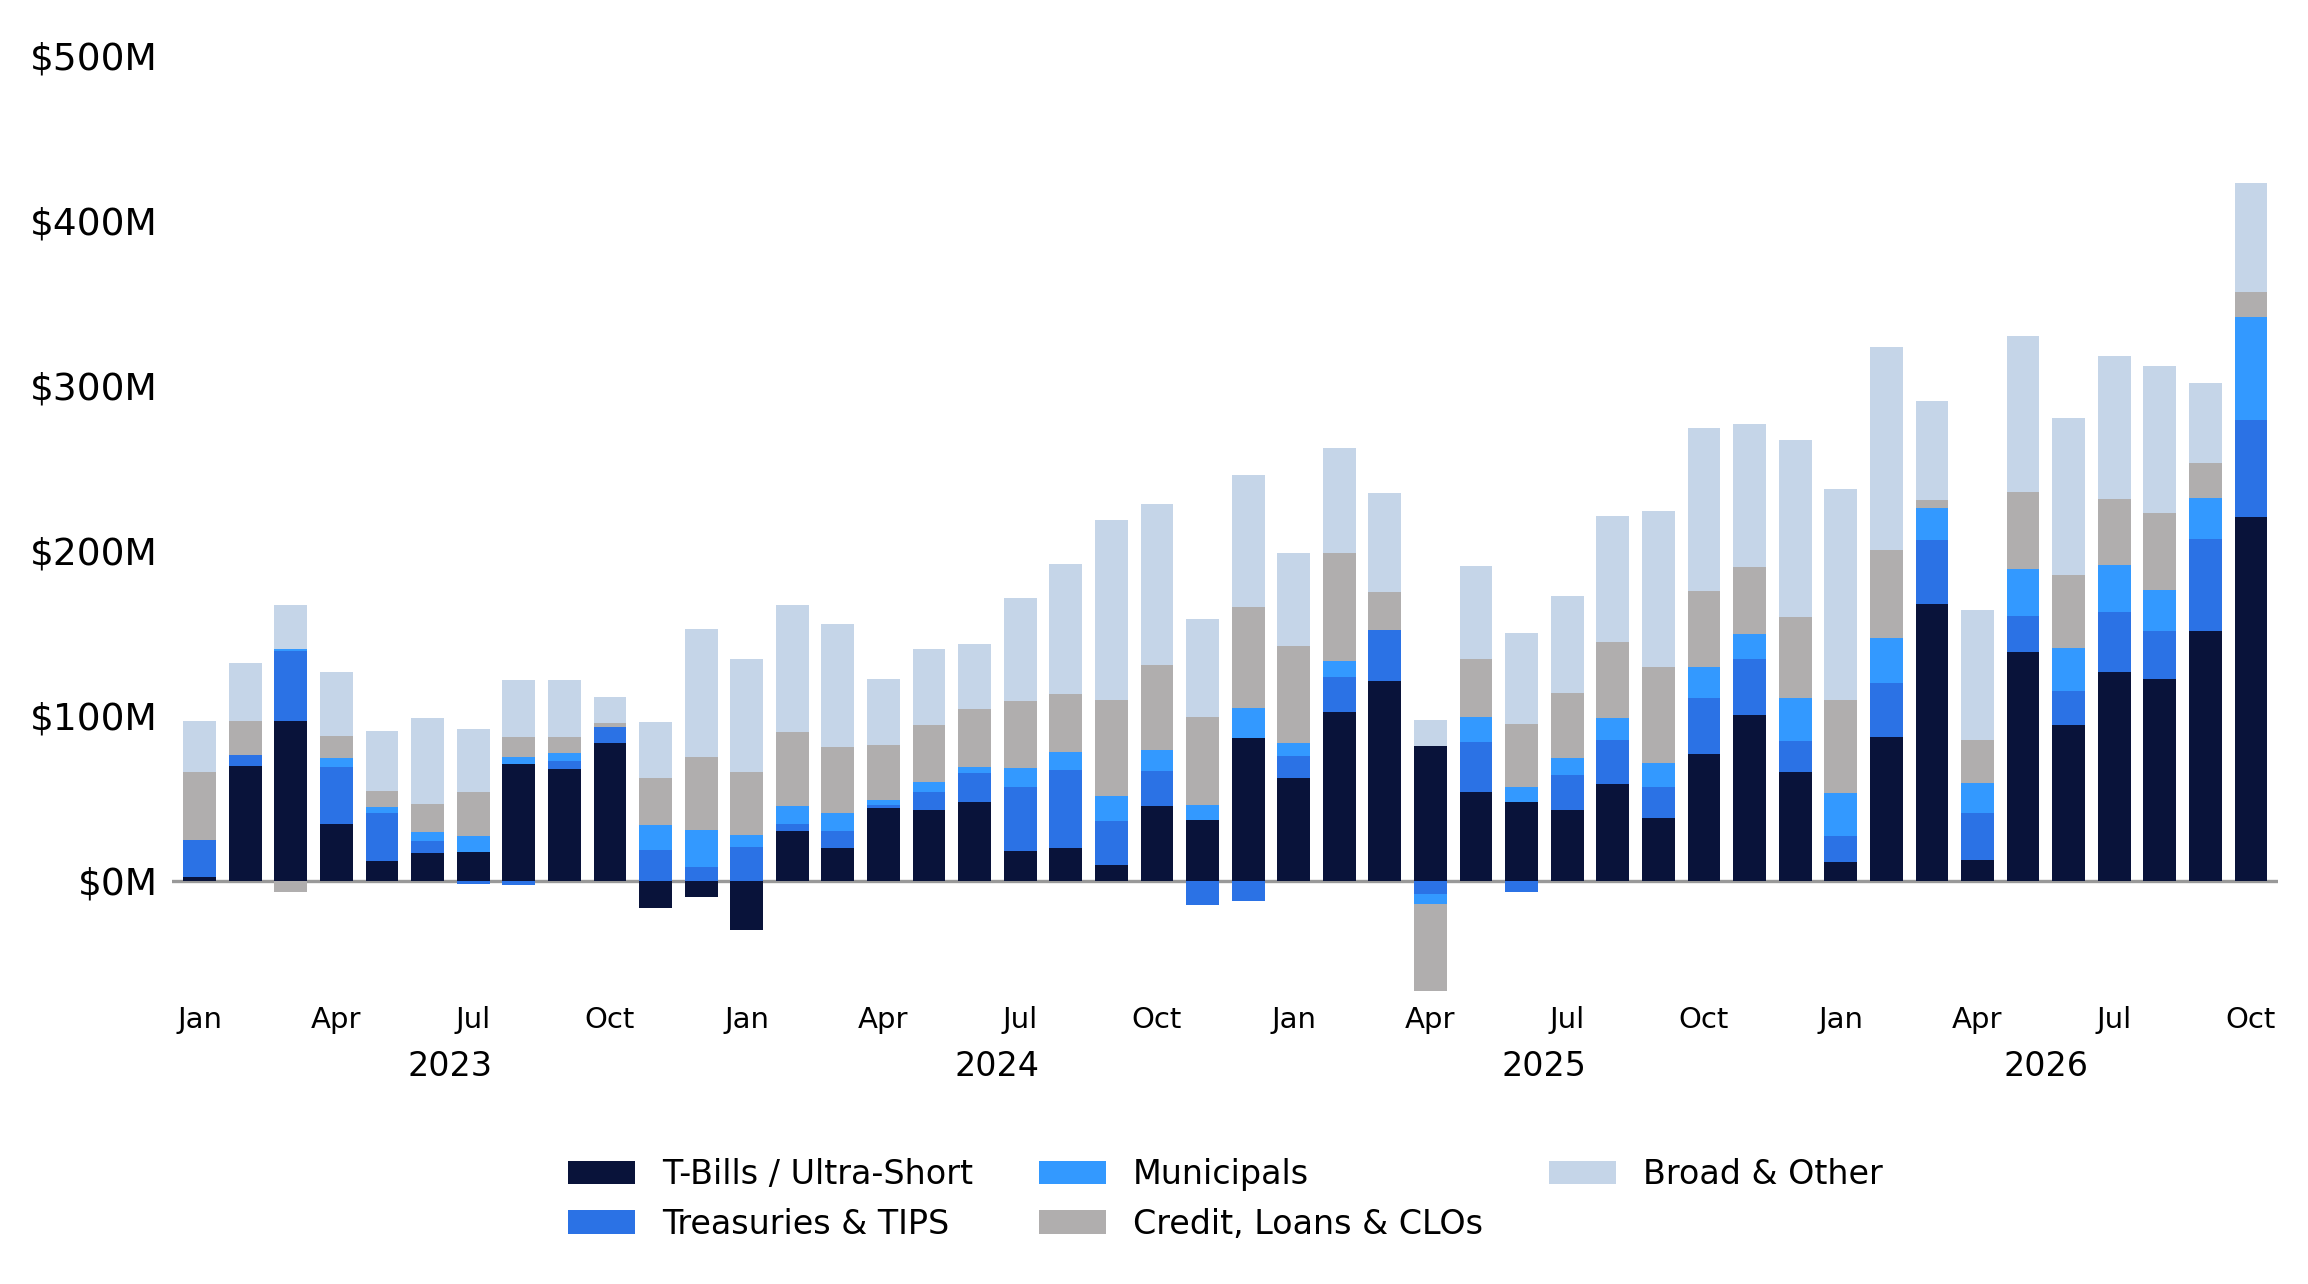
We are also seeing record-paced demand for fixed-income ETFs. Retail has net bought nearly $3 billion across bond ETFs through the first seven sessions of October, averaging $422 million per day, 28% above the previous monthly record pace. The buying has been concentrated in T-bills and ultra-short duration (2.3x the trailing 1Y average), municipal bonds (2.6x) and Treasuries (1.9x), while credit, loan and CLO ETFs are seeing just 0.4x their usual demand. If the current pace holds, October would be the largest month of retail fixed-income ETF buying in our dataset since 2017.
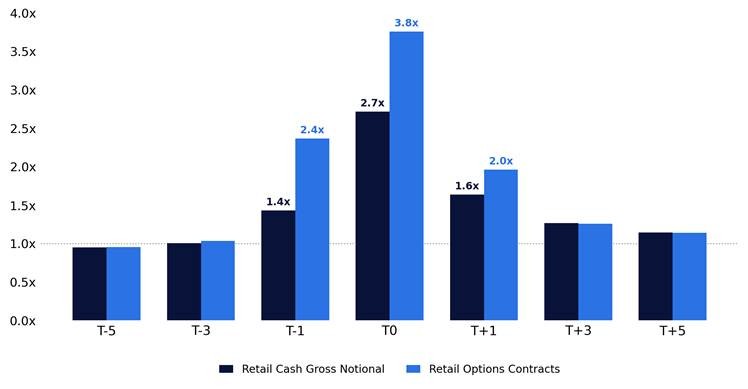
Ahead of every earnings season, we receive a significant number of client questions around retail cash and options activity in individual names. As the #1 US retail market maker, we have a differentiated view of how retail investors trade around these events, both historically and in real time.
As we move through earnings season, we encourage clients to reach out to our desk for real-time color on retail cash and options activity in individual names, particularly around upcoming earnings announcements.
4. Still No Bid for Index Volatility
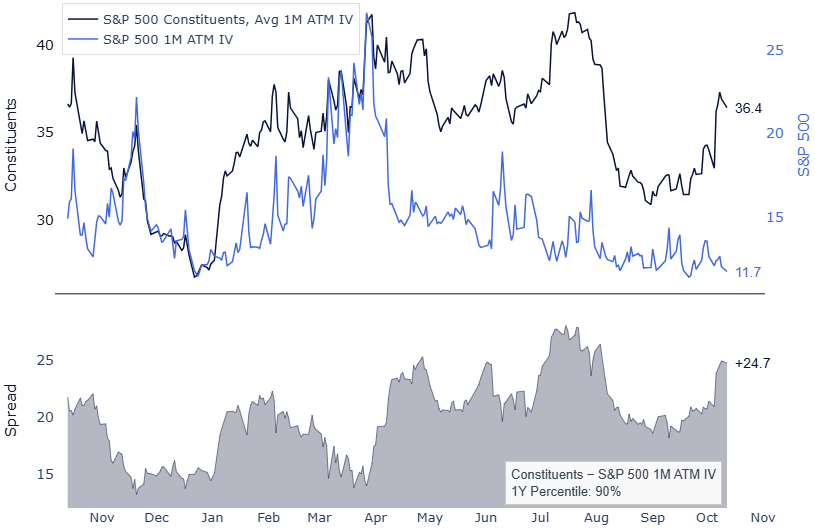
One of the more striking features of this market has been the continued divergence between single-stock and index volatility. The persistent rotation between winners and losers has pushed volatility higher across individual stocks and sectors, while offsetting moves beneath the surface have helped keep index volatility near its lowest levels of the past year.
As we highlighted in our last GMI, single-stock volatility had reset toward its historical average relative to the index ahead of earnings. That spread has since widened sharply. Since September 29, the average S&P 500 constituent’s 1-month ATM implied volatility has risen from 34.1% to 36.4%, while S&P 500 implied volatility has declined from 13.2% to just 11.7%.
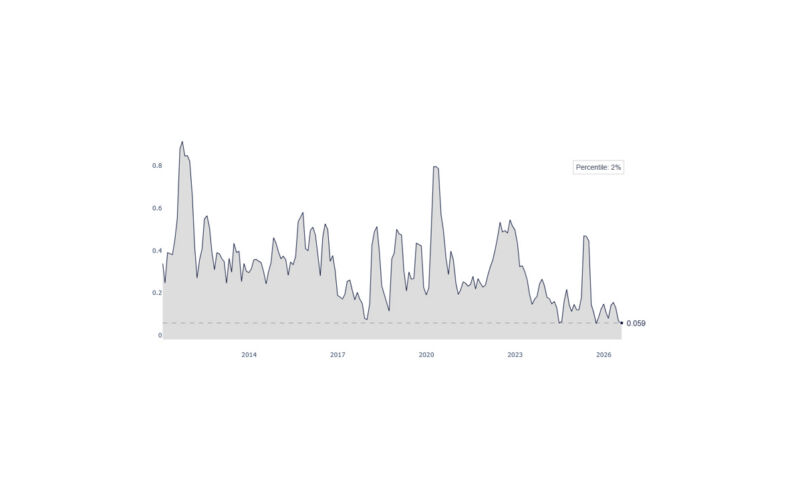
The spread between the two has widened by nearly 4 vol points to 24.7, now in the 90th percentile of the past year. The ratio of single-stock to index volatility has reached 3.1x (98th percentile), while 1-month implied correlation has fallen to just 7.6%, the 1st percentile of its history since 2006.
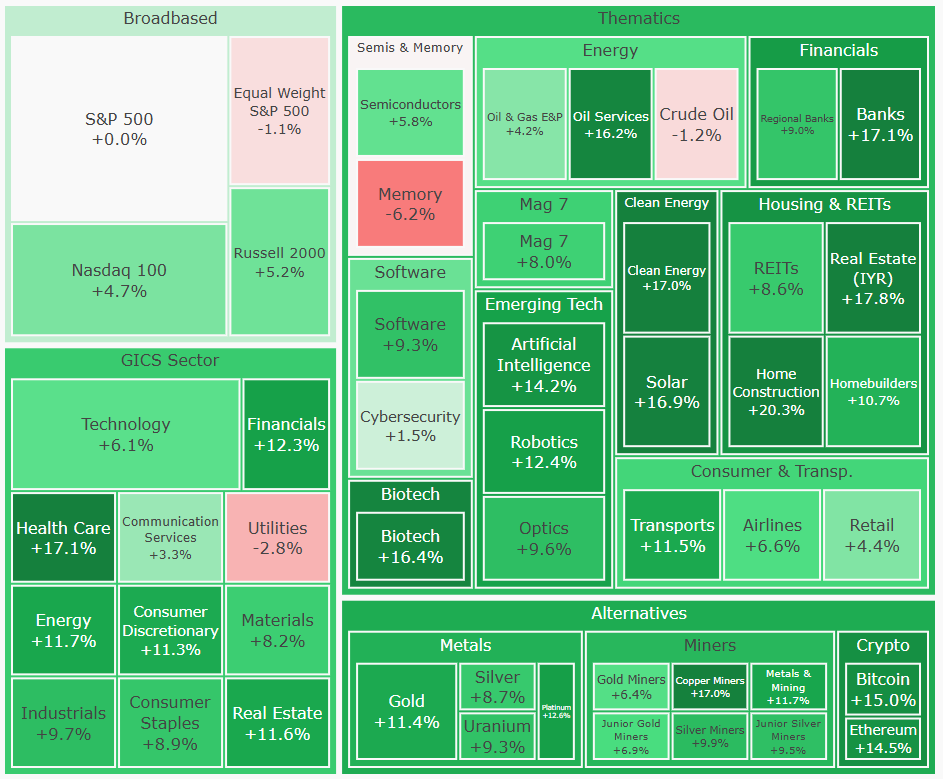
The relative outperformance of single-stock volatility has been broad-based. Since the beginning of October, implied volatility across nearly every major sector and investment theme we track has outperformed S&P 500 volatility. Banks (+17%), Biotech (+16%), AI (+14%), and Software (+9%) are among the largest relative outperformers, even as index implied volatility has continued to decline.
Part of what has kept index implied volatility so depressed is the remarkable lack of realized movement. The S&P 500 has not experienced a 2% move in either direction since June 5, a stretch of 88 trading sessions, with not a single occurrence in Q3 or October so far. The index has also gone 52 consecutive sessions without a 1% decline (since July 29).
The magnitude of the compression is striking:
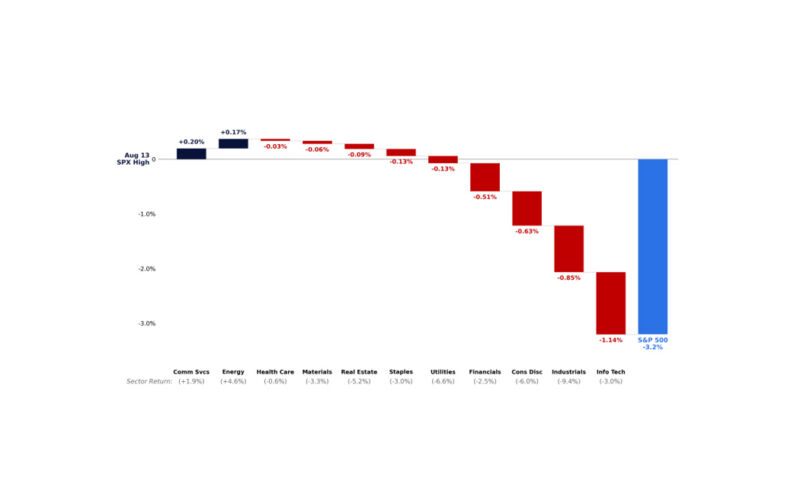
- Just three 1% moves in the 41 sessions since the August 13 high, vs. 9 in a typical 41-session window.
- 57 of the 72 sessions since July 1 have closed within 2% of an all-time high, with the largest closing drawdown from a running high limited to 3.9%.
- 10-day realized volatility has fallen to 7.2%, in the 5th percentile of the past year. Even longer-term measures remain subdued, with 21-day realized at 9.9% (15th percentile) and 63-day realized at 11.1% (10th percentile).
Another remarkable feature of this market has been the absence of broad-based selling. We are approaching a full year without a single 80% NYSE downside-volume day, defined as a session when at least 80% of NYSE total volume is concentrated in declining stocks.
Since 1996, the average calendar year has experienced 21 such sessions, and no completed year has recorded fewer than five. The last occurrence was November 17, 2025, roughly 225 trading sessions ago, already the longest stretch in nearly 30 years of data. The previous record was just 129 sessions.
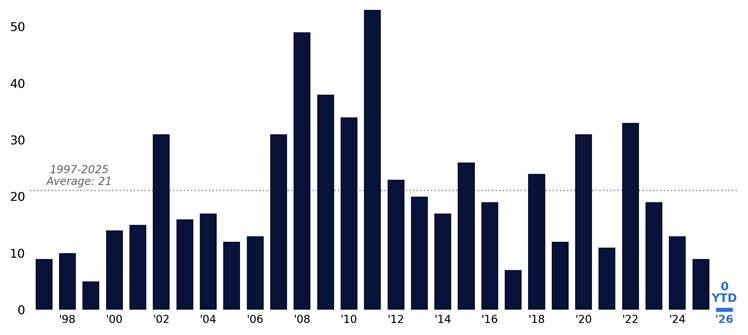
Despite macro uncertainty, geopolitical headlines, and some extreme moves across individual sectors and themes, investors have continued to rotate between winners and losers rather than indiscriminately reduce equity exposure. That lack of correlated selling has helped keep index volatility depressed, even as single-stock volatility remains relatively elevated.
With earnings adding another concentrated source of idiosyncratic risk, we see room for single-stock volatility to become even richer relative to the index. At the same time, index implied volatility near its one-year lows offers relatively attractive entry levels for protection against a shift from rotation to broad-based de-risking, when correlations could rise sharply.
GMI Bottom Line
Our constructive Q4 view remains intact, with several of the dynamics highlighted in our last note beginning to materialize.
- Earnings: Expectations remain exceptionally strong, with forward earnings estimates rising even as valuations have compressed. Nearly half of the S&P 500 will report in five sessions, while corporate buyback windows begin reopening against a record year of authorizations.
- Rotation: Equal weight has begun to recover from historically depressed relative levels, with improving participation across defensives, cyclicals and rate-sensitive sectors. The recovery in market breadth is an encouraging development after months of narrow leadership.
- Retail: Buying has accelerated sharply, driven by stronger directional conviction rather than higher volumes. Demand remains concentrated in index ETFs, Semiconductors and AI infrastructure, alongside record-paced buying of fixed-income ETFs.
- Volatility: Single-stock volatility continues to outperform the index as correlations remain near historical lows. Earnings could reinforce that divergence, while low index implied volatility offers relatively attractive protection against a shift toward correlated selling.
We continue to favor selective single-stock exposure over simply adding index beta. The recent improvement in participation is promising, but the next several weeks will provide a much more meaningful test of whether it can persist.
Please let us know how we can be most helpful as you position into Q4.
Copyright © Citadel Enterprise Americas LLC or one of its affiliates. All rights reserved.
Legal Entities Disseminating this Material: This material is disseminated in the United Kingdom by Citadel Securities (Europe) Limited (“CDGE”) authorized and regulated by the Financial Conduct Authority (“FCA”) (Registered company number: 05462867); in the European Union by Citadel Securities GCS (Ireland) Limited (“CSGI”) and its Paris Branch authorized and regulated by the Central Bank of Ireland (“CBI”) (Registration Number: C173437); in Hong Kong by Citadel Securities (Hong Kong) Limited (“CDHK”) licensed by the Securities and Futures Commission of Hong Kong (“SFC”), in Japan by Citadel Securities Japan Co., Ltd (“CSJC”) registered as a Type 1 financial instruments business operator with the Japan Financial Services Agency (“JFSA”); and in the United States of America by Citadel Securities LLC (“CDRG”) registered with the Securities Exchange Commission (“SEC”), Financial Industry Regulatory Authority (“FINRA”), and Securities Investor Protection Corporation (“SIPC”), Citadel Securities Institutional LLC (“CSIN”) registered with the SEC, FINRA, and SIPC, or Citadel Securities Swap Dealer LLC (“CSSD”) registered with the SEC, Commodities Futures Trading Commission (“CFTC”), and National Futures Association (“NFA”). Unless governing law permits otherwise, you must contact a Citadel Securities entity in your home jurisdiction if you want to use our services in effecting a transaction in any financial instruments or securities, including derivatives.
FOR INSTITUTIONAL USE ONLY; FOR PROFESSIONAL CLIENTS AND ELIGIBLE COUNTERPARTIES ONLY. This material is not intended as and does not constitute investment research. Contents of this material will be strictly limited to non-specific, generic information (i.e. macro events/topics) and are not subject to the Markets in Financial Instruments directive (MiFID II) or FINRA research rules. This material does not constitute an offer, solicitation, invitation, or inducement to purchase, acquire, subscribe to, provide, or sell any financial instrument or otherwise engage in investment activity. Please see additional important disclosures, including disclosures that may be relevant to your country of residence or business at www.citadelsecurities.com/GlobalSalesTrading.